Talk to any seasoned investor, and they'll tell you the market has a personality. Some days it's calm and predictable; other days, it's a wild, bucking bronco. That erratic behavior is what we call market volatility.
Think of it as the market's heartbeat. When things are quiet, you get a slow, steady pulse. But when uncertainty hits, that pulse becomes rapid and erratic. It’s the single best measure of the fear and greed swirling through the financial world at any given moment.
Your Guide to Navigating Market Volatility
If you've ever turned on the financial news, you know exactly what I'm talking about. One day, stocks are hitting all-time highs, and the next, they seem to be in a nosedive. Those dramatic swings are volatility in action.
But here’s the thing: volatility isn't necessarily the enemy. It's easy to get spooked, but those big price swings are also where the biggest opportunities hide. An asset that’s moving all over the place has the potential for massive gains, just as it carries the risk of serious losses. The trick is to understand what's causing the commotion and how to handle it in your own portfolio.
Market Volatility Key Concepts at a Glance
Before we dive deep, this table gives you a quick snapshot of the core ideas we'll be breaking down. It’s a handy reference to keep the main points straight as we go.
| Concept | Simple Explanation | Why It Matters to You |
|---|---|---|
| Market Volatility | The speed and size of price changes in the market. | High volatility means bigger potential gains and losses; it's a measure of risk. |
| VIX (Fear Index) | A real-time tracker of expected volatility in the S&P 500. | It's the market's "fear gauge" – when it's high, investors are nervous. |
| Beta | How much an individual stock moves compared to the overall market. | A stock with a Beta over 1 is more volatile than the market; under 1 is less volatile. |
| Standard Deviation | A statistical measure of how spread out an asset's returns are. | Helps you understand an investment's historical price swings and potential risk. |
Think of this as our map. Now, let’s get into the details of what makes the market tick—and sometimes, what makes it go haywire.
The Role of Volatility in Investing
At its core, volatility is just the most visible part of investment risk. Every single investment you make, whether it’s stocks, bonds, or real estate, has some degree of uncertainty baked in. Volatility is just that uncertainty playing out in real-time through price changes.
Getting a handle on the different types of investment risk gives you the complete picture of all the forces that can push your portfolio around.
Think of this guide as your compass for navigating those choppy waters. We’re going to break down what causes these market storms, how the pros measure them, and most importantly, the practical steps you can take to steer your investments through it all.
Grasping this concept is the first step toward becoming a more confident investor. Volatility is a feature of the market, not a bug, and learning to navigate it is essential for long-term success.
My goal here is to give you the knowledge to make smart decisions, whether the market is sailing on smooth seas or weathering a hurricane. By the end, you'll have a toolkit to not only protect your portfolio but also find opportunities to grow it, no matter the forecast.
What Causes the Market to Swing
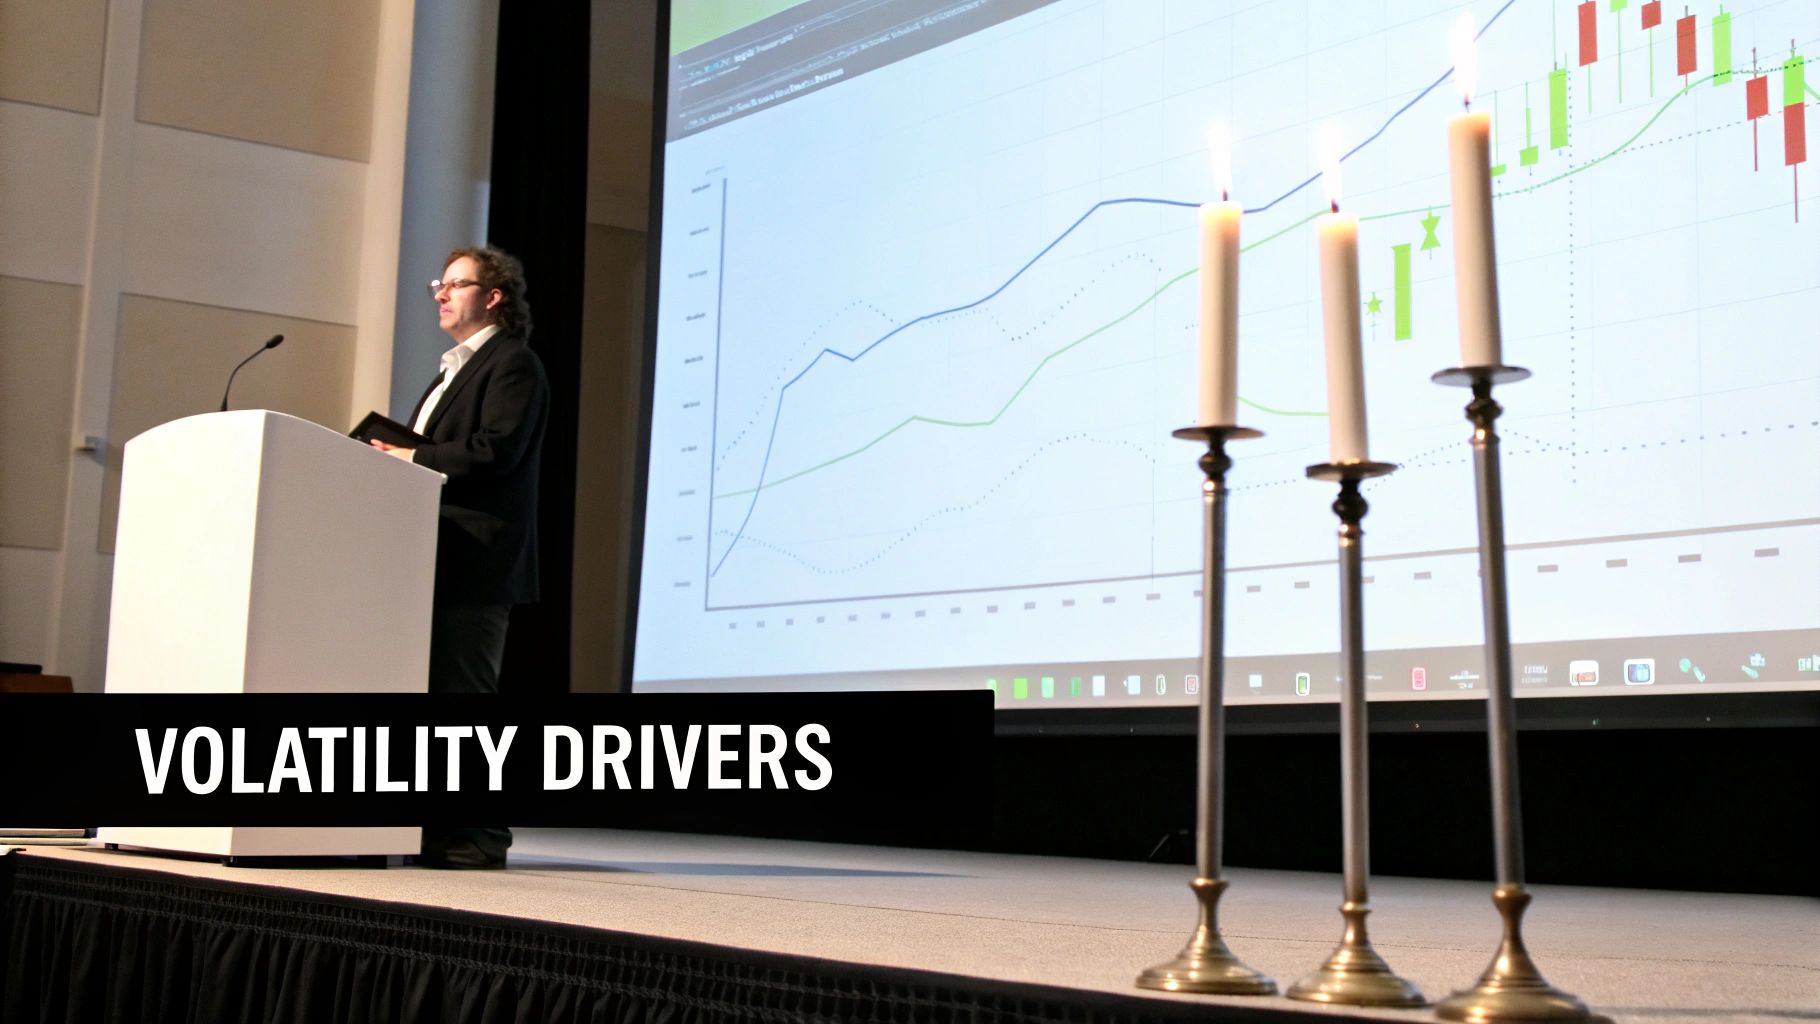
Market volatility doesn't just happen. It's born from uncertainty, and it's fueled by real-world events that dramatically shift what investors think the future holds.
Imagine the market as a giant, collective brain trying to put a price tag on every asset based on all the information it has. When that information changes in the blink of an eye, so do the prices. That's a market swing in action.
The most common triggers are usually big economic data releases. Reports on inflation, employment numbers, or consumer spending can send shockwaves through the markets, especially if they catch analysts by surprise.
For instance, if inflation numbers come in hotter than anyone expected, investors might immediately start worrying that the Federal Reserve will raise interest rates. Higher rates can slow down the economy and squeeze corporate profits, forcing a rapid, widespread re-evaluation of what stocks are actually worth.
The Impact of Broader World Events
It’s not just about domestic economic reports. Global events play a massive role in sparking market volatility.
Things like geopolitical tensions—think trade wars between major countries or sudden military conflicts—create a thick fog of uncertainty. And if there's one thing investors truly dislike, it's uncertainty. It makes forecasting future earnings and economic growth incredibly difficult.
Central bank policies are another huge driver. When a central bank like the Federal Reserve announces it’s changing interest rates, it directly affects borrowing costs for businesses and regular people. A rate hike can make investors nervous about a potential recession, while a surprise rate cut might signal confidence and send markets soaring.
The market is a forward-looking machine. Volatility arises when the picture of the future suddenly becomes blurry, forcing millions of investors to adjust their strategies all at once.
Of course, this mass adjustment isn't always perfectly rational. In fact, a huge piece of the puzzle is simple human emotion. Collective investor psychology can amplify volatility like nothing else.
Waves of fear can trigger panic-selling that sends prices spiraling far below their fundamental value. On the flip side, widespread greed can inflate massive asset bubbles. This emotional element is why market swings can sometimes feel totally illogical.
Connecting News to Market Moves
At the end of the day, almost any major headline has the potential to move the needle. It could be a breakthrough in artificial intelligence that sends tech stocks flying, or a natural disaster that cripples global supply chains.
The market is constantly being bombarded with new information, and learning how to connect the dots is a critical skill for any investor.
When you start to understand these drivers, you stop seeing volatility as just random noise. You see it for what it is: the market reacting, in real-time, to an ever-changing world. Building this foundation is one of the first steps in learning how to analyze stocks for beginners and making smarter decisions.
By recognizing what triggers these swings, you can better prepare your portfolio to handle the turbulence and even learn to spot opportunities that others might miss. It turns volatility from something to fear into a puzzle you can learn to solve.
How We Measure Market Turbulence
So, how do we actually put a number on market volatility? Investors don’t just fly blind; they have specific tools to take the market's temperature, helping them figure out if the waters are calm or if a storm is brewing. It really boils down to two approaches: looking at the past and trying to predict the future.
The first method is called historical volatility, which is a bit like driving while looking in the rearview mirror. It simply measures how much an asset's price has bounced around in the past. The go-to tool for this is standard deviation. If that sounds like something from a high school math class, don't worry—it’s just a way to see how spread out an asset's returns have been from its average. A high standard deviation means the price has taken some wild swings, signaling higher volatility.
Reading the Market's Crystal Ball
The second, and often more talked-about, method is implied volatility. This one is more like a weather forecast. It’s a forward-looking guess at how much turbulence the market expects in the near future. Instead of digging through old price data, it looks at the current prices of options contracts to get a feel for investor sentiment. When traders think big moves are coming, they'll pay more for options, which in turn pushes implied volatility higher.
This image breaks down the key metrics we use to get a handle on these different sides of market risk.
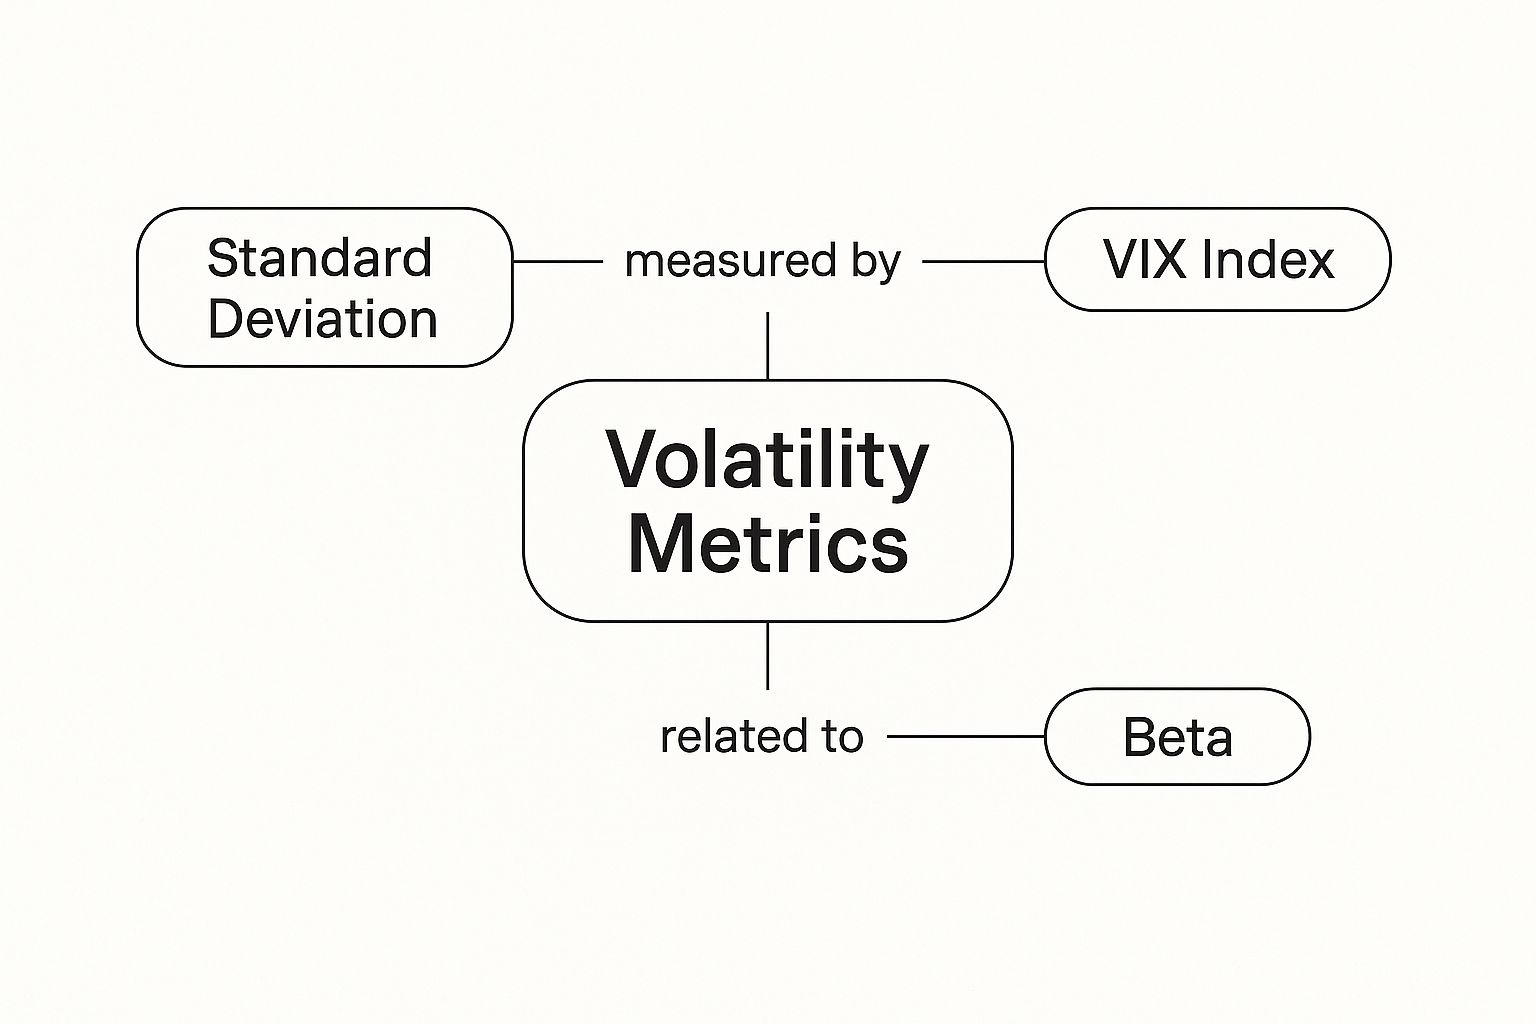
As you can see, standard deviation, the VIX, and Beta each offer a unique lens for viewing and measuring the market's mood.
Meet the VIX: The Fear Gauge
You’ve probably heard of the CBOE Volatility Index, better known as the VIX. It’s the most famous measure of implied volatility and for good reason—it’s often called the "fear gauge." The VIX reflects the market's expectation of volatility for the S&P 500 over the next 30 days.
Since it was created in 1993, the VIX has become an indispensable barometer for how investors are feeling. For instance, during the 2008 financial crisis, it shot up past 80, a massive jump from the sub-20 levels you see in calmer times.
A high VIX reading (typically over 30) signals a whole lot of fear and uncertainty. It means investors are strapping in for some major price swings. On the flip side, a low VIX (below 20) usually points to confidence and maybe even a little complacency in the market.
Understanding these numbers isn't just for Wall Street pros. For everyday investors, knowing if volatility is high or low gives you critical context for your own decisions. It helps you decide if it’s a time to be cautious or if widespread fear might be creating some interesting opportunities.
This kind of knowledge is a cornerstone as you learn to master stock valuation methods and build a portfolio that can weather any storm. By learning to read tools like the VIX, you get a much better feel for how the headlines connect to the real-time mood of the market.
If you’ve only ever invested in U.S. stocks, you might think of volatility as a somewhat predictable beast. But it’s a whole different animal depending on where you are in the world. The relatively tame price movements in a developed market can feel worlds away from the wild, unpredictable swings you’ll often see in emerging markets across Asia or Latin America.
Geography, it turns out, plays a massive role in an asset's risk profile.
It’s not random, either. Established economies tend to have mature regulatory systems, stable political landscapes, and enormous, liquid markets. This foundation naturally creates a more predictable environment for investors, which usually translates to lower volatility. Sure, price swings still happen, but they’re often driven by things like economic data and corporate earnings—not sudden political chaos.
The Dynamics of Emerging Markets
Emerging markets, on the other hand, march to the beat of a much faster, more erratic drum. Their higher volatility is a direct result of a few key ingredients:
- Political Instability: Developing nations can go through rapid political shifts, and that kind of uncertainty spooks businesses and investors alike.
- Economic Transitions: These economies are often in the middle of super-charged growth and massive structural changes. This makes them much more vulnerable to shocks and quick reversals in investor sentiment.
- Currency Fluctuations: An emerging market's currency can swing wildly against major players like the U.S. dollar. This adds a whole other layer of risk—and volatility—to your investments.
When you mix these factors together, you get a much more turbulent investing landscape. It's plain to see when you look at the data. For instance, the stock market in Pakistan from 1999 to 2021 saw huge price swings directly tied to its economic and political journey. Japan's market, from 1984 to 2021, tells a different story of cycles and external shocks. You can dig into more of these global volatility trends over at the St. Louis Fed.
Understanding this regional risk is non-negotiable for anyone investing internationally. The same strategy that works like a charm in Germany could be a complete disaster in Brazil.
Ultimately, this global patchwork of volatility underscores one of the most fundamental principles of smart investing: diversification. Spreading your money across different geographic regions can help balance out your portfolio. While one market is taking a nosedive, another could be hitting new highs. This approach doesn't get rid of risk entirely, but it can help you build a much more resilient portfolio that’s ready to weather storms, no matter where they start brewing.
Practical Strategies for Volatile Markets
Knowing what market volatility is is one thing. Actually learning how to handle it is where the rubber meets the road for successful investors.
Turbulent markets can be incredibly unsettling, no doubt about it. But with the right game plan, you can navigate them with confidence instead of fear. The trick is to stop reacting emotionally and start acting methodically.
A well-thought-out plan, something you put together when things are calm, becomes your anchor in a storm. These are the proven techniques that help manage risk and keep your eyes on the prize—your long-term financial goals—even when the market feels like it’s going haywire.
Build a Resilient Portfolio with Diversification
The single most powerful weapon in your arsenal against volatility is diversification. There's a reason the old saying "don't put all your eggs in one basket" is the cornerstone of investing. Spreading your money across different types of assets helps cushion your portfolio when one area takes a nosedive.
When one part of your portfolio is struggling, another might be doing just fine—or even thriving. This balance helps smooth out your overall returns. You’ll want a solid mix of assets like:
- Stocks: They offer the highest potential for growth but also bring the most volatility to the table.
- Bonds: These are generally more stable, provide income, and often move in the opposite direction of stocks.
- Real Estate: Can be a great hedge against inflation and provide steady cash flow, moving independently of traditional financial markets.
- Commodities: Assets like gold can act as a "safe haven" when the economy gets shaky and investors get nervous.
The whole point is to own a collection of assets that don't all zig and zag in the same direction at the same time. That balance is what gets you through the unpredictable swings of the market.
Asset allocation isn't just some generic strategy; it's your personalized blueprint. It aligns your investments directly with how much risk you're comfortable taking and what you're trying to achieve, making sure you stay on a path that lets you sleep at night.
Embrace Consistency with Dollar-Cost Averaging
Another killer strategy is dollar-cost averaging. This is a fancy term for a simple concept: you invest a fixed amount of money at regular intervals, no matter what the market is doing.
Think of it as putting your investing on autopilot. By investing consistently, you naturally buy more shares when prices are low and fewer shares when they're high.
This disciplined approach takes the emotion out of it and stops you from trying to "time the market"—a game that even the pros rarely win. Over time, this can lower your average cost per share and seriously reduce the impact of volatility on your portfolio. It makes for a much smoother ride.
Master Your Mindset to Avoid Costly Mistakes
At the end of the day, the biggest threat to your portfolio during a volatile period isn't the market itself. It’s you.
Fear and greed are powerful emotions that can lead to terrible decisions, like panic-selling at the very bottom or piling into a hot stock just as the bubble is about to pop.
The best way to fight this is to have a clear, long-term plan and the discipline to stick with it. You have to remind yourself that downturns are a completely normal, expected part of investing. For more on keeping a level head, check out these essential stock market investing tips that hammer home the long-term perspective.
Your strategy is your best defense against making emotional, short-sighted moves you'll later regret.
Finding Opportunity in Market Volatility
For most people, the gut reaction during a market nosedive is to sell everything and protect what's left. But if you can make one crucial shift in your thinking, you'll start to see market volatility not just as a threat, but as a massive opportunity.
When fear is running the show, asset prices can completely detach from their real, long-term value. Think of it like this: market downturns are basically a Black Friday sale for high-quality stocks. They give disciplined investors a chance to buy into fantastic companies at a huge discount. The trick is learning to ignore the panicked noise and focus on the solid business fundamentals underneath.
Turning Fear into a Strategic Advantage
Making this mindset shift isn't about being reckless; it's about having patience and a rock-solid plan. Instead of freaking out over scary headlines, you're actively hunting for chances to buy assets you already believe in, just at a much better price. Suddenly, widespread market panic becomes your personal strategic advantage.
We can actually measure this panic. Market volatility is quantified by how wildly stock prices are swinging. For example, back in 2021, the U.S. stock price volatility index was 24.99, which was considered moderately turbulent at the time. Keeping an eye on these metrics gives you context, helping you tell the difference between normal market chop and a truly unusual event. You can learn more about how these figures reflect market conditions.
The big takeaway here is that volatility is completely normal. Understanding it gives you power, and having a well-defined strategy is your best defense. A prepared investor doesn't fear downturns; they get ready for the opportunities that come with them.
This isn't just about stocks, either. The same principles apply across different types of investments. While we're mostly talking about traditional markets, some people look for stability elsewhere. For a different perspective on building a portfolio, you might find it interesting to explore the world of investing in unique tangible assets like collectible coins.
Ultimately, you want an investment approach that can do well no matter what the market is doing. By remembering that volatility is just part of the game and that a good strategy is everything, you can stay confident and prepared. This allows you to make calm, rational decisions, turning moments of chaos into calculated moves for long-term growth.
Answering Your Questions About Market Volatility
Even after you get the hang of what market volatility is, a few questions always seem to pop up. Let's tackle some of the most common ones head-on to clear things up.
Does High Volatility Mean a Market Crash Is Coming?
Not necessarily. It's easy to see why people make that connection, but it's a bit of a misconception.
While big market downturns are almost always volatile, a spike in volatility is really just a sign of uncertainty. Think of it as the market getting jumpy. This could be due to anything from a surprising economic report to some geopolitical drama that has investors on edge.
We often hear about the VIX, the so-called "fear gauge," spiking during these times. But it's crucial to remember what it's actually measuring: expected turbulence over the next 30 days. It’s a short-term sentiment snapshot, not a crystal ball predicting a long-term collapse.
What Are the Safest Investments During Volatile Times?
When the stock market starts swinging wildly, you'll see a lot of investors run for cover in what are known as "safe-haven" assets. These are investments that have a reputation for either holding their value or even going up when everything else is going down.
The classic safe havens include:
- Government Bonds: U.S. Treasuries are the big one here. They're backed by the full faith and credit of the U.S. government, which makes them the go-to choice for capital preservation.
- Precious Metals: Gold is the king here. For centuries, it has been seen as a reliable store of value when economies get rocky.
- Certain Currencies: The U.S. dollar, funny enough, often acts as a global safe harbor. When uncertainty hits the world stage, money tends to flow into the dollar.
The key is that these assets usually don't move in lockstep with the stock market. That low correlation is what provides that crucial balancing act for a well-diversified portfolio.
How Should I Use the VIX in My Investment Strategy?
The best way to think of the VIX is as a mood ring for the market, not a direct trading signal. It tells you what the general feeling is out there.
When the VIX reading is high (say, above 30), it's a pretty clear sign of fear and panic. Some disciplined, long-term investors actually see this as a potential buying opportunity. The logic is that when everyone is panicking, great companies might get thrown out with the bathwater and become undervalued.
On the flip side, a super low VIX reading (maybe below 20) can signal that investors are getting a little too comfortable and complacent. That might be a cue to take a more cautious or defensive stance in your own portfolio. It’s a useful tool, but it should always be just one piece of a much larger puzzle.
At Investogy, we cut through the noise by sharing the "why" behind every move in our real-money portfolio, helping you build conviction during volatile times. See our research and track our performance by subscribing to our free weekly newsletter. Learn more at Investogy.com.
Leave a Reply