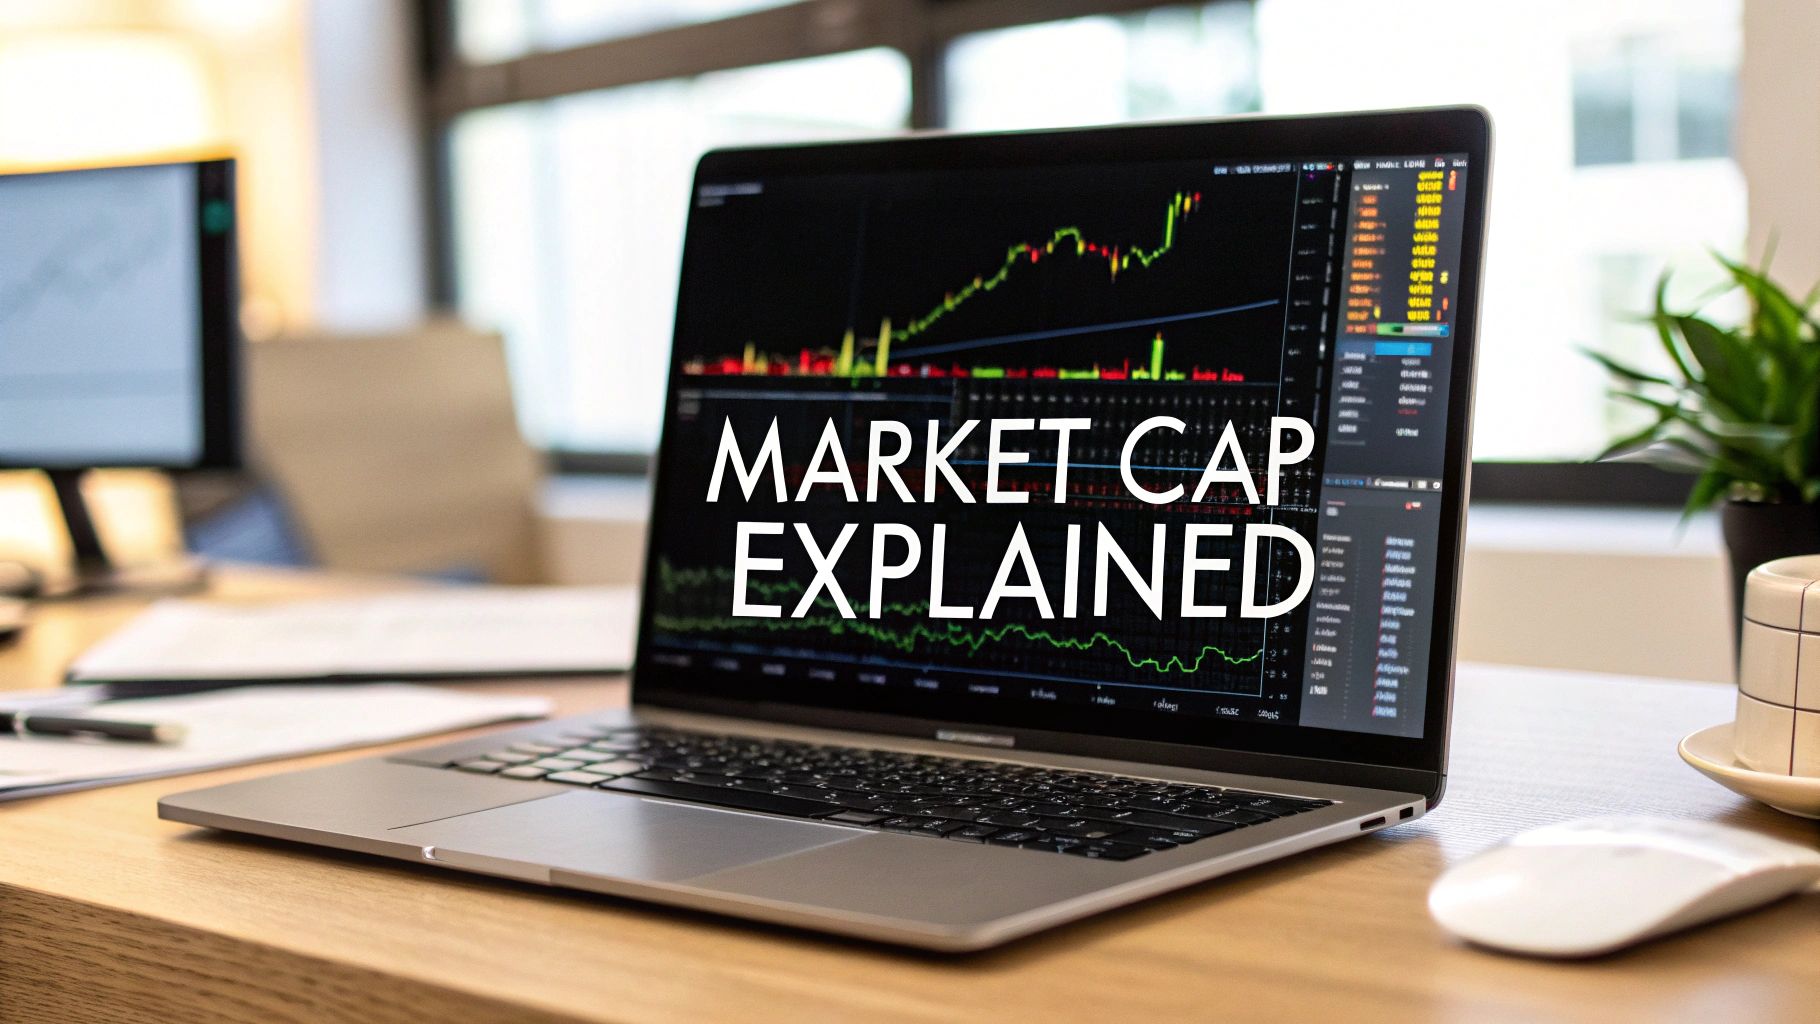
When you hear investors throw around the term market capitalization, they're really just talking about one thing: the total market value of a company's stock. Think of it like this—if you wanted to buy every single share of a company and take it private, the market cap is roughly what it would cost you. It's the market's current "price tag" for the whole business.
Unpacking the Concept of Market Capitalization

The name might sound a little technical, but the idea behind "market cap" is actually pretty simple. It gives you a quick snapshot of a company's size from the perspective of the entire investment world. For me, and for most investors, it’s one of the first things we look at. It helps you instantly categorize a company and get a feel for its potential risks and opportunities for growth.
Instead of getting bogged down in revenue, total assets, or the number of employees, market cap cuts straight to what the stock market thinks a company is worth. It’s a living, breathing number that’s constantly changing as the stock price ticks up and down throughout the day. This real-time valuation is a powerful reflection of everything from investor confidence and company performance to the mood of the broader economy.
The Simple Formula Behind the Big Number
Calculating a company's market cap is surprisingly easy. You only need two pieces of information, both of which are publicly available for any company on the stock market.
Here’s the formula:
Market Capitalization = Current Share Price × Total Number of Outstanding Shares
Let's quickly break down those two parts:
- Current Share Price: This one’s easy. It’s just the price of a single share on the open market right now.
- Total Number of Outstanding Shares: This is the total number of shares a company has issued that are held by all investors, from big institutions to everyday people like you and me.
Let’s run a quick example. Say Company XYZ has a stock price of $50 per share and there are 10 million shares out there. Its market cap would be $500 million ($50 x 10,000,000). It’s that simple.
With this one number, you have a solid starting point for comparing the relative size of different companies. You can immediately see that a $100 billion company is ten times larger than a $10 billion one, no matter what their individual stock prices are. Getting a handle on this is really the first step toward building a smarter investment strategy.
Understanding the Different Tiers of Market Cap
Once you've got a handle on the basic formula, you can start using market capitalization to size up companies. Think of it like boxing's weight classes; investors group businesses into different tiers based on their total market value. This simple classification is a great starting point for setting expectations about risk, stability, and growth potential.
These tiers aren't just arbitrary labels. They usually correspond to different stages in a company's life cycle. A company's size directly impacts how it behaves as an investment—from its daily stock price swings to its long-term prospects for expansion.
The image below breaks down the simple but powerful calculation that determines a company's size.
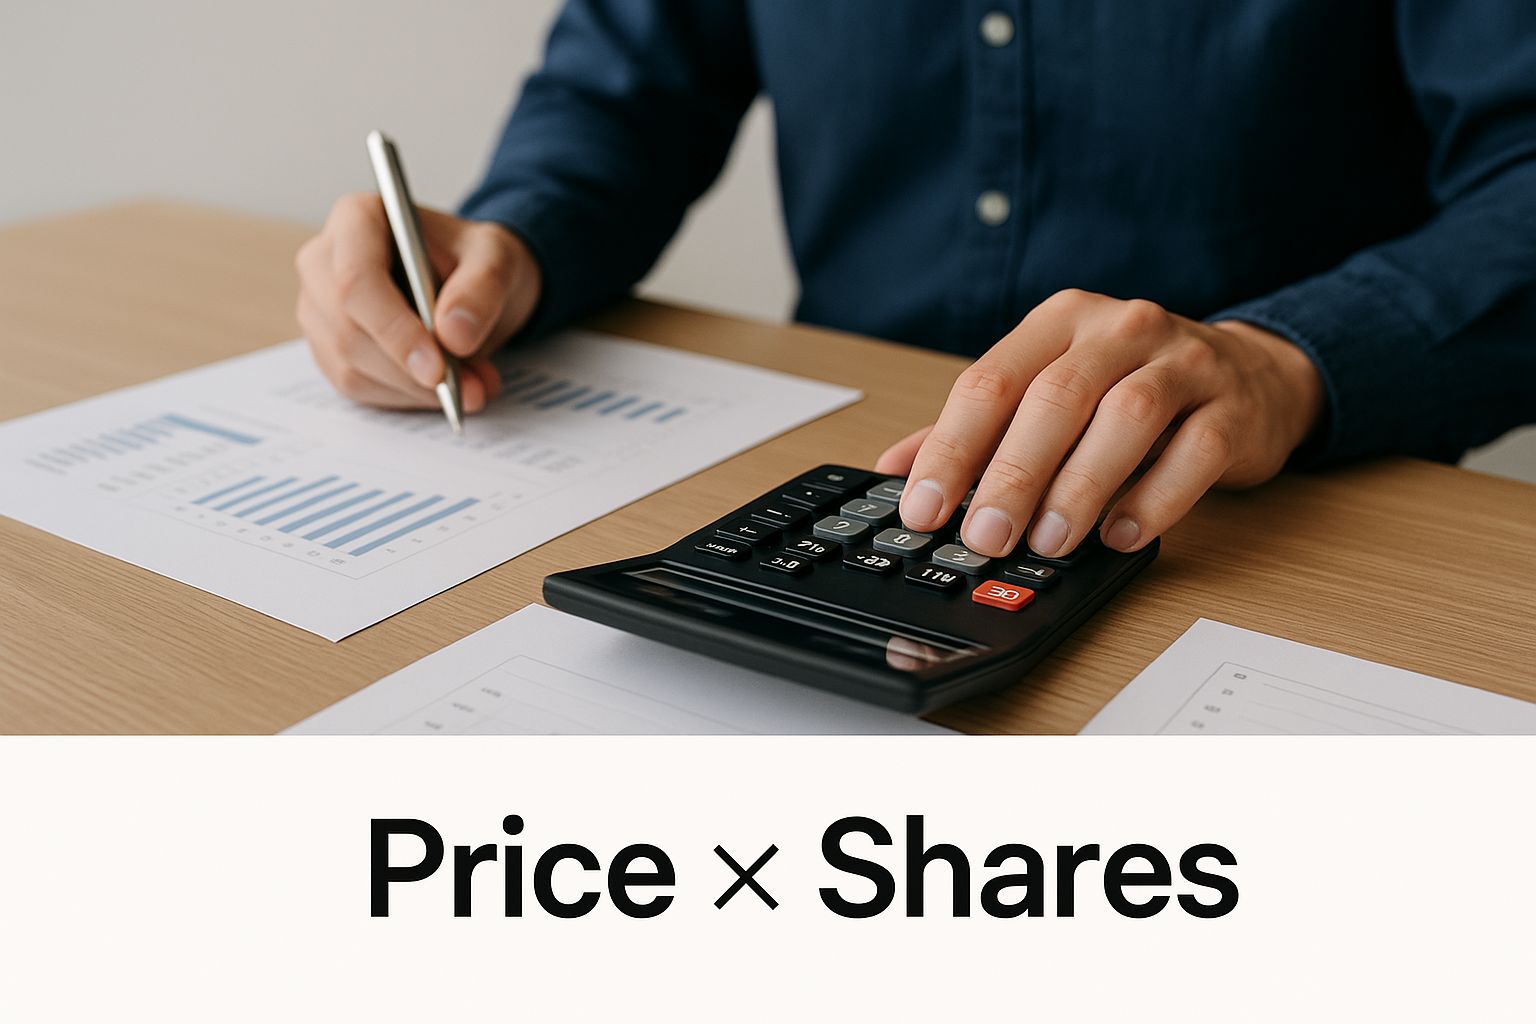
This math is the first step every investor takes. It helps place a company into one of the main tiers, which in turn frames the entire investment analysis.
To make this crystal clear, here’s a quick overview of the main market cap tiers you'll encounter.
Market Cap Tiers at a Glance
| Category | Typical Market Cap Range | Key Characteristics |
|---|---|---|
| Large-Cap | $10 billion or more | Well-established, stable, often pay dividends. Lower risk, slower growth. |
| Mid-Cap | $2 billion to $10 billion | Balanced growth and stability. Have proven business models but still have room to expand. |
| Small-Cap | $300 million to $2 billion | High growth potential. Younger, more innovative, but also more volatile and risky. |
These ranges aren't set in stone, but they provide a solid framework for understanding what you're looking at. Let's dive a little deeper into each one.
Large-Cap Companies: The Market Heavyweights
Large-cap stocks are the giants of the market, typically valued at $10 billion or more. These are the blue-chip, household names you already know—think Apple, Microsoft, and Johnson & Johnson. They've earned their dominant positions in their respective industries.
Because of their sheer size and consistent revenue, large-caps are generally seen as less risky investments. Sure, their growth might be slower, but they often bring stability to a portfolio and frequently pay out dividends. That's why they're a cornerstone for so many long-term investors.
Mid-Cap Stocks: The Growth and Stability Sweet Spot
Next up are the mid-cap companies, which sit comfortably between the titans and the upstarts. Their market caps usually fall somewhere between $2 billion and $10 billion. These are businesses that have successfully navigated their early growth spurts but still have plenty of runway left to expand.
Mid-caps offer a compelling mix of what makes the other two groups appealing. They tend to have more growth potential than the large-caps but more stability than their smaller peers. This balance makes them a go-to for investors who want a middle ground between aggressive growth and proven security. This kind of analysis is a core part of building an investment thesis; you can learn more about this by exploring our guide on what is fundamental analysis.
For many investors, mid-caps really do represent the best of both worlds. They're established enough to have proven themselves but are still nimble enough to chase growth opportunities that the bigger players might overlook.
Small-Cap Stocks: High Risk and High Potential
Finally, we have the small-cap companies. These are the agile, scrappy players in the market, generally valued between $300 million and $2 billion. They're often younger companies operating in innovative or niche markets where the potential for explosive growth is very real.
But all that potential comes with a healthy dose of risk. Small-caps can be incredibly volatile and are much more vulnerable to things like economic downturns or a big competitor moving in on their turf. Investing here requires a higher tolerance for risk, but the payoff can be massive if you pick a company that grows into the next mid-cap or large-cap success story.
Seeing the Bigger Picture with Global Market Cap

It’s one thing to know a single company’s market cap, but seeing how it fits into the global economic puzzle gives you a whole new level of perspective. A company's size is always relative. A large-cap giant in one country might look surprisingly modest next to the titans of a much larger economy.
When you zoom out and look at the world stage, you start to see where the real financial power is concentrated. This is a big deal because modern markets are all interconnected. An economic shift, a new policy, or a tech breakthrough in one region can send ripples across the entire globe. Understanding this helps you appreciate the true scale of the multinational corporations that operate across these different economic zones.
Where the World’s Value Is Concentrated
The distribution of market value isn't even close to being even. As of early 2025, the total global stock market capitalization is a mind-boggling $124 trillion. But this incredible wealth is heavily clustered in just a few key economic powerhouses.
The United States is the undisputed leader, with its markets accounting for roughly $60 trillion, or a massive 48.6% of the world’s total. China is a distant second at $15.58 trillion (12.6%), with the European Union right on its heels at $14.99 trillion (12.1%).
When you add it all up, these three dominant regions represent over 73% of the entire global market capitalization. That incredible concentration shows you just how much influence they have on worldwide financial trends.
Other major players include Japan ($6.2 trillion), a rapidly growing India ($5.18 trillion), and the combined markets of Africa and the Middle East ($5.09 trillion). This data really hammers home the sheer scale of the U.S. market and explains why what happens there has such a profound impact everywhere else. If you want to dig deeper, you can see a full regional breakdown of the $124 trillion global stock market on Visual Capitalist.
Why This Global View Matters to You
So, what does this big-picture view mean for you, the individual investor? It’s simple: knowing where a company is listed and how its home market stacks up globally provides crucial context about its growth potential and the risks it carries.
Think about it. A company based in a smaller, emerging market might have more room for explosive growth, but it could also be more vulnerable to regional instability. On the other hand, a large-cap company in the U.S. benefits from the deep liquidity and relative stability of the world's largest market. This global awareness is a key ingredient for making smarter, more well-rounded investment decisions.
How Market Cap Tells a Company's Story
Market cap isn't just a static number on a screen; it's a dynamic, living story of a company's journey. It reflects the company's triumphs, its struggles, and the market's ever-shifting feelings about its future. When you track a company's market cap over time, you're watching this story play out in real-time.
A killer product launch can send its valuation skyrocketing. A dismal earnings report or a scrappy new competitor? You'll probably see the market cap fall. These swings are direct feedback from the collective voice of investors, showing exactly how they react to news, performance, and the economic winds.
Learning to read this story—how a company's market cap reflects its growth stage and market perception—is a critical skill when you start to evaluate investment opportunities.
Market Cap in Motion: A Real-World Example
Let's look at a real company to see how this works. GlobalData (DATA.L), a UK-listed firm, gives us a great example of a market cap story filled with growth and contraction. As of early 2025, its market cap hovered around $1.35 billion.
But its history is where the real story is. The company went through a massive growth spurt, with its market cap exploding by over 700% back in 2009 alone. More recently, between 2023 and 2025, it took a hit, dropping about 36% from $2.11 billion to its current $1.35 billion. You can dig into more of this historical data over on CompaniesMarketCap.com.
This rise and fall isn't just abstract data. It's the numerical footprint of real-world events: periods of aggressive expansion and smart strategies, followed by market corrections, tough economic conditions, or a simple shift in investor confidence.
This example is what turns market cap from a simple formula into a powerful analytical tool. The number itself is just one piece of the puzzle. The real gold is understanding why it's changing.
When you see a company’s market cap move, it should trigger a few key questions:
- Did they just report profits that blew past expectations?
- Is there a new headwind hitting their entire industry?
- Has something fundamentally changed about their long-term growth prospects?
Answering these questions usually means digging into other key metrics. If you want to get a better handle on how profits drive these valuation changes, our guide on what is earnings per share is a great next step. By connecting the dots between market cap movements and the company's actual performance, you start learning to read the market’s story.
Common Mistakes Investors Make with Market Cap
Market cap is a foundational metric, no doubt about it. But relying on it alone is like trying to drive a car with only a speedometer—you know how fast you're going, but you have no idea if you're about to run out of gas or drive off a cliff.
Understanding its limitations is what separates savvy investors from the crowd. If you can sidestep a few common traps, your investment analysis will be miles ahead of the game.
One of the most frequent blunders is confusing a high stock price with a large company. A stock trading at $500 per share feels more significant than one at $50, right? But that price tag tells you absolutely nothing about the company's actual size. Always, always use market cap for a true size-to-size comparison.
Mistaking Market Cap for True Value
Another critical error is treating market cap like it's the company's final price tag. It's not. Market cap only shows you the value of a company’s equity. It completely ignores two massive pieces of the financial puzzle: debt and cash.
Think about it this way: a company could have a $10 billion market cap but be drowning in $8 billion of debt. Suddenly, that $10 billion valuation looks a lot shakier, doesn't it? On the flip side, a company with a huge cash pile is far more resilient.
This is exactly why seasoned investors often turn to enterprise value (market cap + debt – cash) to get a more complete picture of what a company is really worth.
Using It as a Standalone Metric
Ultimately, the biggest mistake is using market cap as your one and only data point. It’s a great starting point—it tells you about size and what the market thinks—but it says zero about profitability, revenue growth, or how well the business is actually run. Good analysis demands context.
To really get under the hood of a business, you have to pair market cap with other fundamental metrics, such as:
- Price-to-Earnings (P/E) Ratio: This helps you figure out if a stock is cheap or expensive compared to its actual earnings.
- Revenue and Earnings Growth: Are sales and profits actually going up? This tells you if the business is expanding or stagnating.
- Cash Flow: This is the lifeblood of a company. It shows if they have the cash to pay bills, invest, and grow.
Using these metrics together helps you see the whole story. It lets you decide if you're looking at growth vs. value stocks and whether the market's current price tag is actually justified by the company's performance.
Answering Your Market Cap Questions
Alright, let's run through a few common questions that pop up when people start digging into market cap. Getting these concepts down is crucial, so think of this as a quick way to lock in what we've already covered.
Is a High Share Price Better Than a Low One?
Not at all. In fact, getting hung up on the share price is a classic rookie mistake that can lead you down the wrong path.
Imagine a company with 10 million shares out there, each trading for $100. Its market cap is a cool $1 billion. Now, picture another business with 500 million shares, but each one only costs $3. That company's market cap is $1.5 billion. Even with a tiny share price, it's the bigger, more valuable company. Market cap is what tells you the company's true scale, not the stock price.
How Does Market Cap Affect Index Funds?
This is a big one. Most of the major indexes you hear about, like the S&P 500, are market-cap-weighted. What this means is that the companies with the biggest market caps pull the most weight and have the largest impact on the index's performance.
When you buy into an S&P 500 index fund, your money is automatically more concentrated in giants like Apple and Microsoft than in the smaller players at the bottom of the list. If those behemoths have a great day, they can pull the whole index up with them. The opposite is also true.
This weighting system is a crucial concept. It means that the performance of just a handful of mega-cap stocks can often dictate the direction of the entire market index, highlighting their immense influence.
Can a Company's Market Cap Fall Below Its Cash Balance?
Yes, it can happen, though it’s pretty rare and usually a five-alarm fire for the company. When a market cap dips below its net cash (meaning cash on hand minus all its debt), it's a sign that investors have an extremely bleak view of the business's future.
The market is essentially saying the company's actual operations—its products, its strategy, its people—are worth less than zero. For some hardcore value investors, this might flash as a potential bargain, but it’s a situation that demands a ton of research to figure out why everyone else is running for the exits.
At Investogy, we cut through the noise by focusing on in-depth analysis of a single, real-money portfolio. Subscribe to our free weekly newsletter to see the research behind every move we make. https://investogy.com
Leave a Reply