
When you’re just getting started with investing, the sheer number of metrics can feel like you’re trying to drink from a fire hose. Revenue, debt, profit margins… where do you even begin?
For many seasoned investors, the answer is Earnings Per Share (EPS).
Think of it this way: a company's total profit is a giant pizza. EPS tells you exactly how big your slice is if you own just one share. It cuts through a lot of the noise to give you a straightforward, powerful look at a company's profitability from your perspective as a shareholder.
Why Earnings Per Share Is A Core Investing Metric

Before digging into the weeds of a financial report, savvy investors often check EPS first. It’s a quick pulse check.
It answers the most fundamental question you can ask as a part-owner of a business: "For this one share I hold, how much profit did the company actually make?"
The Power of Per-Share Profitability
Why is looking at things on a "per-share" basis so critical? Imagine Company A earns a staggering $10 billion in profit. Sounds incredible, right? But if it has 10 billion shares out in the market, its EPS is just $1.
Now, consider Company B, which earns a more modest $1 billion in profit. If it only has 100 million shares, its EPS is a much beefier $10.
EPS levels the playing field, making it possible to compare the profitability of companies of vastly different sizes in a more meaningful way. It's a simple calculation: a company's net profit divided by its average number of shares. You can find deep dives on this, like how the S&P 500's EPS is calculated, over at GuruFocus.com.
The real power of EPS lies in its ability to tell a story over time. A consistently growing EPS often signals a healthy, efficient, and increasingly valuable company.
What EPS Reveals at a Glance
To wrap your head around why this single number is so foundational, let's break down what it really tells you. The table below gives a quick summary.
| EPS At A Glance |
| :— | :— |
| Concept | What It Means For Investors |
| Profitability Check | It’s a direct measure of how much profit is allocated to each outstanding share of common stock. |
| Valuation Foundation | It’s the "E" in the famous Price-to-Earnings (P/E) ratio, a go-to metric for judging if a stock is cheap or expensive. |
| Growth Signal | A steady, rising EPS over time is a huge green flag, suggesting the company is growing and becoming more efficient. |
| Dividend Potential | Healthy, stable EPS means the company has the financial muscle to pay out dividends to you, the shareholder. |
In short, while EPS isn't the only number you should look at, it’s often the best place to start. It provides the context you need before you dive deeper into a company's story.
How To Calculate Earnings Per Share Step By Step
Knowing what EPS is is one thing. But calculating it yourself? That’s where you build real confidence as an investor. The formula might look simple enough, but each piece tells a crucial story about a company's financial DNA. Let's walk through it.
The basic formula for calculating earnings per share is:
(Net Income – Preferred Dividends) / Weighted Average Shares Outstanding
It's a straightforward flow: you start with the company's total profit, make an important adjustment for a special class of shareholders, and then divide what's left by all the shares out there.
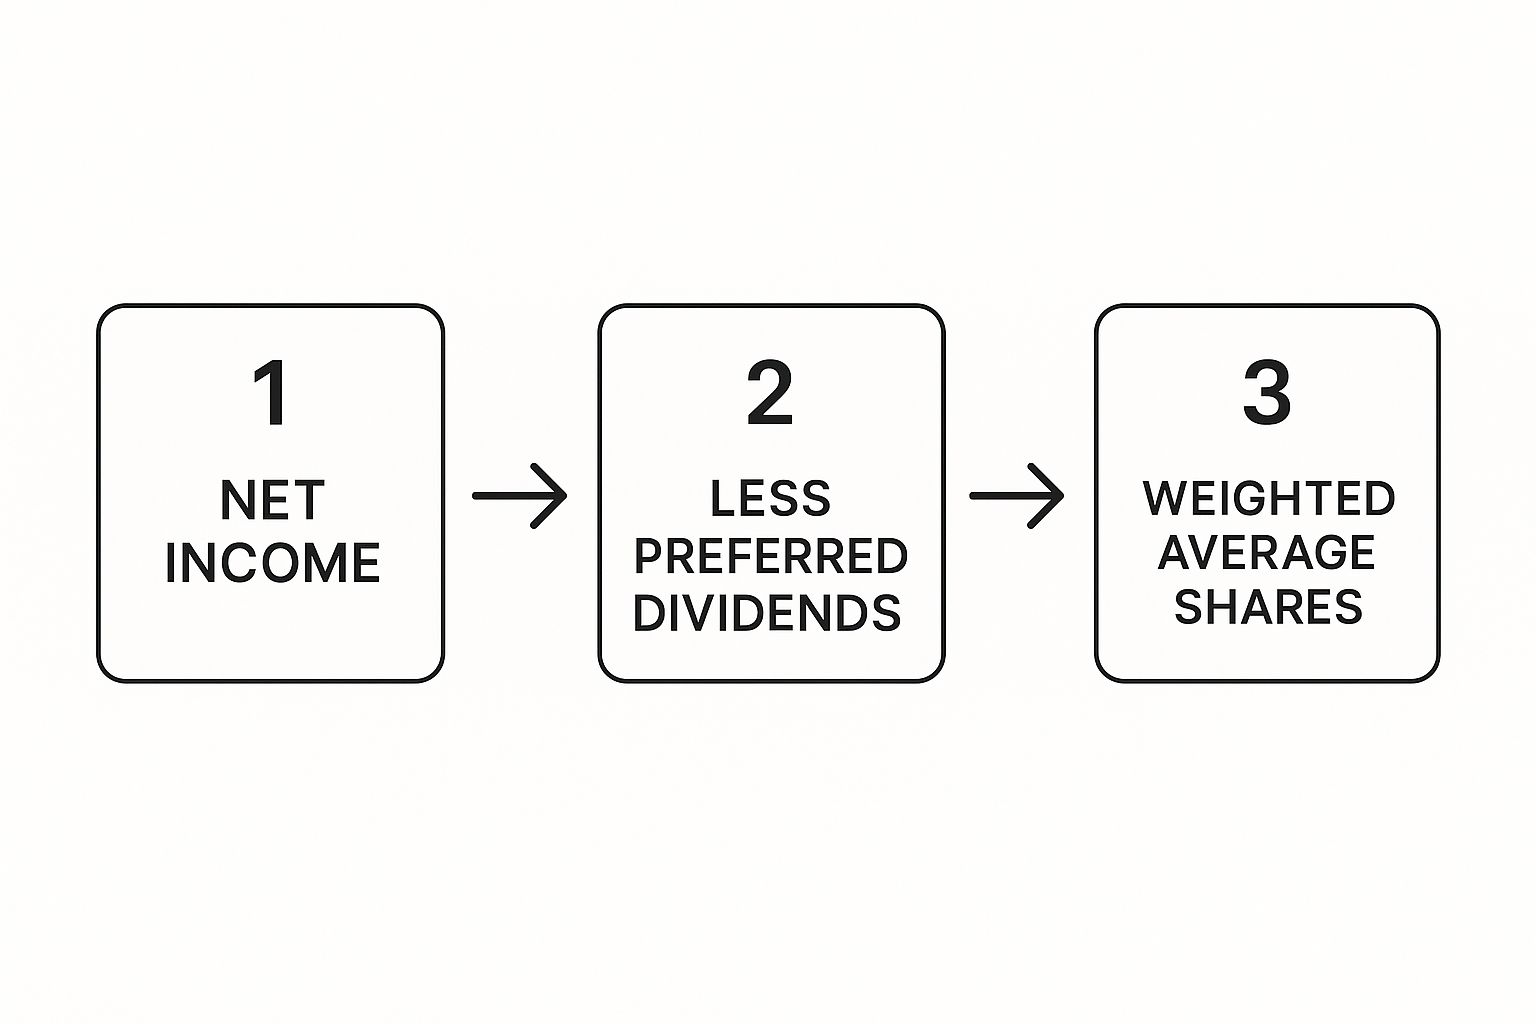
This process helps us get to the number that truly matters for the average investor.
Step 1: Find The Net Income
This is your starting point. Net income is the company's total profit after every single expense, interest payment, and tax bill has been settled. You'll often hear it called the "bottom line," and you can find it right on the company's income statement. It represents the entire pot of earnings available to all shareholders.
Step 2: Subtract Preferred Dividends
So, why this extra step? Because not all shareholders get treated the same. Preferred shareholders hold a special type of stock that basically puts them at the front of the line for payouts.
Think of it like a VIP list at a club. Before the company can share any profits with common shareholders (that’s you and me), it must pay the promised dividends to its preferred shareholders first. By subtracting this amount, we're left with the income that's genuinely available to the rest of us.
Step 3: Divide By Average Shares Outstanding
Finally, we take that adjusted profit and divide it by the number of shares. But here’s a key detail: we don't just grab the number of shares on the last day of the year. Instead, we use the weighted average number of shares outstanding over the entire period.
This is a huge deal. Companies are constantly issuing new shares to raise capital or buying back their own stock, which makes the share count wobble throughout the year. Using a weighted average smooths out these fluctuations and gives a much more honest picture.
For instance, if a company with 1 million shares buys back 200,000 of them exactly halfway through the year, the average would properly account for this change, rather than just using the final, lower count of 800,000 shares. It’s all about accuracy.
When you start digging into a company's financials, you'll quickly realize that "Earnings Per Share" isn't just one number. Think of it like a toolkit—there are a few different versions of EPS, and each one gives you a unique angle on a company's profitability.

It's really important to get a handle on these variations. Each one tells a slightly different story about where a company has been and where it might be headed. Picking the right tool for the job is key, because using the wrong EPS figure can lead you down a completely wrong path.
Publicly traded companies are actually required to report the two most common types, Basic EPS and Diluted EPS, if they have things like stock options that could potentially create more shares down the line.
Basic Vs. Diluted: A Tale Of Two Numbers
Basic EPS is the most straightforward calculation we've been talking about. It’s simply the net income (after paying out any dividends to preferred shareholders) divided by the average number of common shares floating around on the market. It’s a clean look at profitability based on the shares that exist right now.
Diluted EPS, on the other hand, is the more cautious, "what-if" number. It’s designed to show you a potential worst-case scenario for profitability. It answers the question, "What would our earnings per share look like if every single potential share was suddenly created and issued?"
These "potential" shares, which dilute the ownership of existing shareholders, can come from a few places:
- Stock Options: These are often given to employees and give them the right to purchase company stock at a predetermined price.
- Warrants: Similar to options, but these are typically issued to the public or other businesses.
- Convertible Debt: This is a type of bond that the holder can exchange for a set number of common shares.
Because Diluted EPS adds all these potential shares to the total share count, the denominator in our EPS formula gets bigger. This means Diluted EPS will always be a lower number than (or, at best, equal to) Basic EPS. It’s a more conservative and often more realistic picture of a company’s earnings power.
A Comparison Of Key EPS Types
To keep things straight, here's a quick rundown of the main EPS types you'll encounter. Each one serves a different purpose in your analysis.
| EPS Type | What It Measures | When To Use It |
|---|---|---|
| Basic EPS | Current profitability per existing share. | For a simple, unfiltered look at current earnings power. |
| Diluted EPS | "Worst-case" profitability if all potential shares are issued. | To get a more conservative and comprehensive view of earnings. |
| Trailing EPS (TTM) | Actual, historical earnings over the last 12 months. | To analyze proven, past performance. This is based on fact. |
| Forward EPS | Estimated future earnings over the next 12 months. | To gauge market expectations for future growth. This is a forecast. |
This table helps clarify why you can't just grab the first EPS number you see. You have to know what it represents to use it correctly.
Looking Backwards And Forwards
On top of the Basic vs. Diluted split, you'll also see EPS defined by the timeframe it covers. This is all about context—are you looking at a hard fact from the past, or an educated guess about the future?
A huge part of smart investing is comparing what a company has actually done with what the experts think it is going to do. This is where Trailing and Forward EPS come in.
Trailing EPS (TTM) stands for "trailing twelve months." This is a backward-looking number based on the company's real, audited earnings over the last four quarters. It’s historical fact. This gives you a solid, reliable snapshot of how the company has performed recently.
Forward EPS is the forward-looking counterpart. It's not a number from the company's books, but rather an average of earnings predictions made by Wall Street analysts for the next twelve months. While it’s incredibly useful for getting a sense of growth expectations, remember that it's just a forecast. And forecasts can be wrong.
This forward-looking number is a massive piece of the puzzle when valuing a stock, something we dive deeper into in our guide to the Price-to-Earnings ratio.
How Smart Investors Interpret And Use EPS
An EPS number on its own is just a statistic. It's almost meaningless. Its real power comes alive when you put it into context and start making comparisons. Instead of just looking at it as a single, static figure, experienced investors treat it like a dynamic tool for checking a company's health and future potential.
The very first thing to do is check a company's own history.
A company boasting an EPS of $5.00 might sound great at first glance. But what if you discover its EPS was $6.00 last year and $7.00 the year before? Suddenly, that $5.00 figure tells a story of decline. On the flip side, a company with a modest $1.00 EPS that has steadily climbed up from $0.50 over a few years is showing real momentum and solid operational strength.
Benchmarking Against The Competition
After you've looked at the company's internal trends, it's time to look outward. How does it stack up against its direct rivals? This is a crucial step.
For example, if Tech Company A has an EPS of $3.00 and its main competitor, Tech Company B, is only at $1.50, that's a strong signal. It suggests Company A is much more profitable, even though both are operating in the same industry environment.
This kind of analysis is the bedrock of making informed stock trading decisions, helping you spot the market leaders and separate them from the laggards. Just remember, EPS is a key piece of your research, but it's not the only piece. Building a smart portfolio is about more than just chasing high-EPS stocks. You can learn more about this in our guide on how to diversify an investment portfolio.
An isolated EPS figure is a single data point. A series of EPS figures over time becomes a trend. An EPS compared to competitors becomes a benchmark.
Connecting EPS To Stock Valuation
This is where EPS truly proves its worth—it's the foundation for the famous Price-to-Earnings (P/E) ratio.
The P/E ratio is a go-to metric for investors worldwide to gauge if a stock is cheap or expensive. You calculate it by dividing a stock's current price by its earnings per share. In simple terms, it tells you how much investors are willing to pay for every dollar of the company's earnings. A high P/E might mean a stock is overvalued, while a low P/E could signal a potential bargain.
The Limitations And Pitfalls Of Relying On EPS

While EPS is a fantastic starting point, relying on it blindly can be a dangerous trap for investors. A strong headline EPS number can sometimes hide some pretty serious weaknesses in a business. If you don't know what to look for, you can easily be misled by what seems like a great investment on the surface.
One of the most common ways EPS can fool you is through good old-fashioned financial engineering. This is where a company can pump up its EPS without actually growing the core business one bit. The most popular tool for this? Aggressive share buyback programs.
Here's how it works: When a company buys back its own stock, it reduces the total number of shares out there. Since EPS is just profit divided by the number of shares, a smaller denominator automatically inflates the final EPS number—even if the company's net income didn't budge.
Beyond The Headline Number
Another major pitfall is the distortion from one-time events. A company might sell off a big asset or an entire division, leading to a massive, temporary surge in net income for that year. This creates a spectacular, but completely unsustainable, spike in EPS that tells you nothing about the company's real long-term earning power.
An artificially inflated EPS can mask serious issues. Always ask why the EPS is what it is. Is it from genuine business growth, or from financial maneuvering?
Earnings can also get thrown around wildly during big economic shifts. During the 2008 financial crisis, for example, the S&P 500’s total earnings plummeted by roughly 90% in about a year. That's a gut-wrenching swing and shows just how volatile EPS can be. To get a smoother picture, analysts often use other metrics that average out earnings over longer timeframes. You can dig into historical market data like this over at CurrentMarketValuation.com.
This is exactly why looking at EPS in a vacuum is a recipe for disaster. To get a true sense of a company’s health, you have to pair it with other financial statements. For a deeper dive into this, check out our guide on what is cash flow analysis, which gives you another critical piece of the puzzle.
Your Top EPS Questions, Answered
Once you get the hang of EPS, you start seeing it everywhere. But like any metric, the devil is in the details. You start running into weird situations and wonder what it all means. Let's tackle some of the most common questions that pop up for investors.
Can A Company Have A Negative EPS?
Absolutely. If a company spends more money than it brings in during a quarter or year, it ends up with a net loss. When you plug that loss into the EPS formula, you get a negative number, often called loss per share.
For a young startup that's pouring every penny into growth, a negative EPS is pretty normal, even expected. The same goes for a cyclical company hitting a rough patch. But if you see a company posting negative EPS year after year, that’s a massive red flag. It makes you seriously question if their business model is broken or if they can survive long-term.
What Is Considered A Good EPS Number?
This is one of those "it depends" answers, but it's the truth. There's no magic number that's universally "good." A $2.00 EPS might be incredible for a slow-and-steady utility company but downright disappointing for a high-flying tech firm.
The only way to judge an EPS number is with context. You need to look at it from two angles:
- Against its own history: Is the EPS growing over time? A steady upward trend is a fantastic sign of a healthy, well-run business.
- Against its peers: How does its EPS stack up against direct competitors in the same industry? This tells you who's winning the profitability race.
How Do Stock Buybacks Affect EPS?
Stock buybacks can give EPS a serious steroid shot. When a company buys its own shares off the market, it lowers the total number of shares out there.
Since the formula is Earnings ÷ Shares, reducing the number of shares automatically juices up the EPS, even if the company's profits didn't grow an inch.
This isn't necessarily a bad thing; it's a way for companies to return cash to shareholders. But you have to be a little cynical here. Always check if the underlying profits are actually growing, too. Otherwise, a rising EPS might just be financial engineering, not real business growth.
Does A Higher Stock Price Mean A Higher EPS?
Nope, not even a little bit. There's zero direct connection here. A company with a $10 stock price could have a much higher EPS than a company whose stock trades for $200.
Think of it this way: the stock price is just what other investors are willing to pay for a share of the company today. It’s about market sentiment and future expectations. EPS, on the other hand, is a hard number reflecting past profitability. The two are related through the P/E ratio, which tells you how much investors are willing to pay for each dollar of earnings, but the stock price alone tells you nothing about EPS.
Ready to move beyond the numbers and see how this all works in a real portfolio? The Investogy newsletter offers a transparent look at how a real-money portfolio is managed, sharing the "why" behind every decision. Subscribe for free and see the portfolio in action.
Leave a Reply