
If you've spent any time researching stocks, you've probably run into the acronym DCF. It stands for Discounted Cash Flow, and it's one of the most powerful tools professional investors use to figure out what a company is really worth.
Forget the jargon for a second. At its core, DCF is just a structured way of thinking about an investment based on the cold, hard cash it's expected to produce down the road.
So, What Is Discounted Cash Flow, Really?

The whole idea behind DCF is built on one simple, timeless truth: a dollar today is worth more than a dollar tomorrow. This isn't just a saying; it's a fundamental principle of finance called the time value of money.
Why? Because you can invest that dollar today and earn a return on it. A dollar you get next year is a dollar that missed out on twelve months of potential growth.
Think of it like buying a small rental property. You wouldn't value it based on the rent you collected last month. You'd think about all the future rent checks you expect to receive over the next 10, 20, or 30 years. A DCF analysis applies that exact same logic to a business, making it a cornerstone of modern financial analytics.
Turning Future Dollars Into Today's Value
Instead of getting caught up in the daily noise of the stock market, DCF tries to pin down a company's intrinsic value—what it's fundamentally worth based on its ability to generate cash. Getting a solid grip on /blog/what-is-cash-flow-analysis/ is a huge first step to mastering this.
The process boils down to two main jobs:
- Looking into the future: You have to project how much free cash flow the company will generate over a set period, usually the next 5 or 10 years. This is the art part of the science.
- Bringing it back to today: Then, you "discount" those future cash flows back to what they're worth in the present day. This step uses a discount rate to account for risk and the opportunity cost of tying your money up.
The whole point of a DCF is to look past the market's mood swings and focus on a company's long-term, cash-generating engine. It’s an attempt to find a true, objective value.
Once you’ve done the math, you add up all those discounted future cash flows. The final number gives you an estimate of what the entire business is worth right now. It's a foundational technique that helps you separate a company's true value from its often-fickle stock price.
The Three Core Ingredients of a DCF Model
Every single discounted cash flow model, no matter how intimidating it looks on a spreadsheet, boils down to just three core ingredients. Think of it like a recipe for finding a stock's true worth. If you get a handle on each component and see how they fit together, you can start valuing a business with real confidence.
These three pieces are the engine of the whole analysis. Getting them right is what separates a genuinely useful estimate from a number that will lead you astray.
This image lays out how these building blocks stack up to give you a final valuation.
As you can see, it's a logical flow: you forecast the cash, figure out what that cash is worth today, and then account for the company's long-term future. Let's break down each step.
1. Forecasting Free Cash Flow
The first, and arguably most important, ingredient is Free Cash Flow (FCF). Now, this isn't the same as revenue or profit. FCF is the actual, spendable cash a company has left over after paying for everything it needs to run and grow its business—think operating expenses and investments in new buildings or equipment.
It's the pile of cash that could, in theory, be handed back to all its investors.
To kick off a DCF, you have to project this FCF out over a specific timeframe, usually five to ten years. This means rolling up your sleeves, digging into the company's financial statements, and making some educated guesses about future growth, profitability, and how much they'll need to reinvest. Getting a feel for how to improve cash flow can give you a much better sense of whether your projections are realistic.
This forecasting part is where the "art" of valuation really comes into play. A solid analysis is built on reasonable, well-researched assumptions—a core skill you develop in fundamental analysis.
2. Determining the Discount Rate
Okay, so you've got a stream of projected cash flows for the next decade. The problem is, a dollar ten years from now isn't worth a dollar today. That's where the discount rate comes in. It’s a percentage that helps us translate all that future cash into today's value, accounting for both risk and the time value of money.
Think of it as an interest rate, but in reverse. A higher discount rate means future cash is seen as riskier, or that you have better, safer places to put your money right now.
A higher discount rate leads to a lower present value. This is a built-in safety mechanism; it makes sure that riskier companies with less predictable cash flows get a more conservative, lower valuation.
There are a few ways to land on a discount rate, but a very common method is using the Weighted Average Cost of Capital (WACC). This calculation essentially blends the cost of a company's debt with the return that its equity investors demand for taking on the risk of ownership.
3. Calculating the Terminal Value
Forecasting cash flows year by year is great, but you can't do it forever. At some point, usually after that five- or ten-year window, the detailed predictions stop. But of course, a healthy company doesn't just shut its doors in year 11.
To capture the value of all the cash flows the business will generate beyond your forecast period, you calculate a Terminal Value. This is a single, massive number representing the company's worth from that point into perpetuity. Don't underestimate its importance—it often makes up a huge slice of the final valuation, sometimes 70% or even more.
Analysts typically use one of two methods here:
- Perpetuity Growth Model: This assumes the company’s cash flows will grow at a slow and steady rate forever. This rate is usually something conservative, like the long-term rate of economic growth or inflation.
- Exit Multiple Model: This approach assumes the company gets sold at the end of the forecast period. Its value is estimated using a multiple of its earnings or revenue, based on what similar companies in the industry are trading for.
To pull all this together, let's look at the essential data points you'll need for your DCF model.
Key Inputs for DCF Analysis and Their Purpose
| Component | What It Represents | Common Data Sources |
|---|---|---|
| Free Cash Flow (FCF) | The actual cash a company generates after all expenses and investments. | Company 10-K/10-Q reports, investor presentations, analyst estimates. |
| Growth Rate | The assumed annual growth of the company's FCF during the forecast period. | Historical growth, management guidance, industry reports, analyst consensus. |
| Discount Rate (WACC) | The rate used to calculate the present value of future cash flows, reflecting risk. | Calculated using market data for interest rates, beta, and company's capital structure. |
| Terminal Growth Rate | The constant, long-term growth rate of FCF assumed beyond the forecast period. | Often tied to long-term inflation or GDP growth rates (e.g., 2-3%). |
| Exit Multiple | A valuation multiple (e.g., EV/EBITDA) used to calculate terminal value. | Based on comparable public companies or recent M&A transaction data. |
As you can see, each piece of the puzzle requires you to look at real-world data and make some thoughtful assumptions about the future. Once you have these three core ingredients—the cash flow forecast, the discount rate, and the terminal value—you're ready to put them together and calculate the intrinsic value of the business.
Calculating DCF With a Step-by-Step Example
Theory is one thing, but the best way to really get a feel for a discounted cash flow analysis is to roll up your sleeves and build one. Let's walk through a simplified example with a business we can all picture: "Steady Grounds," our make-believe local coffee shop.
This hands-on approach will show you exactly how we translate future potential into a concrete value today. We'll use a straightforward, five-step process to figure out what Steady Grounds is actually worth.
Step 1: Project Future Free Cash Flows
First things first, we need to guess how much free cash flow (FCF) Steady Grounds will generate over the next five years. This isn't just a random guess. After looking at its past performance, considering the local market, and maybe a new condo building going up nearby, we come up with some educated projections:
- Year 1: $50,000
- Year 2: $55,000
- Year 3: $60,000
- Year 4: $64,000
- Year 5: $68,000
This is the cash we believe the business will have left over after paying all its bills and putting money back into the business for things like new espresso machines. This is the raw material for our entire valuation.
Step 2: Determine a Discount Rate
Next up, we need a discount rate. Think of this as a "risk penalty" we apply to future earnings. For a small, established business like a coffee shop, a discount rate of 12% is a pretty reasonable assumption.
Why 12%? It reflects the risks inherent in a small business—local competition, rising coffee bean prices, you name it. It's the kind of return an investor would demand for putting their money into this venture instead of something safer. A shakier, high-risk startup would need a much higher discount rate.
This whole idea of discounting future money is central to finance. For example, understanding how to calculate mortgage payments uses the same core logic to figure out the present value of all those future house payments.
Step 3: Discount Each Year's Cash Flow
Now for the fun part: the math. We're going to take our 12% discount rate and apply it to each year's projected cash flow. The formula to get the Present Value (PV) of each chunk of cash is:
PV = FCF / (1 + r)^n
Where:
- FCF is the Free Cash Flow for that year.
- r is our discount rate (0.12).
- n is the year number (1, 2, 3, etc.).
Let's plug in the numbers for Steady Grounds:
- Year 1: $50,000 / (1.12)^1 = $44,643
- Year 2: $55,000 / (1.12)^2 = $43,848
- Year 3: $60,000 / (1.12)^3 = $42,707
- Year 4: $64,000 / (1.12)^4 = $40,672
- Year 5: $68,000 / (1.12)^5 = $38,586
Add all those up, and the total present value of the first five years of cash flow is $210,456.
Step 4: Calculate the Terminal Value
But wait, Steady Grounds isn't going to shut down after five years, right? We need to account for all the cash it's going to generate forever after our forecast period. This is called the Terminal Value.
We'll use a common formula for this, assuming the coffee shop will grow at a slow and steady 2.5% for the long haul.
The formula is: (FCF Year 5 * (1 + g)) / (r – g)
- ($68,000 * 1.025) / (0.12 – 0.025) = $69,700 / 0.095 = $733,684
That $733,684 represents the value of the business at the end of Year 5. But we need to know what that's worth today. So, we discount it back just like the others:
- $733,684 / (1.12)^5 = $416,334
Step 5: Find the Total Intrinsic Value
We're at the home stretch. Now we just put the two pieces together.
- Sum of Discounted FCF (Years 1-5): $210,456
- Present Value of Terminal Value: $416,334
Total Intrinsic Value of Steady Grounds = $210,456 + $416,334 = $626,790
So, based on our projections and assumptions, our little coffee shop has an intrinsic value of about $627,000. This gives us a solid, fundamentals-based number to work with. If the owner wants to sell for $1 million, we know it's overpriced. If they're asking $500,000, we might have a great deal on our hands. That’s the real power of DCF.
Getting Your Hands Dirty: Applying DCF to a Real Company
Alright, we’ve had our fun with the hypothetical coffee shop. Now it’s time to step into the big leagues. Applying DCF to a real public company—think Microsoft or Coca-Cola—is a whole different ballgame, but the core playbook is exactly the same. The main difference? The sheer amount of data you have to wade through.
Instead of relying on local market knowledge and some back-of-the-napkin math, you'll be diving headfirst into official financial filings. Specifically, you're going to get very familiar with 10-K and 10-Q reports. These are the documents public companies are required to file with the U.S. Securities and Exchange Commission, and they're the bedrock of any serious analysis. This is where you find the hard numbers—revenue, operating margins, capital expenditures, and debt—that you'll need to start projecting future cash flow.
Sourcing Your Data from Public Filings
Your first challenge is playing detective. You need to translate dense, jargon-filled financial statements into the clean inputs your model needs. It feels a bit like piecing together clues to build a complete picture of a company's financial health and, more importantly, its future potential.
Here's where you'll be digging in those reports:
- The Income Statement: This is ground zero for revenue, operating income, and net income. These figures are the starting point for forecasting what the company will earn.
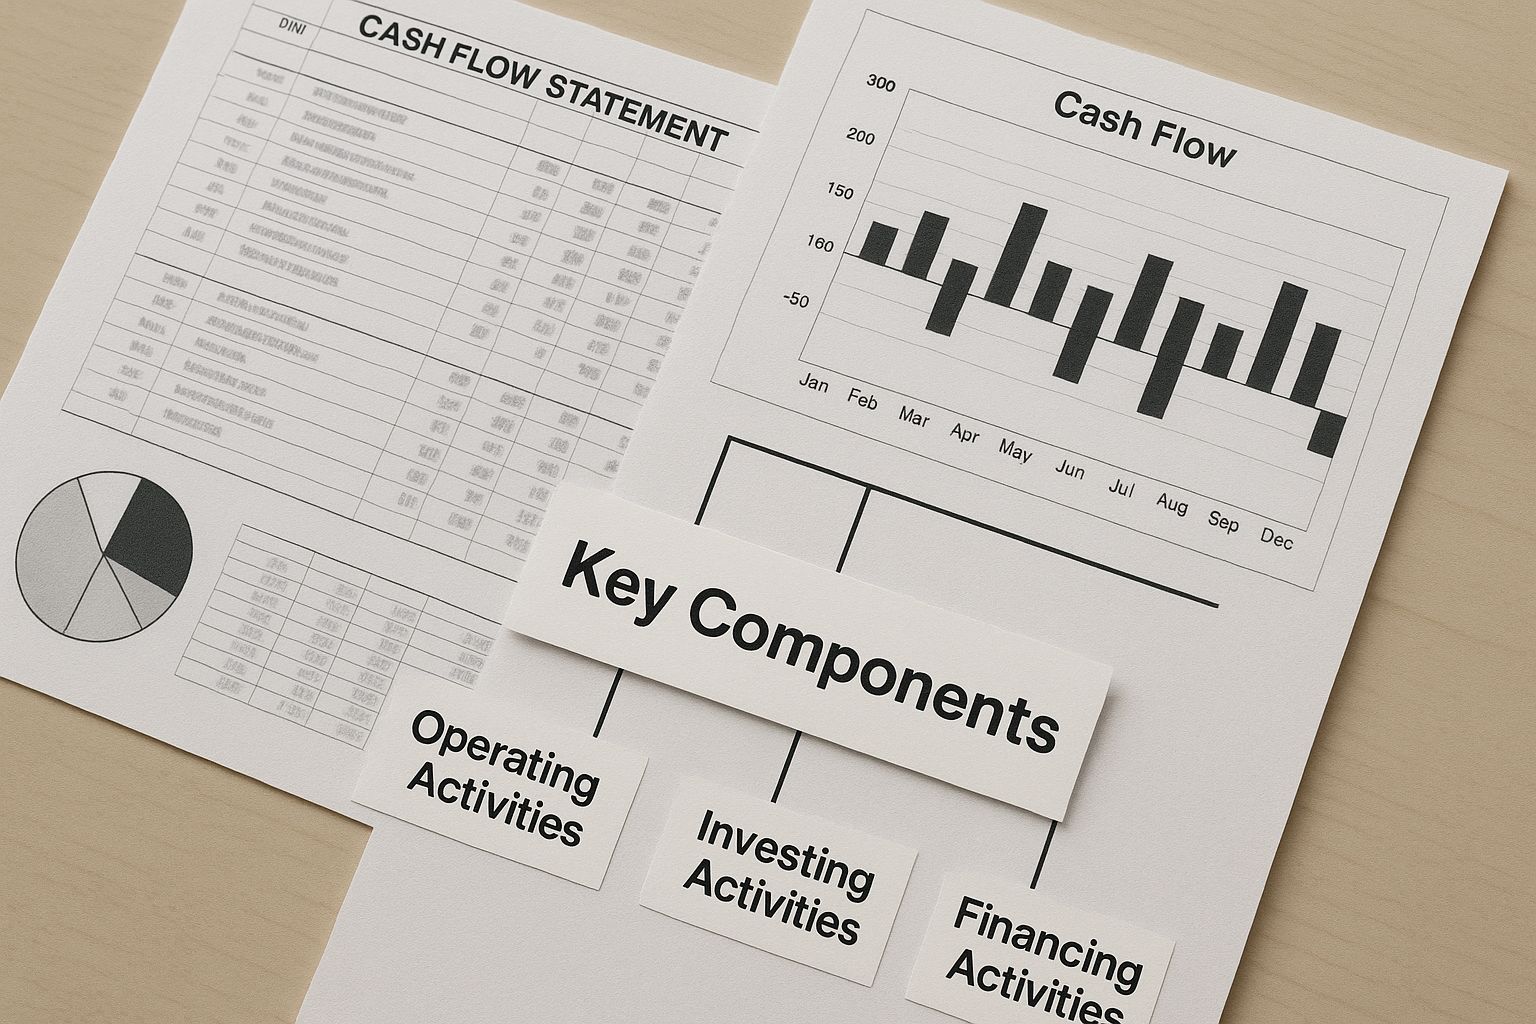
- The Cash Flow Statement: This is the most critical piece of the puzzle. It strips away accounting fluff and shows you the actual cash the company generated and spent, including the all-important capital expenditures (CapEx), a key ingredient for FCF.
- The Balance Sheet: This statement gives you a snapshot of the company’s debt and equity, which you'll need to figure out your discount rate.
But remember, this isn’t just a numbers game. It's about understanding the story behind the numbers. Why are profit margins shrinking? Is the company pouring cash into new factories? Answering these questions is what separates a mechanical exercise from true, insightful investment analysis.
The Art of Making Defensible Assumptions
Once you’ve gathered the historical data, the real work begins. Valuing a public company forces you to confront the single biggest challenge in any DCF analysis: making reasonable, defensible assumptions about the future.
This is where so many investors trip up. It's easy to get excited about a company and plug in overly optimistic growth rates, which naturally leads to a wildly inflated valuation. A professional analyst, on the other hand, will spend hours—sometimes days—justifying every single assumption. For a publicly traded company, it's common practice to project cash flows for a full ten years before calculating a terminal value. You can discover more insights about building a professional DCF model and see why the weighted average cost of capital (WACC) is almost always used as the discount rate.
A DCF model is only as good as its inputs. The goal isn't to be perfectly right—which is impossible—but to be thoughtfully conservative and understand how sensitive your valuation is to your assumptions.
This process is all about asking the tough questions:
- Can this company realistically keep growing at its historical rate for another decade?
- What industry headwinds or tailwinds could derail (or boost) future profits?
- How much will the company need to reinvest back into the business just to sustain its growth?
From Valuation to an Investment Decision
The final step is where the rubber meets the road. You connect all your detailed analysis to a clear, actionable investment decision. After projecting and discounting all those future cash flows, you'll arrive at the company’s total intrinsic value. From there, you just divide that massive number by the total number of shares outstanding to get an intrinsic value per share.
This is your moment of truth. You finally have a number you can compare to the current stock price you see on the screen.
- If your intrinsic value is significantly higher than the market price, you may have found an undervalued stock.
- If your intrinsic value is significantly lower, the stock might be overvalued.
- If the numbers are pretty close, the stock is likely fairly priced.
This final comparison is the entire point of doing a DCF. It gives you a logical, fundamentals-based reason to buy, sell, or avoid a stock. It’s what transforms you from a passive speculator into an informed investor.
The Strengths and Weaknesses of DCF Valuation
No valuation tool is a crystal ball, and a discounted cash flow analysis is certainly no exception. While it's a cornerstone of serious investing, its power comes with some significant limitations. Knowing both sides of the coin is key to understanding when to trust a DCF model and when to take it with a huge grain of salt.
The biggest plus for DCF is its laser focus on intrinsic value. It forces you to completely ignore the market's daily mood swings and concentrate on what really matters: the underlying cash-generating ability of the business itself. This disciplined approach anchors your investment thesis in fundamentals, not fleeting sentiment.
It's also incredibly flexible. You can model out all sorts of scenarios—a best-case, worst-case, and a more realistic middle ground—to see the full range of potential valuations. This gives you a much better feel for how sensitive your investment is to different assumptions about growth or profitability down the road.
The Garbage In, Garbage Out Problem
For all its strengths, DCF has a famous and critical weakness, often summed up as "Garbage In, Garbage Out." The reality is, a DCF model is only as good as the assumptions you feed it. Even tiny tweaks to your growth rate or discount rate can dramatically swing the final valuation.
This extreme sensitivity is the method's Achilles' heel. An analyst who's a little too bullish on a company's future can easily cook up a DCF that justifies a high stock price, creating a dangerous illusion of precision.
A DCF model gives you an answer that looks precise, but is actually very uncertain. Its value isn't in the final number, but in forcing you to think critically about the key drivers that will determine a company's future.
Let's be honest, accurately forecasting the future is tough. For a stable, predictable company like a utility, projections might be fairly reliable. But for a high-growth tech startup or a business in a volatile industry, trying to forecast cash flows ten years out is more art than science.
Strengths vs. Weaknesses of DCF Analysis
So, where does that leave us? While DCF is a powerful framework for thinking about a business, it should never be the only tool you use. It works best when you combine it with other stock valuation methods to get a more complete picture. Think of it as one expert opinion in a room full of advisors.
Here’s a side-by-side look at the key trade-offs to keep in mind.
| Advantages of DCF | Disadvantages of DCF |
|---|---|
| Focuses on Fundamentals: Based on a company's actual ability to generate cash, making it independent of market hype. | Highly Sensitive to Assumptions: Small changes in inputs (growth rate, discount rate) can lead to vastly different valuations. |
| Provides an Intrinsic Value: Aims to calculate what a business is truly worth, not just its current market price. | "Garbage In, Garbage Out": The model's accuracy is entirely dependent on the quality and realism of your forecasts. |
| Forces Disciplined Analysis: Requires a deep dive into a company's economics, strategy, and competitive landscape. | Difficult for Unpredictable Companies: Less reliable for startups, cyclical businesses, or high-growth tech firms with uncertain futures. |
| Flexible for Scenario Planning: Easily allows you to model different outcomes (best, worst, base case) to understand risk. | Terminal Value Dominance: A highly speculative estimate, the terminal value can account for over 70% of the total value. |
At the end of the day, a DCF valuation is a powerful exercise in critical thinking. It forces you to justify every single assumption you make about a company's future. This process alone provides a robust, logical foundation for your investment decisions—as long as you never forget its inherent limitations.
How a 19th-Century Idea Shapes Modern Finance
You might think Discounted Cash Flow is some complex model dreamed up on a modern Wall Street trading floor, but its roots go way deeper than that. The basic idea—valuing something based on the money it’ll spit out in the future—is a classic principle born from pure necessity.
Long before anyone had a spreadsheet, people were using this logic to solve very real valuation problems. The concept first popped up in the UK coal industry way back in 1801. Miners needed a way to figure out if a new mine was worth the effort, so they started projecting its future output and discounting it back. You can dig into the specifics by checking out the history of discounted cash flow analysis.
From Crisis to Core Principle
But DCF really came into its own after the stock market crash of 1929. With the financial world in ruins, investors were desperate for a disciplined, objective way to value companies. They needed something more solid than just speculation and market hype. The crash forced a huge shift toward rigorous, fundamentals-based thinking.
Discounted cash flow emerged from this need for a logical anchor. It provided a framework for separating a company's durable, cash-generating power from its volatile stock price.
Knowing this history shows you that DCF is much more than a formula. It's a powerful idea born from the simple need to bring some sanity and logic to investing—a principle that’s just as critical today as it was back then.
Common Questions About DCF Analysis
Once you start using the discounted cash flow model, a few practical questions almost always bubble up. Getting these sorted out will help you use the tool a lot more effectively and sidestep some of the most common traps. Let's get right to it.
Is DCF a Reliable Way to Value Any Company?
DCF analysis absolutely shines when you’re looking at stable, predictable companies. Think of businesses with a long, consistent history of churning out cash, like a big utility company or a household consumer brand. But its reliability takes a nosedive when the future is anyone's guess.
It’s far less useful for:
- Startups that have no real history of revenue or cash flow.
- High-growth tech companies where future success is purely speculative.
- Cyclical businesses (like mining or construction) whose cash flows swing wildly with the economic cycle.
For these kinds of companies, trying to forecast cash flow is more like gazing into a crystal ball than performing a real analysis. That makes the final DCF number pretty shaky.
What Is the Biggest Mistake in a DCF Analysis?
The single biggest mistake you can make is plugging in overly optimistic assumptions, especially for the long-term growth rate. A DCF model is incredibly sensitive to its inputs, and even a slightly rosy projection can blow up the final valuation, giving you a false sense of security.
The most common error isn’t a math mistake; it’s a judgment mistake. Always ground your assumptions in conservative, well-researched data, and run a sensitivity analysis to see how different inputs change the final number.
Can I Use DCF If a Company Does Not Pay Dividends?
Absolutely. In fact, this is one of the model's key strengths. DCF doesn't care about dividends; it focuses on Free Cash Flow—the actual cash the business generates—not the slice of it that management decides to hand out to shareholders.
This makes it the perfect tool for valuing companies that reinvest every penny they earn back into the business to chase future growth.
Ready to build your investing conviction with real-world examples? The Investogy newsletter offers a free 3-minute weekly read, showing you exactly how we manage and analyze stocks in our transparent, real-money portfolio. Subscribe for free at https://investogy.com.
Leave a Reply