
Let's be honest, the world of investing is filled with jargon. Book Value Per Share (BVPS) is one of those terms that gets thrown around a lot, but what does it actually mean for you and your portfolio?
Think of it this way: if a company had to close up shop tomorrow, sell every last asset, and pay back every single penny it owed, BVPS is what would be left over for each person holding a common share. It’s the liquidation value, on a per-share basis, straight from the company's official books.
What Is Book Value Per Share Explained Simply

Let’s use a simple analogy. Imagine you own a small coffee shop. The value of everything in that shop—the espresso machine, the bags of beans, the furniture, and the cash in the register—adds up to $150,000. These are your assets.
Now, you also have some debts. Let's say you owe $50,000 in loans for the equipment and outstanding invoices to your suppliers. These are your liabilities.
If you subtract what you owe from what you own ($150,000 – $50,000), you're left with $100,000. That's your shop's "book value," or its equity. It’s the on-paper, tangible worth of your business.
Book Value Per Share just scales this idea up to a massive, publicly-traded company and boils it down to a single share. It’s a foundational metric for investors trying to figure out a company's real value, away from all the market noise and daily price swings.
The Foundation Of BVPS
At its core, BVPS gives you a valuation baseline. It answers a simple but powerful question: "What is the net asset value backing each share I own?" This is a world away from the stock's market price, which is just what other investors are willing to pay based on feelings, future hopes, and the mood of the market.
To get the BVPS, you look at the company’s balance sheet. The formula is pretty straightforward: you take the total shareholders' equity, subtract any preferred equity, and then divide that number by the total number of common shares out there.
For instance, say a company has $10 million in total equity, $1 million of which is preferred stock, and there are 3 million common shares. The book value per share would be $3.00 ($9 million ÷ 3 million shares). You can find more practical examples of how investors use BVPS over on SoFi.com.
Key Takeaway: Book Value Per Share is a no-nonsense accounting metric. It represents a company's net asset value on a per-share basis, giving investors a tangible anchor point for assessing a stock's underlying worth.
This metric is a go-to tool for a couple of key investor types:
- Value Investors: These are the bargain hunters of the stock market. They actively search for companies trading at or even below their book value, seeing it as a sign that the stock might be undervalued.
- Financial Health Analysts: A steadily increasing BVPS over the years is a great sign. It often indicates that a company is successfully growing its net asset base, which is another way of saying it's creating real, tangible value for its shareholders.
For a quick summary, this table breaks down the core components of BVPS and what they signal to an investor.
Key BVPS Components at a Glance
| Component | What It Means for Investors |
|---|---|
| Shareholders' Equity | This is the company's total assets minus its total liabilities—the net worth on the books. A higher number is generally better. |
| Preferred Equity | This portion of equity belongs to preferred shareholders and must be subtracted to find the value available to common stockholders. |
| Outstanding Shares | The total number of a company's common shares held by all its shareholders. This is the number we divide by to get the per-share value. |
Ultimately, understanding these pieces helps you see BVPS not just as a number, but as a story about the company's financial stability and its ability to build wealth from the ground up.
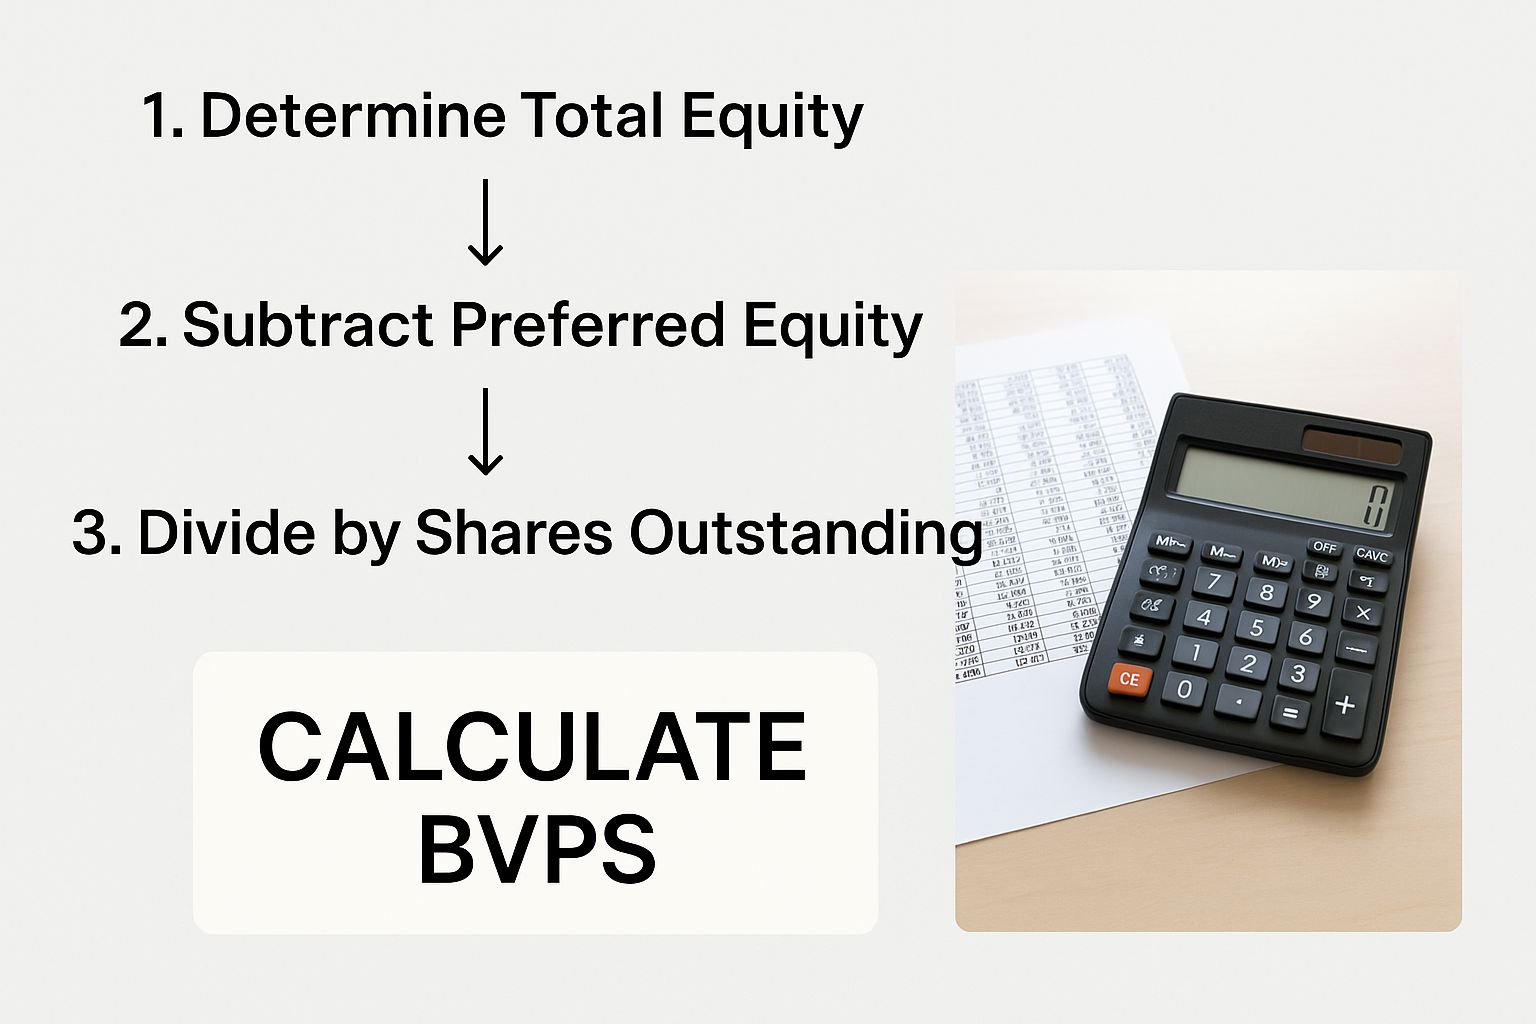
How to Calculate Book Value Per Share Step by Step
Alright, let's get into the nuts and bolts. Calculating a company's Book Value Per Share (BVPS) might sound like something reserved for Wall Street analysts, but it’s actually something you can absolutely do yourself. You don't need a fancy finance degree—just a company's financial reports and one simple formula.
At its core, the formula is this:
(Shareholders' Equity – Preferred Equity) / Common Shares Outstanding = Book Value Per Share
We'll walk through exactly where to find each of these numbers and what they mean. Think of it as a treasure map leading you to the real value behind each share of a company.
As you can see, it’s a clear, methodical process. You just need to grab a few key figures and plug them in.
Step 1: Find Total Shareholders Equity
Your first stop is the company’s balance sheet. This document is a snapshot of everything a company owns (its assets) and everything it owes (its liabilities). Shareholders' Equity is simply the difference between the two, and it’s always listed right there on the balance sheet.
Think of it as the company's net worth on paper, according to its accounting books. If you’re not totally comfortable digging through these reports yet, our guide on how to read company financial statements is a great place to build up your confidence.
Step 2: Subtract Preferred Equity
Next up, we need to make an important adjustment. In the corporate food chain, preferred shareholders have a higher claim on the company's assets than common shareholders like us. So, to figure out what’s really left for the common stockholders, we have to subtract the value of any Preferred Equity.
This is a crucial step to get an accurate picture. The number you're left with is sometimes called the "Book Value of Common Equity." If the company doesn't have any preferred stock issued, you can just skip this step entirely.
Step 3: Divide by Common Shares Outstanding
The last piece of the puzzle is to bring this total value down to a per-share basis. You'll need to find the total number of Common Shares Outstanding. This figure is also in the company’s financial reports, usually tucked away in the notes section or sometimes listed directly on the balance sheet.
Once you have that, just divide the Book Value of Common Equity by the share count, and—voilà—you’ve got your Book Value Per Share.
Let's run through an example:
Imagine a company we'll call "Innovate Corp." It reports $500 million in Shareholders' Equity and has $50 million in Preferred Equity. It also has 100 million common shares floating around.
- First, we find the equity available to common shareholders: $500M – $50M = $450M
- Then, we divide that by the number of shares: $450M / 100M shares = $4.50
In this scenario, Innovate Corp's Book Value Per Share is $4.50. Easy as that.
What BVPS Actually Tells You About a Stock

So, you've calculated a company's Book Value Per Share. That's a great starting point, but the number itself doesn't tell you much on its own. A BVPS of $20 is pretty meaningless in a vacuum. The real magic happens when you hold that number up against the stock's current market price—what investors are actually paying for it right now.
This comparison is the whole idea behind the Price-to-Book (P/B) ratio, a classic tool in any value investor's toolkit. Think of BVPS as the Kelly Blue Book value for a used car, based strictly on its make, model, and mileage. The market price is what a buyer is actually willing to pay for it on the lot, which could be way higher or lower depending on its reputation, cool features, or even just the color.
Reading the Signals: A Stock Above or Below Book Value
When you compare these two prices—the "sticker price" from the books and what the market is willing to pay—you start to uncover the story the market is telling about that company.
A stock’s market price can be:
- Lower than its BVPS: For a value investor, this is often a flashing light. It hints that the stock might be undervalued because you could theoretically buy the company's assets for less than they're worth on paper. But it can also be a red flag. It might mean investors have lost faith and don't believe those assets will generate decent profits down the road.
- Higher than its BVPS: This is far more common, especially with successful, growing companies. It shows that investors believe the company can crank out future earnings that go way beyond the value of its current assets. This premium you're paying is for things you can't see on the balance sheet, like brand power, brilliant management, and massive growth potential. Our guide on what is intrinsic value digs deeper into how you can start to size up that future potential.
Key Insight: The gap between book value and market price is really just a measure of investor expectation. A huge gap often means the market has sky-high hopes for growth. A tiny gap, or a stock trading below book, signals a whole lot of doubt.
Why Context Is Everything
You can't just apply this logic blindly, because the meaning of BVPS changes wildly from one industry to the next.
Capital-heavy businesses, like big manufacturers or banks, are packed with physical assets, so they naturally have high BVPS figures. A giant like ExxonMobil, for instance, might have a BVPS somewhere around $47.60.
On the flip side, a tech powerhouse like Apple, whose real value is tied up in its iconic brand and intellectual property, might have a BVPS around $5 or $6. This is true even when its stock is trading for over $150 a share.
At the end of the day, BVPS isn't a simple "buy" or "sell" signal. Think of it as a solid, tangible anchor for your valuation. By comparing it to the market price and, just as importantly, considering the industry it operates in, you can get a much richer, more nuanced understanding of a stock's true worth and its potential.
Like any tool in an investor's toolkit, Book Value Per Share (BVPS) has its moments to shine and other times when it can be flat-out misleading.
Figuring out this dual nature is the key to using the metric wisely. No single number ever tells the whole story, and BVPS is certainly no exception. Its real power comes from knowing exactly when to lean on it and when to look for other clues.
Where BVPS Shines
A huge plus for BVPS is its stability. Think about it: a stock's market price can swing like a pendulum on any given day based on news, rumors, or just the market's mood. Book value, on the other hand, is anchored to the company's balance sheet.
This makes it a much calmer, more grounded reference point for a company’s underlying worth. It's updated quarterly, not second-by-second.
Because of this, BVPS is a cornerstone of value investing. It’s how investors find their "margin of safety," hunting for stocks trading near or even below their book value. The idea is to build in a buffer against all that market craziness.
The Major Blind Spot: Intangible Assets
But here’s the biggest knock against BVPS: it’s kind of stuck in the past. The metric was designed for an industrial age of factories, machinery, and physical inventory. That's not the world we live in anymore. Today, many of the world's most valuable companies build their empires on assets you can't touch or easily count.
The core limitation of book value is that it often fails to capture the immense worth of intangible assets. A company's brand reputation, its patented technology, or its brilliant software code might be its most powerful drivers of profit, yet they have little to no value on the balance sheet.
This creates a serious disconnect. For a hot tech company or a powerful consumer brand, the BVPS can be almost comically low compared to its market value. If you only looked at BVPS, you'd think the company was ridiculously overvalued, when in reality its true strength lies in those invisible assets.
Other Important Limitations to Keep in Mind
Beyond its struggle with intangible assets, a few other accounting quirks can throw off the accuracy of BVPS. It's crucial to know about these potential traps before you start drawing any firm conclusions.
- Historical Cost Accounting: Assets get recorded on the balance sheet at whatever the company originally paid for them. A piece of prime real estate bought for $1 million twenty years ago might be worth $10 million today, but its book value doesn't reflect any of that appreciation.
- Depreciation's Impact: Accounting rules force companies to depreciate tangible assets over time. This systematically lowers an asset's book value on paper, even if the asset is still chugging along just fine and holding its real-world value.
- Industry Relevance Varies Wildly: BVPS is super relevant when you're looking at banks, insurance companies, or industrial manufacturers—businesses whose assets are mostly tangible. For software, biotech, or service-based companies? Not so much.
At the end of the day, BVPS offers a conservative, tangible floor for a company's valuation. It’s a fantastic starting point for your research, but it absolutely must be paired with other metrics to get the full picture of a company’s financial health and future potential.
Relying on it in isolation is like trying to judge a car's performance by only looking at its weight. It's a piece of the puzzle, but it's not the whole puzzle.
When to Trust BVPS and When to Be Cautious
So, how do you know when BVPS is a reliable guide versus a potential trap? This table breaks down its core strengths and weaknesses to help you decide when to put it to work in your analysis.
| Strengths of BVPS | Weaknesses of BVPS |
|---|---|
| Provides a Stable Baseline: Anchored to the balance sheet, not volatile market sentiment. | Ignores Intangible Assets: Fails to value brands, patents, and intellectual property. |
| Excellent for Value Investing: Helps identify potentially undervalued stocks with a margin of safety. | Uses Outdated Asset Values: Historical cost accounting doesn't reflect current market prices. |
| Offers a Conservative "Floor": Represents a company's tangible, liquidation value. | Can Be Misleading for Modern Industries: Less relevant for tech, software, and service companies. |
| Simple and Easy to Calculate: The data is readily available in quarterly financial reports. | Depreciation Skews the Numbers: Accounting rules can artificially reduce asset values. |
Understanding both sides of this equation is what separates a novice from an experienced investor. It helps you use BVPS as the sharp, effective tool it can be, rather than a blunt instrument that leads you astray.
BVPS in the Real World: Comparing Different Industries
Theory is one thing, but seeing Book Value Per Share in action is where it really clicks. You quickly learn that BVPS isn't a one-size-fits-all metric. Its usefulness can swing wildly depending on what kind of business you're looking at.
Let’s take two completely different companies: a classic, old-school industrial manufacturer and a modern software company.
For the manufacturer, BVPS is often a rock-solid, incredibly relevant number. Think about it—this kind of company is all about tangible, physical stuff. We're talking factories, heavy machinery, and warehouses full of inventory. All these assets are neatly tallied up on the balance sheet, creating a substantial and meaningful book value.
In this world, BVPS can act as a realistic floor for the company's stock price. If the market price starts flirting with the book value per share, value investors' ears perk up. It could be a screaming buy signal, suggesting the market is overlooking a massive base of hard assets.
The Software Company Conundrum
Now, let's flip the script and look at a software company. Here, the story is turned completely on its head.
The most valuable assets this company owns aren't things you can touch. They're intangible—proprietary code, powerful brand recognition, patents, and the viral network effect of millions of users. These are the real engines of growth and profit.
But here’s the problem: under traditional accounting rules, these incredibly valuable assets barely show up on the balance sheet, if at all. This means the software company's BVPS is often ridiculously low compared to its stock price. An investor who only looks at this metric would probably dismiss the stock as absurdly overvalued and move on.
The Key Takeaway: BVPS is a superstar when it comes to valuing companies loaded with tangible assets. But it really struggles to capture the true worth of businesses built on intellectual property and brand loyalty. That huge gap you often see between market price and book value? That's the market putting a price tag on all those "invisible" assets.
Why This Comparison Matters for Investors
This contrast gets to the heart of why context is everything in investing. A low Price-to-Book ratio might lead you straight to an undervalued manufacturer, but it could also make you completely miss out on the next big thing in tech.
Learning to spot which industries are "book value friendly" is a massive advantage for anyone figuring out how to identify undervalued stocks.
History backs this up. Just look at what happened during the 2008 financial crisis. Banks, which are heavy on tangible assets (loans, securities), saw their BVPS get crushed as those assets were written down. Citigroup, for example, saw its BVPS crater from around $40 to under $10 as its capital base vanished. That number was a direct reflection of its deteriorating financial health. It shows just how powerful BVPS can be as a gauge of stability—in the right sectors.
Common Questions About Book Value Per Share
As you start to get the hang of using book value per share, a few questions always seem to pop up. Think of it as leveling up—you've got the basics down, and now you're running into the trickier real-world scenarios.
Let's walk through a few of the most common ones. Getting these sorted will help you analyze companies with a lot more confidence.
Can a Company Have a Negative Book Value Per Share?
Absolutely, and it's almost always a massive red flag. A company lands in negative BVPS territory when its total liabilities balloon past its total assets.
Put simply, this means that even if the company liquidated everything—sold off every desk, computer, and factory—it still wouldn't have enough cash to pay back its debts. The common shareholders would be left with nothing.
This is often the sign of a business in serious financial distress, usually after years of losing money have completely eroded its equity. While there are rare turnaround stories, a negative book value per share is typically screaming "high-risk investment."
Is a Low Price-to-Book Ratio Always a Good Sign?
Not necessarily. A Price-to-Book (P/B) ratio under 1.0 is the classic signal of a potentially undervalued stock, but it can just as easily be a "value trap." The market isn't dumb; sometimes a stock is cheap for a very good reason.
Think about it: that low price could be reflecting some deep, underlying problems. Maybe profits are in a free fall, the entire industry is facing headwinds, or the management team is making poor decisions. A real bargain is usually a company with a low P/B ratio and other signs of health, like steady earnings or a solid competitive moat.
The key is to ask why the P/B ratio is so low.
A low P/B ratio isn't an automatic buy signal; it's a signal to start digging deeper. It tells you where to look for potential opportunities, but the real work is figuring out if you've found a hidden gem or a falling knife.
What Is the Difference Between BVPS and Tangible BVPS?
This is a great question because it gets into a more refined way of looking at a company's assets. Tangible Book Value Per Share (TBVPS) is a stricter, more conservative version of the standard calculation.
It takes the formula a step further by stripping out all intangible assets before doing the division. We're talking about things like goodwill, patents, trademarks, and brand recognition—assets that are often subjective and tricky to value accurately.
By focusing only on a company's physical, touchable assets, TBVPS gives you a "harder" number. It's especially useful when you're looking at banks or heavy industrial companies, where the value of physical assets is paramount. It’s a way of asking, "In a true worst-case liquidation, what could we really sell off?"
Ready to move beyond theory and see how these concepts apply to a real-world portfolio? The Investogy newsletter offers a transparent look at how our team manages a real-money portfolio, explaining the "why" behind every decision. Subscribe for free at Investogy to start building your conviction.
Leave a Reply