
If you’ve spent any time at all around the stock market, you’ve probably heard people throw around the term "beta." It’s one of those fundamental ideas in investing, and understanding it is key to making smarter decisions.
So, what is it? In simple terms, beta is a number that tells you how volatile a stock is compared to the overall market. Think of the market as the ocean on an average day. Some boats (stocks) will rock gently with the waves, while others will lurch dramatically. Beta is the measure of how much a particular boat tends to rock.
What Is Beta and Why Does It Matter?

At its core, beta is a risk metric. It quantifies how a stock's price moves in relation to a benchmark index, which is usually the S&P 500 for the U.S. market. By getting a handle on a stock's beta, you can get a pretty good idea of how it might react when the entire market goes on a bull run or hits a rough patch.
This single number gives you a quick snapshot of a stock’s personality. Is it a high-flying growth stock that rides market waves for all they're worth? Or is it a steady, defensive player that stays relatively calm when things get chaotic? The answer is right there in its beta.
The Three Core Beta Scenarios
Interpreting beta is actually pretty simple once you know the magic number: 1.0. Everything revolves around it.
- Beta Greater Than 1.0: This means the stock is more volatile than the market. A stock with a beta of 1.5, for example, is expected to move 50% more than the market. If the S&P 500 climbs 10%, you might see this stock jump 15%. Of course, the same is true on the way down.
- Beta Equal to 1.0: The stock's price tends to move right in line with the market. It essentially mirrors the market's ups and downs with the same intensity. Think of a big S&P 500 ETF—its beta will be very close to 1.0.
- Beta Less Than 1.0: This stock is less volatile than the overall market. A company with a beta of 0.7 would be expected to move 30% less than the market. Big, stable utility companies or consumer staples often fall into this camp.
Understanding a stock's beta is crucial because it helps you align your investments with your personal risk tolerance. It’s a key piece of data, much like when you learn about what is market capitalization to gauge a company's size.
Quick Guide to Interpreting Beta Values
To make it even clearer, here’s a simple table breaking down what these beta values really mean for you and your portfolio.
| Beta Value | Volatility vs. Market | What It Means for Investors |
|---|---|---|
| > 1.0 | Higher Volatility | Higher risk, but also the potential for higher returns. Often favored by aggressive, growth-focused investors. |
| = 1.0 | Same Volatility | Moves in lockstep with the market. Perfect for investors who want market-like risk and return. |
| < 1.0 | Lower Volatility | Lower risk and, generally, more modest returns. A great way to add stability to a portfolio, especially during downturns. |
Think of beta as a tool in your investor toolkit. It helps you build a portfolio that doesn’t just chase returns but also lets you sleep at night, no matter what the market is doing.
How Stock Beta Is Actually Calculated
Knowing what beta means is one thing, but understanding where the number actually comes from gives you a whole other level of confidence in your analysis. This isn't just some arbitrary figure plucked from thin air; it’s the result of a solid statistical process designed to measure a stock's relationship with the broader market.
At its heart, the calculation is a classic case of quantitative analysis in finance, where we use math to make sense of market risk. The main tool for the job is regression analysis. This sounds complex, but the idea is simple: you compare a stock's historical price movements to the movements of a market index, like the S&P 500, over the same period.
The whole point is to find the "line of best fit" that describes how the two move together. The slope of that line is the stock's beta. A steep slope (greater than 1) means the stock tends to be more volatile than the market. A flatter slope (less than 1) tells you the stock is less sensitive to the market's ups and downs.
This infographic neatly sums up the steps.
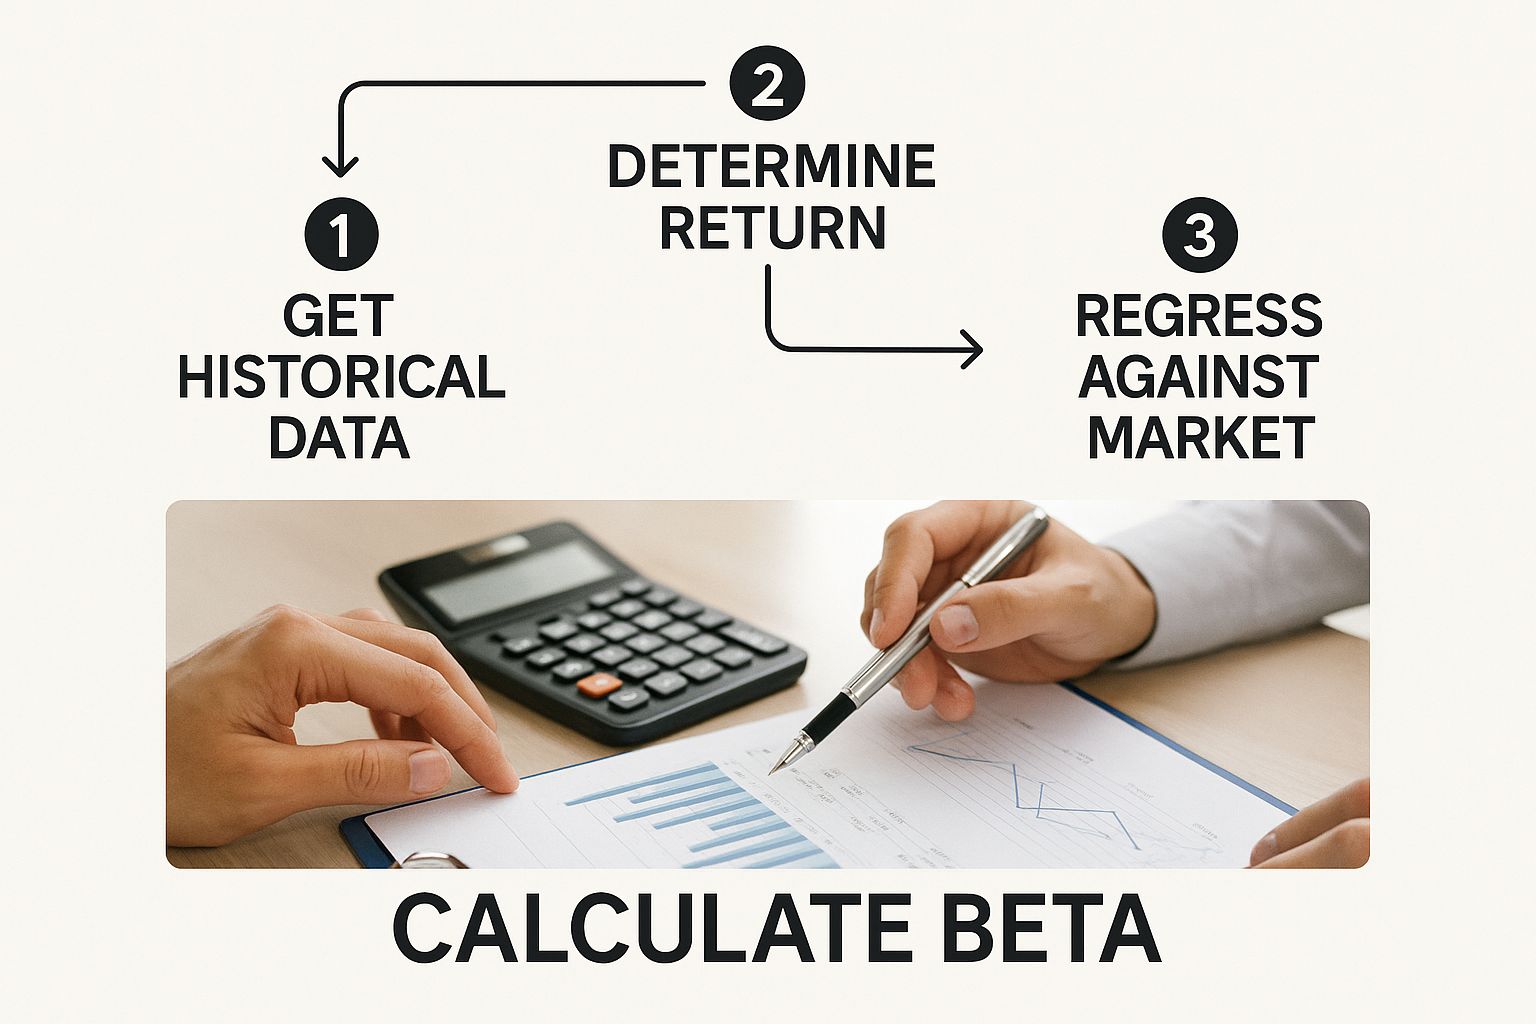
As you can see, it’s a systematic way of turning a pile of historical data into a practical, forward-looking risk metric.
Standard Industry Practices
To keep everyone on the same page, financial data providers generally stick to a standard formula. The common practice is to look at five years of monthly returns for both the stock and the chosen index. Using a five-year window helps smooth out any short-term market weirdness and gives a more stable, reliable picture of the relationship.
But here’s the thing: a beta calculated purely from past data isn't always the best predictor of the future. And that’s where a pretty smart adjustment comes into play.
The Blume Adjustment for a More Realistic Beta
Over the years, statisticians noticed something interesting. Extreme betas—both the really high and the really low ones—tend to drift back toward the market average of 1.0 over time. It’s a classic example of "regression to the mean." Think about it: a high-flying, volatile growth stock might eventually mature into a more stable company, causing its beta to drop. On the flip side, a sleepy utility stock might take on new projects and become a bit riskier, pushing its beta up.
To account for this tendency, many analysts use the Blume adjustment, a formula developed by Marshall Blume back in 1971.
Adjusted Beta = (0.67 × Raw Beta) + 0.33
This formula simply nudges the raw, historical beta closer to 1.0, which often results in a more realistic guess at a stock’s future volatility. For instance, if a stock has a raw beta of 1.50, its adjusted beta would come out to roughly 1.34. This little tweak helps turn beta from a simple historical snapshot into a much more practical tool for investors.
Putting Beta Into Practice With Real Companies

Alright, the theory behind "what is beta in stocks" is one thing, but the concept really clicks when you see how it plays out with companies you actually know. Tying beta values to household names turns these abstract numbers into tangible investment personalities.
It's the best way to see how a company's entire business model—what they sell and how they make money—directly shapes how volatile their stock is.
Let's dig into some real-world examples by looking at stocks with high, low, and market-average betas.
High-Beta Stocks: The Growth Story
A high-beta stock is any stock with a beta over 1.0, meaning it's more volatile than the market. These are often the exciting, growth-focused companies in sectors like technology or consumer discretionary. Their success is tightly wound to the health of the broader economy.
When times are good and the economy is humming, people feel comfortable spending more. That's when these companies can see their profits—and their stock prices—absolutely take off.
The Walt Disney Company (NYSE: DIS) is a classic example. Think about their business: theme parks, cruises, movies. It all depends on people having extra cash to spend. When the market is strong, Disney shines. But when a recession hits, a trip to Disney World is one of the first things a family cuts from the budget, making its stock extra sensitive to big market swings.
As of mid-2022, Disney's beta was 1.24. This suggests it was expected to be 24% more volatile than the S&P 500. For growth-oriented investors, this is the classic trade-off: higher risk for the potential of higher returns. You can learn more about the relationship between beta and stock volatility on MarketBeat.com.
Low-Beta Stocks: The Stability Play
On the complete opposite end of the spectrum, you have low-beta stocks, which have a beta of less than 1.0. These are the market's steady eddies, usually found in "defensive" sectors like utilities and consumer staples. It makes perfect sense when you think about it. People need to pay their electricity bills and buy toothpaste whether the stock market is soaring or crashing.
This built-in, consistent demand creates a stable revenue stream that insulates these companies from the wider market chaos. A utility company, for example, typically operates in a regulated environment with predictable profits. That stability means its stock price doesn't need to swing wildly to reflect the economy, giving it a lower beta. Investors often use these stocks to anchor their portfolios and add a layer of defense.
Stocks With a Beta Around 1.0
When a stock's beta is hovering right around 1.0, it basically moves in lockstep with the market. These are usually massive, mature, and well-diversified companies that are so integral to the economy they almost act as a stand-in for the market itself.
Microsoft (NASDAQ: MSFT) fits this description perfectly. As a titan in software, cloud computing, and business services, its performance is deeply connected to the health of the global economy. As a result, its stock tends to ride the market's general tide, rising and falling right along with it. It’s no surprise its beta often sits just a hair under 1.0, reflecting this market-like behavior.
Key Takeaway: Beta isn't just a random number; it's a direct reflection of a company's business model. A high-flying entertainment giant is going to have a completely different risk profile—and beta—than a slow-and-steady utility provider.
Finally, while they're less common, some assets can have a negative beta. This is a special case where the asset tends to move in the opposite direction of the market. Gold is the classic example here. When the stock market tanks, investors often pile into gold as a "safe haven," pushing its price up.
Using Beta to Build a Smarter Portfolio
Once you get a handle on beta, you've unlocked a powerful way to build a portfolio that actually lines up with your financial goals and how much risk you can stomach. It’s the difference between randomly picking stocks and deliberately engineering your portfolio’s volatility. This simple number can help you shift from being a passive investor to an active architect of your financial future.
It all starts with one simple question: what’s your personal risk tolerance? Your honest answer is the compass that guides every decision from here. Are you shooting for aggressive growth and comfortable with some wild market swings, or is your main goal to protect what you have and keep things stable?
Aligning Beta with Your Investment Style
If you’ve got a higher appetite for risk and a long time horizon, high-beta stocks can be the engine that drives your growth. We're talking about stocks with a beta greater than 1.0, which means they tend to exaggerate the market's ups and downs. Sprinkling these into your portfolio can lead to some seriously impressive returns when the market is roaring.
Think about companies in fast-paced sectors like tech or consumer discretionary. Their fortunes are often tied to the broader economy, which makes them more volatile but also packed with potential. When the market is on a tear, these are the stocks that can give your portfolio a major boost.
On the flip side, if you're a more conservative investor, low-beta stocks (beta less than 1.0) are your best friends. These are the stabilizers in your lineup, providing a much-needed cushion when the market takes a nosedive.
By blending assets with different risk profiles, you can aim for a smoother investment journey. A well-constructed portfolio uses both high- and low-beta stocks to balance the potential for growth with the need for stability, much like a professional fund manager would.
Creating a Balanced Portfolio
The real magic happens when you start combining different beta values to create a truly diversified portfolio. It’s a common myth that diversification just means owning a bunch of different stocks. Real diversification is about owning assets that zig when others zag, performing differently under all sorts of market conditions.
Here’s a practical way to think about it:
- Anchor with Stability: Start with a solid core of low-beta stocks. These are typically your utilities or consumer staples companies—the steady players that provide a reliable foundation.
- Add Growth Potential: Next, layer in a selection of high-beta stocks to make sure you’re capturing that upside potential when the market rallies.
- Include Market Movers: Finally, stocks with a beta right around 1.0, like big, established industry leaders, can help your portfolio move in line with the market's general performance.
This kind of blended approach is what helps smooth out your returns over the long haul. But while beta is a fantastic tool for managing market risk, just remember it doesn't see everything. It won’t tell you about company-specific problems brewing under the surface.
That’s exactly why it’s so important to pair beta analysis with a good, hard look at a company’s financial health. You can dive deeper into this by checking out our guide on what is fundamental analysis, which will walk you through how to evaluate a business's true, underlying value.
Don't Fall for the Beta Trap
So, now you know what beta is and how to use it. That's a huge step forward, and you're already ahead of most investors. But here's where people get into trouble: they stop there. They treat beta like a crystal ball, and that's one of the costliest mistakes you can make.
Think of beta as an incredibly useful tool, like a high-powered lens for your camera. It gives you a fantastic, sharp view of one specific thing—market risk. But it’s not the whole picture.
The biggest thing to remember is that beta is fundamentally backward-looking. It’s calculated using historical price data, usually from the past five years. It tells you a great story about how a stock has behaved, but that’s absolutely no guarantee of how it will perform tomorrow.
Beta Is a One-Trick Pony
A massive limitation of beta is that it only measures one flavor of risk: systematic risk. This is the big-picture stuff that can rock the entire market—think interest rate hikes, recessions, or major geopolitical events. It’s the tide that lifts or sinks all boats.
But it completely ignores the other, equally important half of the story.
Beta tells you zilch about unsystematic risk. This is the danger that's unique to a single company, the internal Gremlins that can torpedo a stock even when the broader market is soaring. We're talking about things like:
- Lousy Management: A CEO makes a string of terrible decisions that craters the company's value.
- Product Disasters: A flagship product gets recalled, or a biotech company's promising drug fails its clinical trial.
- A New Sheriff in Town: A disruptive competitor comes out of nowhere and starts eating their lunch.
- Legal Headaches: An unexpected lawsuit drops, creating a mountain of financial uncertainty.
Because beta is blind to these company-specific landmines, relying on it alone leaves a gaping hole in your risk assessment. A stock with a low beta might look as safe as a savings account on the surface, but it could be hiding some serious skeletons in the closet.
A Stock’s Beta Isn’t Set in Stone
Here's another critical point: a company's beta isn't a permanent tattoo. It can, and often does, change over time. A business isn't static. It grows, it matures, and its risk profile evolves right along with it.
A scrappy, high-beta startup that successfully disrupts an industry might eventually become a stable, cash-generating giant. As its business model solidifies and its revenue becomes more predictable, its beta will naturally drift down toward 1.0.
The beta you see today might not be the beta you get a few years from now. That’s why you can't just "set it and forget it."
Ultimately, you have to see beta as one piece of a much larger puzzle. It gives you invaluable context about a stock's sensitivity to the market, but it's just a starting point. To build a truly solid investment thesis, you have to pair it with old-fashioned homework on the company's leadership, its competitive moat, and its financial health.
Of course. Here is the rewritten section, crafted to sound like it was written by an experienced human expert.
Where to Find Beta and How to Use It
Alright, so now you know what beta is. But where do you actually find this number?
Thankfully, you don’t need a fancy terminal or expensive subscription. Finding a stock's beta is pretty straightforward once you know where to look. Most of the big financial sites you already use—like Yahoo Finance, Bloomberg, and Reuters—provide this for free.
This easy access is what makes beta such a practical tool. You don't have to calculate it yourself; you just need to know how to find it and, more importantly, how to interpret it.
Locating Beta on Financial Websites
Let's walk through it. When you pull up a stock quote on one of these sites, you're looking for the summary or statistics section. It's usually listed right there with other key metrics like the P/E ratio and market cap.
For example, here's a typical stock summary page on Yahoo Finance.
See it there? The beta value is listed prominently, but there's a crucial detail you can't afford to miss next to it.
Notice how it often specifies the time frame used for the calculation. The industry standard, and the one you'll see most often, is Beta (5Y Monthly). This means the beta was calculated using 5 years of monthly price data. This is the benchmark you want to use because it ensures you're comparing different stocks on a level playing field.
A word of caution: Always check the time frame. If you're comparing one stock's 5-year beta to another's 3-year beta, you're not getting an accurate picture. It's like comparing a marathon runner's pace over 26 miles to a sprinter's pace over 100 meters—the context is completely different and can lead you to some seriously flawed conclusions.
Once you know where to find this number and what to look for, you're ready. You can start confidently using beta to get a quick read on the market risk for any stock you're considering.
Got Questions About Beta? We've Got Answers.
Even after you get the hang of beta, a few specific questions always seem to pop up. That’s totally normal. Let's walk through the most common ones I hear to iron out any wrinkles and help you start using this stuff with confidence.
These aren't textbook definitions. They’re answers based on real-world scenarios that actually matter when you're looking at where to put your money.
Can a Stock Have a Negative Beta?
Absolutely, though you won't see it every day. A stock with a negative beta is one that tends to zig when the market zags. If the S&P 500 rallies hard, a negative-beta stock is likely to drop, and vice-versa.
Historically, some gold mining stocks have fit this bill. When the market gets shaky, investors often pile into gold as a “safe haven,” which can boost the shares of companies that pull it out of the ground. That makes negative-beta assets a fascinating, if rare, tool for potentially hedging your portfolio against a broad market downturn.
Is a High-Beta Stock a Bad Investment?
Not in the slightest. A high beta (anything over 1.0) just tells you the stock is more volatile than the overall market. While that definitely means more risk, it also opens the door to potentially higher returns. Think of it as turning up the volume on market movements.
A high-beta stock can be a powerful engine for growth in a well-balanced portfolio, especially if you have a higher tolerance for risk. The trick is making sure that kind of volatility fits with your personal financial goals and your philosophy on what is long-term investing.
How Often Should I Check a Stock's Beta?
Beta isn’t a set-it-and-forget-it number. It’s constantly being recalculated with new price data, so it will change over time. You don't need to obsess over it daily, but checking in on your holdings' betas quarterly or even semi-annually is a solid habit.
You'll sometimes see significant shifts, especially if a company's business fundamentals change—like a fast-growing tech darling maturing into a slower, more stable industry giant. A quick, regular check-in makes sure your portfolio's risk level hasn't silently drifted away from what you originally intended.
At Investogy, we don't just track these numbers; we explain the "why" behind every move in our own portfolio. Subscribe to our free newsletter to see how we manage real money and build conviction in the stocks we own.
Leave a Reply