
Stock valuation methods are the financial tools investors use to puzzle out the intrinsic value of a company's stock. Think of them as your personal appraisal toolkit, helping you figure out what a stock is truly worth, completely separate from its often-wildly fluctuating market price. This is how you make informed decisions instead of just gambling.
Why Stock Valuation Is Your Ultimate Investing Edge
You'd never buy a house without getting it appraised, right? You need an expert's take on its real value based on its condition, location, and what similar homes have sold for. Just taking the seller's word for the price would be a massive, and likely expensive, gamble.
Well, investing in the stock market is no different. A stock’s current price is simply what someone is willing to pay for it this very second, not what the underlying business is fundamentally worth.
Stock valuation is your appraisal process for the market. It gives you a structured way to cut through the daily noise and market hype to calculate a company's intrinsic value. This is the absolute bedrock of value investing, the strategy championed by legends like Warren Buffett.
The core idea is as simple as it is powerful: Price is what you pay; value is what you get. If your valuation tells you a stock is worth $150, but it's currently trading for $100, you've just uncovered a potential bargain.
This analytical approach grounds your investment decisions in financial reality, saving you from the emotional rollercoaster of hype and fear.
From Educated Guesswork to Data-Driven Science
For a long time, picking stocks was more of an art than a science. That all changed with the arrival of large-scale financial data. A huge turning point was the creation of the Center for Research in Security Prices (CRSP) database back in 1964, which, for the first time, allowed for heavy-duty statistical analysis of how the market actually behaves.
This flood of new data let researchers like Eugene Fama discover that stock returns don't follow a neat "bell curve" as everyone assumed. Instead, they have "heavy tails," which is a fancy way of saying that extreme, gut-wrenching price swings happen way more often than you'd think. These findings just underscore why having solid stock valuation methods in your back pocket is so critical for navigating the market's inherent volatility. If you're a history buff, you can learn more about this era by exploring some of the foundational market studies.
The Main Approaches to Finding Value
To help you get your bearings, we've put together a quick comparison of the major valuation frameworks we'll be covering. Think of this as your cheat sheet.
Quick Overview of Key Stock Valuation Methods
| Valuation Method | Core Principle | Best For |
|---|---|---|
| Intrinsic Value | What is the company worth based on its future cash-generating power? | Stable, mature companies with predictable cash flows (e.g., DCF). |
| Relative Value | How does this company stack up against its direct competitors? | Quickly assessing if a stock is cheap or expensive compared to its peers. |
| Asset-Based Value | What would be left over if the company sold all its assets and paid off its debts? | Companies with lots of physical assets, or in turnaround/liquidation scenarios. |
While the formulas and spreadsheets can seem intimidating, most stock valuation techniques boil down to one of these three core ideas. Understanding these different angles is the first step toward building a robust investing toolkit.
By getting a handle on these techniques, you'll graduate from being a market speculator to a true investor—someone who is equipped to spot genuine opportunities and build a portfolio that can stand the test of time.
Finding Intrinsic Value with Discounted Cash Flow
Out of all the ways to value a stock, Discounted Cash Flow (DCF) is often seen as the gold standard. It's the method most focused on figuring out what a company is truly worth, deep down. At its core, DCF is built on a simple, powerful idea: a business is worth all the cash it's going to generate for its owners from this day forward.
Think about it like buying a small apartment building. How would you decide on a fair price? You'd probably start by estimating all the future rent you expect to collect. Then, you'd have to adjust that total because money you get years from now isn't as valuable as money in your pocket today. DCF applies this exact same logic to a company.
Instead of rent checks, we focus on a company’s free cash flow (FCF). This is the real, spendable cash left over after a business pays for everything it needs to run and grow. By forecasting these future cash flows and then "discounting" them back to what they're worth today, we can arrive at a logical, fundamentals-based price for the entire company.
The Core Components of a DCF Analysis
A DCF spreadsheet can look intimidating, filled with formulas and projections. But really, it all comes down to just three main steps. The whole point is to turn a company's future potential into a single, concrete number we can use right now.
This flowchart gives you a bird's-eye view of how a DCF valuation comes together.
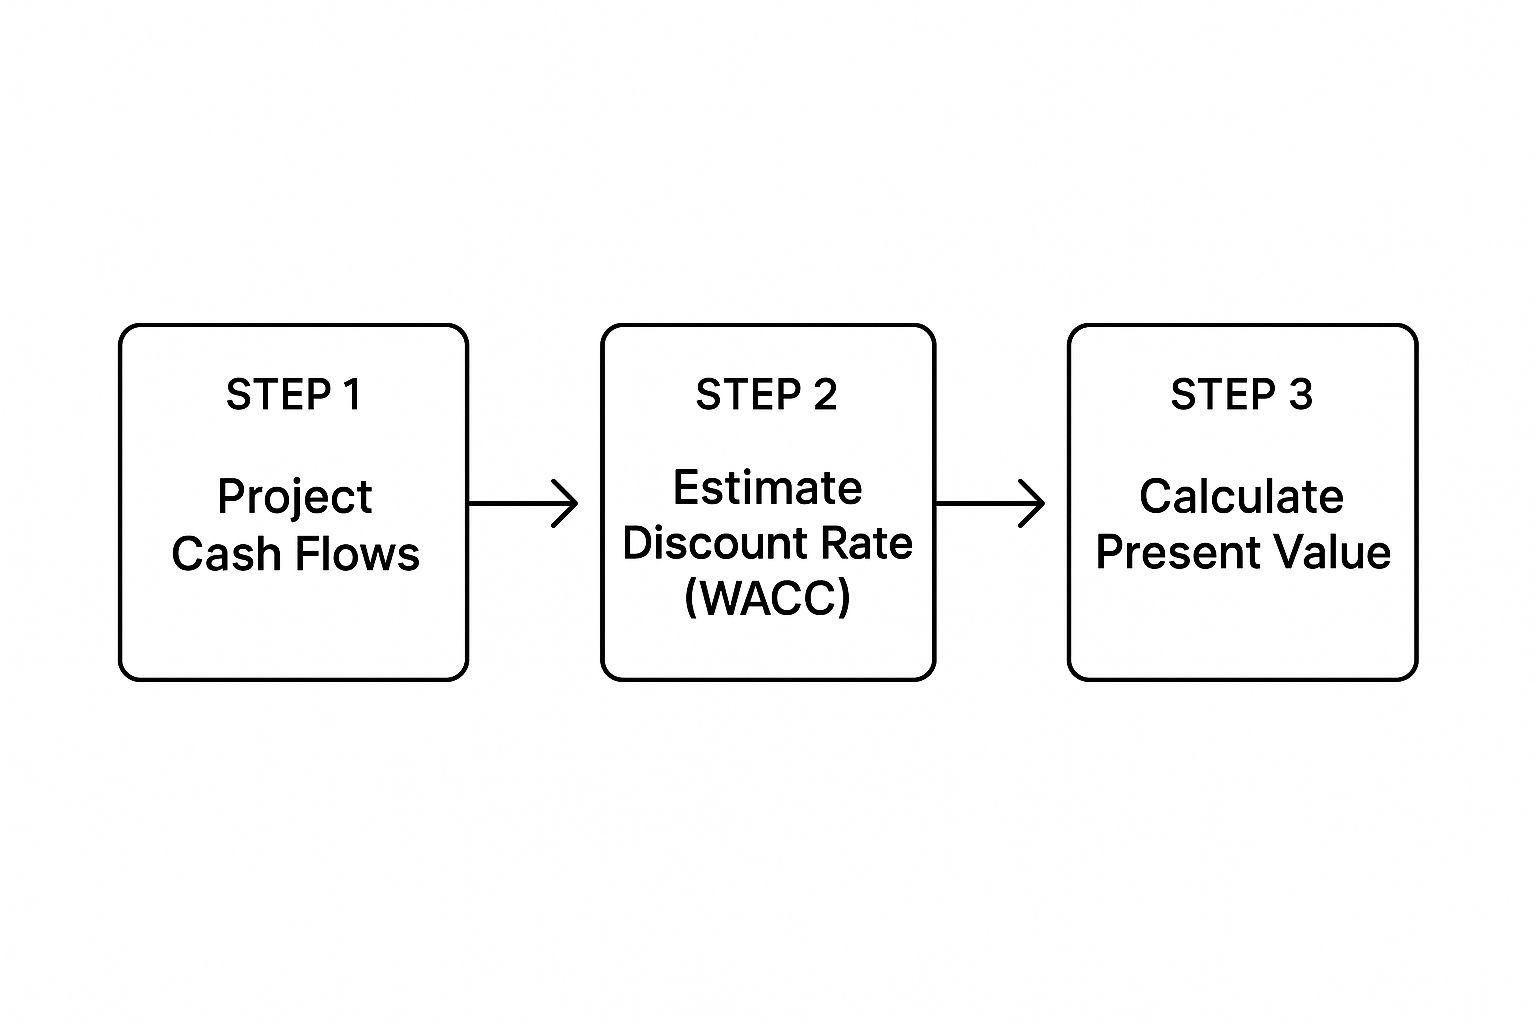
As you can see, the process moves from predicting the future to calculating what that future is worth today. It's a structured path to a final number.
Let’s unpack each of these key steps.
-
Project Future Free Cash Flows: This is where most of the heavy lifting happens. You have to dig into the company’s history, its industry, and its competition to forecast its free cash flow for a set period, usually 5 to 10 years. If you assume strong growth, you'd better have a solid story to back it up.
-
Determine a Discount Rate: A dollar tomorrow is worth less than a dollar today. That's a fact. We use a "discount rate" to bring those future cash flows back to their present value. This rate is all about risk—the riskier the investment, the higher the discount rate. A common approach is using the Weighted Average Cost of Capital (WACC), which is just a blend of what the company pays for its debt and what its shareholders expect as a return.
-
Calculate the Terminal Value: Businesses don't just vanish after 10 years. The terminal value is your best guess of what the company will be worth for all the years beyond your forecast, assuming it settles into a stable, long-term growth pattern (often something close to the long-term inflation rate).
Once you have these three pieces, you just discount each year's projected cash flow and the terminal value back to today's dollars and add them all up. The final sum is your estimate of the company's intrinsic value. If that value is way higher than the stock's current market price, you might have just spotted a bargain.
DCF in the Real World
Let's take a company we all know, like Microsoft. An analyst would start by forecasting its revenue growth, profit margins, and how much it needs to reinvest in the business for the next decade. Then, they’d figure out an appropriate WACC based on Microsoft’s risk profile and how it's funded. Finally, they'd slap on a perpetual growth rate to calculate its terminal value.
The real power here is that DCF forces you to think like a business owner. You're not just looking at a ticker symbol; you're dissecting a living, breathing business—its competitive moat, its management team, and its long-term runway for growth.
"A DCF analysis is useful when investing money now and expecting some rewards in the future… If the intrinsic value is higher than the current price, it could be a good investment opportunity.” – Suraj Srinivasan, Harvard Business School Professor
The Strengths and Weaknesses of DCF
Look, no valuation method is a crystal ball, and DCF has its own set of pros and cons. Its biggest advantage is that it’s tied directly to a company's ability to generate cold, hard cash. That makes it far less swayed by the market's daily mood swings.
But its greatest weakness is that it's built on a pile of assumptions.
- Sensitivity: Change your growth rate or discount rate assumption by just a tiny bit, and your final valuation can swing wildly. It's incredibly sensitive.
- Forecasting Difficulty: Let's be honest, predicting cash flows 10 years from now is tough. For young, fast-changing companies, it can feel like pure guesswork.
- Terminal Value Dominance: In many DCF models, the terminal value can make up over 70% of the final number. This means your entire valuation hinges heavily on a single assumption about the company's growth forever into the future.
Because of these issues, it's a huge mistake to treat a DCF result as a single, perfect price. A much smarter way to use it is to establish a range of possible values. By playing with your assumptions (a technique called sensitivity analysis), you can build a much more realistic and durable picture of what a stock might actually be worth.
Valuing Companies Through Dividend Models

While a DCF analysis looks at a company's total ability to churn out cash, some valuation methods get straight to the point: what cash is coming directly back to me? This is the world of dividend-based models, a beautifully direct way to think about what a stock is worth.
The idea behind it is simple and elegant. A stock's value is just the sum of all its future dividend payments, pulled back to what they’re worth today. Think of it like a bond—you get regular coupon payments (dividends), and the bond's value hinges on those future cash flows. The Dividend Discount Model (DDM) is the classic framework for doing just this with stocks.
The Gordon Growth Model Explained
Now, the most famous flavor of the DDM is the Gordon Growth Model (GGM). Honestly, it's a lifesaver for analysts because it makes a big, simplifying assumption: that a company's dividends will grow at a steady, constant rate forever. This makes it an incredibly practical tool for a very specific kind of company.
The formula is surprisingly simple:
Value of Stock = D₁ / (r – g)
Let's unpack what that really means in plain English:
- D₁ (Expected Dividend Next Year): This is the next annual dividend you expect the company to pay per share. A common way to estimate this is to take the most recent dividend and tack on the expected growth rate.
- r (Required Rate of Return): This is all you. It’s the minimum return you demand for taking on the risk of owning that particular stock. Think of it as your personal hurdle rate for the investment to be worth your time and money.
- g (Constant Dividend Growth Rate): This is the rate you expect the dividend to grow, year after year, forever. It has to be a realistic, long-term number—usually something less than the growth rate of the overall economy.
This little formula cuts through a ton of noise to give you a quick estimate of a stock’s intrinsic value based on what it pays out directly to its owners.
When Dividend Models Shine Brightest
So, when should you pull the Gordon Growth Model out of your toolkit? It’s definitely not a one-size-fits-all solution. Its core assumption about perpetual growth makes it a perfect match for a certain business profile.
This model works best for valuing:
- Mature, stable companies with a long, proven history of paying and raising their dividends. Think of the blue-chip giants like Coca-Cola or Procter & Gamble.
- Businesses in non-cyclical industries with predictable earnings, like utilities or consumer staples companies.
- Real Estate Investment Trusts (REITs), which are structured to pay out the vast majority of their income as dividends by law.
For these kinds of steady-eddie businesses, assuming stable, endless growth is a lot more reasonable. But this also points to the model's biggest blind spot.
It's completely useless for companies that don't pay a dividend. High-growth tech firms or startups that plow every penny back into the business? A DDM calculation is impossible because the top of the formula (D₁) would be zero.
A Look at Historical Context
The role of dividends in an investor's total return has shifted over the decades. Back in the day, a stock's dividend yield was a huge piece of the puzzle. Historical analysis, however, shows a clear trend. Since the mid-20th century, capital gains—the appreciation in the stock's price—have become a much bigger driver of returns.
Despite this, dividend models have held up surprisingly well, often aligning with historical price trends and proving their lasting relevance. For a deeper dive, you can check out the full research on the historical role of dividends in the market.
At the end of the day, you wouldn't use a DDM to value the next hot tech startup. But when you need a clear-eyed look at a stable, income-generating machine, it remains a powerful and essential part of a complete valuation analysis.
Using Relative Valuation and Market Multiples
Sometimes, the simplest way to figure out what something is worth is to just look at what similar things are selling for. We do this all the time. If you’re selling your house, you don’t just pull a price out of thin air. You look at what comparable homes in your neighborhood have sold for recently. This exact logic is the engine that drives relative valuation in the stock market.
Instead of trying to predict a company’s cash flows far into the future like you do with a DCF analysis, relative valuation keeps you grounded in the here and now. It tackles a different, but equally critical question: how does this stock’s price compare to its peers, its own track record, or the broader market right now? It's a method built on the simple idea that similar assets should, in theory, trade at similar prices.
The tools we use for this kind of comparison are called market multiples, or valuation ratios. These ratios take a company's stock price and measure it against a key business metric, like earnings or sales. This standardizes the price, letting you make apples-to-apples comparisons.
The Most Common Valuation Multiples
There are dozens of multiples out there, but a handful are the undisputed workhorses of finance. Each one offers a slightly different angle on how the market is pricing a company. Knowing what each one measures is key to using them right.
We can't talk about multiples without starting with the big three. Here's a look at the most common multiples, what they're made of, and what they really tell you.
Comparison of Common Valuation Multiples
| Multiple | Formula | What It Tells You |
|---|---|---|
| Price/Earnings (P/E) | Market Price per Share / Earnings per Share (EPS) |
How much investors are willing to pay for each dollar of a company's current earnings. A high P/E can signal high growth expectations. |
| Price/Sales (P/S) | Market Price per Share / Revenue per Share |
How the stock is priced relative to its total sales. This is especially useful for valuing companies that aren't yet profitable. |
| Enterprise Value/EBITDA | (Market Cap + Debt - Cash) / EBITDA |
A more complete picture that compares the company's total value (including debt) to its raw operational earnings before accounting or tax details. |
Each of these gives you a unique lens. The P/E ratio is the most famous, but it's not a silver bullet. If a company has bumpy earnings or is in the red, P/E becomes useless. That’s exactly why you need other tools like the P/S and EV/EBITDA ratios in your back pocket.
Putting Relative Valuation into Practice
Using these multiples is more than just plugging numbers into a formula. It’s an art that requires good judgment. The process usually breaks down into a few key steps.
- Select a Multiple: First, pick the right tool for the job. For a stable, profitable industrial giant, P/E might be a great fit. For a high-growth, unprofitable tech startup? The P/S ratio is your best friend.
- Find a Peer Group: This is the most crucial—and trickiest—step. You have to find a set of genuinely comparable companies. Think same industry, similar business models, and comparable size and risk. Trying to compare a small regional bank to a global powerhouse like Goldman Sachs just won't give you a meaningful answer.
- Calculate and Compare: With your peer group set, figure out the average or median multiple for those companies. Then, see how your target company’s multiple stacks up. If it's trading at a big discount to its peers, you might have found an undervalued gem—or, there could be a very good reason for that discount. It's your job to find out which it is.
This whole comparative approach is deeply rooted in financial theory. For instance, the Gordon Growth Model, which we often use for dividend valuation, also provides the theoretical backbone for the Price/Earnings (P/E) ratio. Both models suggest that companies with similar growth and risk profiles should trade at similar multiples, making the P/E ratio a cornerstone of valuation. You can dive deeper into the academic underpinnings of these ratios to see how it all connects.
The Pros and Cons of Market Multiples
The biggest win for relative valuation is its simplicity. It’s a direct, real-time gut-check on market sentiment. It tells you what other investors are thinking and, more importantly, what they're paying for similar assets today.
But that strength is also its biggest weakness. If an entire industry gets caught in a speculative bubble, a stock might look "cheap" next to its peers, but the whole group could be wildly overpriced. This method tells you if something is cheaper or more expensive than the crowd, but it can’t tell you if the crowd is insane. On top of that, finding a truly comparable peer group is often more of an art than a science, which can make or break your entire analysis.
Choosing the Right Valuation Method for Any Stock

After digging into all these different ways to value a stock, you're probably asking yourself: which one is the best?
It's a fair question, but the honest answer is… there isn't one. A much better way to think about these models is like a specialized toolkit. You wouldn't use a hammer to saw a board in half, and you certainly wouldn't use a dividend model for a company that doesn't pay one.
Picking the right approach is a strategic move, and it all boils down to the specific company you're looking at. The best model depends on things like the company's industry, where it is in its business lifecycle, and its unique financial fingerprint. A mature, stable utility company and a fast-growing, money-losing tech startup are two completely different animals, and they need to be analyzed that way.
This is exactly why experienced investors almost never hang their hat on a single number. Instead of hunting for one perfect valuation, they use several methods to triangulate a company's real worth. This is a pro technique that gives you a much more defensible and realistic valuation range.
Matching the Method to the Company
To use these tools like a pro, you have to diagnose the company's profile first. Different types of businesses just naturally fit better with certain analytical frameworks. Making that connection is the key to coming up with a valuation that actually means something.
Here's a quick cheat sheet to help you match the right model to the right company:
- For Mature, Stable Businesses: Companies with a long, proven history of predictable profits and steady dividend checks are the perfect match for the Dividend Discount Model (DDM). Think of classic blue-chip stocks or well-established utility companies.
- For High-Growth Companies: Young, fast-growing companies that plow every penny of profit back into the business are often, well, unprofitable. For them, a Discounted Cash Flow (DCF) analysis that focuses on their long-term potential, or even a Price/Sales (P/S) ratio, is going to tell you a lot more than an earnings-based multiple.
- For Asset-Heavy Industries: Companies in sectors like manufacturing, energy, or banking have a ton of physical stuff—tangible assets—on their balance sheets. An Asset-Based Valuation can give you a solid floor for their value, basically showing you what the company might be worth if it had to sell everything off.
The Power of Triangulation
The real art of valuation is in combining these different points of view. For instance, you could run a DCF analysis to get a feel for a company's intrinsic value based on all the cash it's expected to generate in the future. At the same time, you could use relative valuation to see how the market is currently pricing its direct competitors.
By combining an intrinsic value model (like DCF) with a market-based model (like P/E ratios), you create a powerful cross-check. If your DCF suggests a stock is worth $50 but its peers trade at multiples implying a value of $80, it forces you to ask critical questions about your assumptions or the market's sentiment.
When you start layering these different stock valuation methods, you move past just plugging numbers into a formula. It's about mixing the hard data with your own critical judgment. The goal is never to land on one magic number. It's to build a well-rounded, evidence-based argument for what a stock could be worth, giving you the confidence you need to make your move.
Common Questions on Stock Valuation
Even after you get the hang of the main valuation techniques, a few questions always seem to pop up when it's time to actually put them to work. Let's tackle some of the most common ones I hear from investors.
Think of this as your practical, no-nonsense guide to clearing up any lingering confusion and building some real confidence.
What’s the Most Accurate Way to Value a Stock?
This is the million-dollar question, isn't it? The honest answer, learned through years of practice, is that no single method is a magic bullet. Each one has its own strengths and, more importantly, its own blind spots.
- Discounted Cash Flow (DCF) is, in theory, the purest method. It's all about a company's raw ability to spit out cash. The problem? It lives and dies by your assumptions. A tiny tweak to your growth rate or discount rate can spit out a wildly different number.
- Relative Valuation (think P/E ratios) is your reality check. It's quick, easy, and tells you how the market is pricing a company right now compared to its peers. But it can be a trap. If the whole sector is in a bubble, your "reasonable" P/E ratio is just the prettiest horse in the glue factory.
The real pros never, ever hang their hat on a single number. The best practice is to use a few different methods to create a valuation range. By triangulating your answer, you get a much more reliable and defensible picture of what a stock is truly worth.
How Do You Value a Company That Doesn’t Make Money?
This is a classic problem, especially with high-growth tech startups or companies in the middle of a major turnaround. Your trusty P/E ratio is totally useless here because there are no "E" (earnings) to speak of.
So, you have to pivot your approach:
- Price/Sales (P/S) Ratio: This is a go-to. Instead of earnings, you compare the stock price to its revenue. It's a great way to gauge valuation before a company hits profitability.
- Long-Term DCF Model: You can absolutely still use a DCF. You just have to be willing to look further down the road. Your model will need to project cash flows out to a point where you can realistically see the company achieving stable profits.
For these kinds of companies, your focus shifts. You're not analyzing current profits; you're betting on future potential, the size of their market, and whether they have a real, sustainable edge over the competition.
Can I Trust the Valuation Numbers on Financial Websites?
Those big financial sites are fantastic for getting a quick snapshot of the data, but you have to use them with a healthy dose of skepticism. It is absolutely critical to understand how they calculate their numbers, because they often differ from site to site.
For instance, one site might show you a Trailing Twelve Months (TTM) P/E, which looks at past earnings. Another might use a Forward P/E, based on analyst guesses about the future. These aren't just small details; they can lead you to completely different conclusions about a stock's value.
My advice? Use these sites as a starting point, but for any investment that really matters to you, do your own homework. Pull the real numbers from the company's financial statements and run the calculations yourself. It's the only way to be sure.
At Investogy, we do this deep, time-consuming research for you. We don't just give you stock picks; we share our complete investment theses—the "why" behind every single stock in our real-money portfolio. You can see exactly how we apply these valuation principles in the real world. To follow our journey and build your own investing conviction, subscribe to our free weekly newsletter.
Article created using Outrank
Leave a Reply