Investogy Blog

  • How to Calculate Return on Investment: A Complete Guide

    How to Calculate Return on Investment: A Complete Guide

    Calculating your return on investment is actually pretty straightforward. At its core, you're just dividing the net profit you made by what the investment originally cost you.

    The classic formula is ROI = (Net Profit / Cost of Investment) x 100. This spits out a percentage that tells you, in simple terms, how profitable your investment was. It’s a single number that reveals how hard your money is working for you.

    What Return on Investment Really Means

    Image

    Before we start plugging in numbers, it's crucial to get what you're really measuring. Think of Return on Investment (ROI) as a universal yardstick for performance. I’ve seen it used to evaluate everything from a massive corporate acquisition down to a single stock in a personal portfolio.

    Its main job is to cut through gut feelings and give you a clear, standardized measure of financial gain (or loss) compared to the cash you put on the line. A positive ROI means you came out ahead. A negative one, well, that means you lost money.

    Breaking Down the Core Components

    To get a number you can trust, you have to be honest about the two main parts of the formula: Net Profit and Cost of Investment. Getting these right is the difference between a useful metric and a misleading one.

    To make sure we're on the same page, let's break down exactly what goes into a proper ROI calculation.

    Key Components of the ROI Formula

    A breakdown of the essential elements needed to calculate ROI accurately.

    Component What It Includes Quick Example
    Net Profit The final value of the investment minus its initial cost. It’s your total take-home gain. Buy a stock for $1,000, sell it for $1,500. Your net profit is $500.
    Cost of Investment The initial purchase price plus all associated costs (commissions, fees, taxes, maintenance). That $1,000 stock purchase included a $10 brokerage fee. Your true cost is $1,010.
    Final Calculation (Net Profit / Cost of Investment) x 100 ($500 / $1,010) x 100 = 49.5% ROI.

    Getting these components right is absolutely critical for an accurate picture of your investment's performance.

    A common mistake I see all the time is people only looking at the purchase price for the "cost." A true ROI analysis demands you account for every single penny spent to acquire and maintain the investment—from brokerage fees to renovation costs on a rental property.

    This metric is essential for both quick trades and for understanding the health of your portfolio over many years. For those focused on building wealth over the long haul, understanding the fundamentals of what is long-term investing is key to seeing how ROI fits into the bigger picture.

    Ultimately, once you master how to calculate return on investment, you're empowered to make smarter, data-driven financial decisions instead of just guessing.

    Calculating ROI With Real-World Numbers

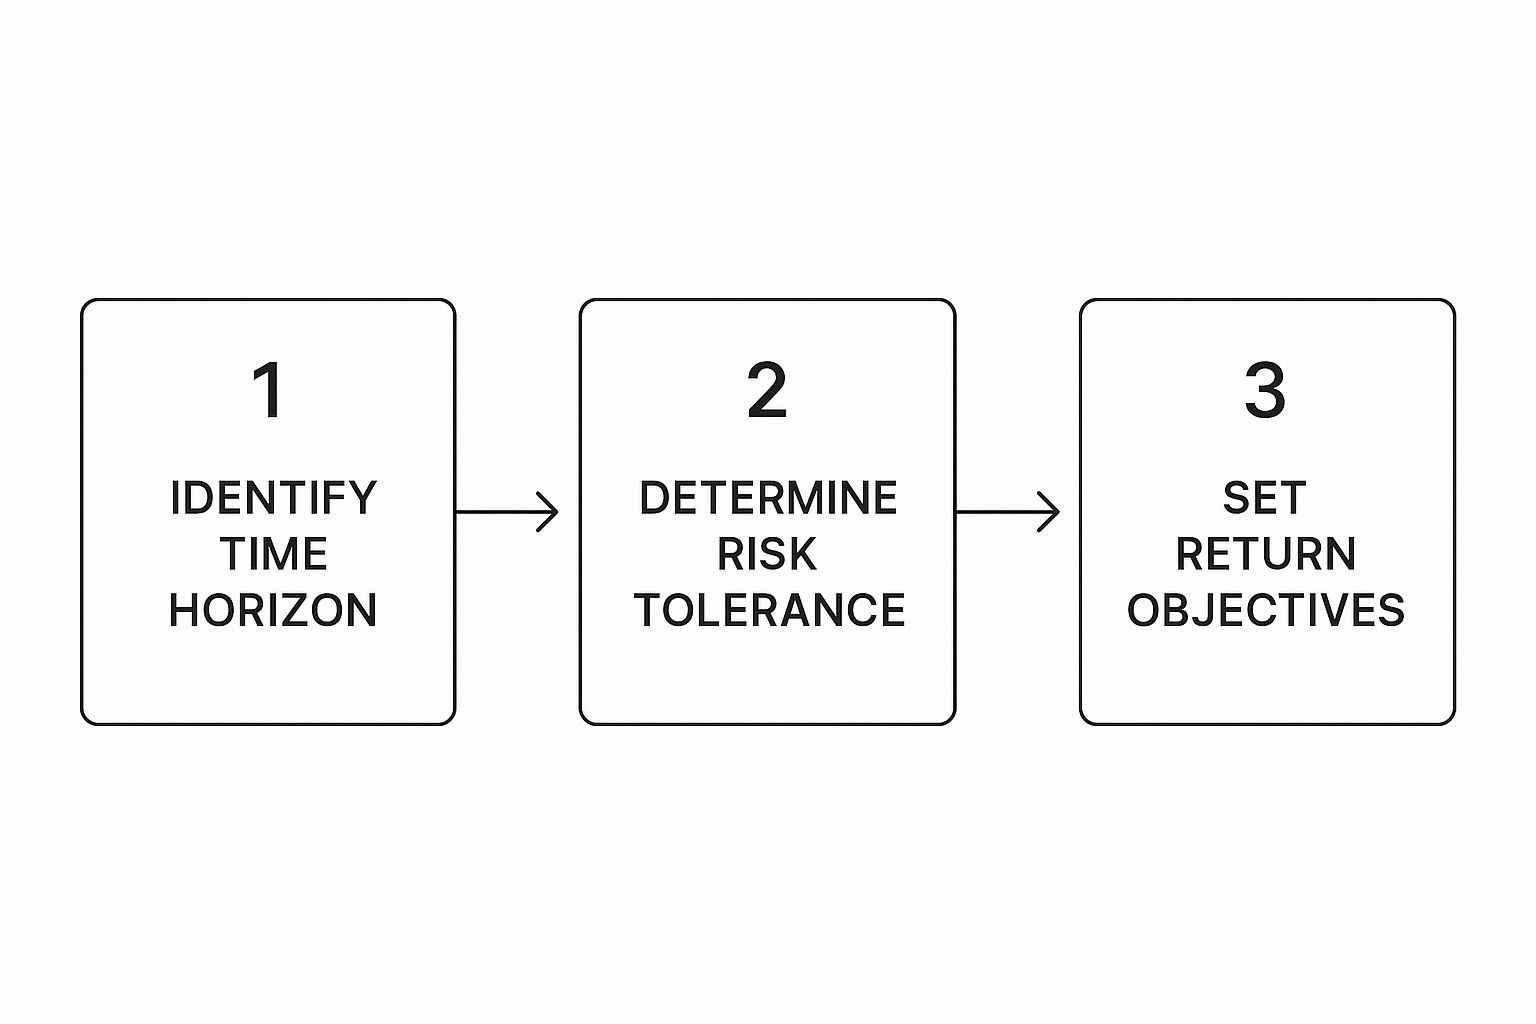
    Alright, let's move beyond the textbook formula and get our hands dirty with some real-world numbers. This is where the rubber meets the road. The basic idea is simple: figure out your Net Profit and divide it by your true Cost of Investment.

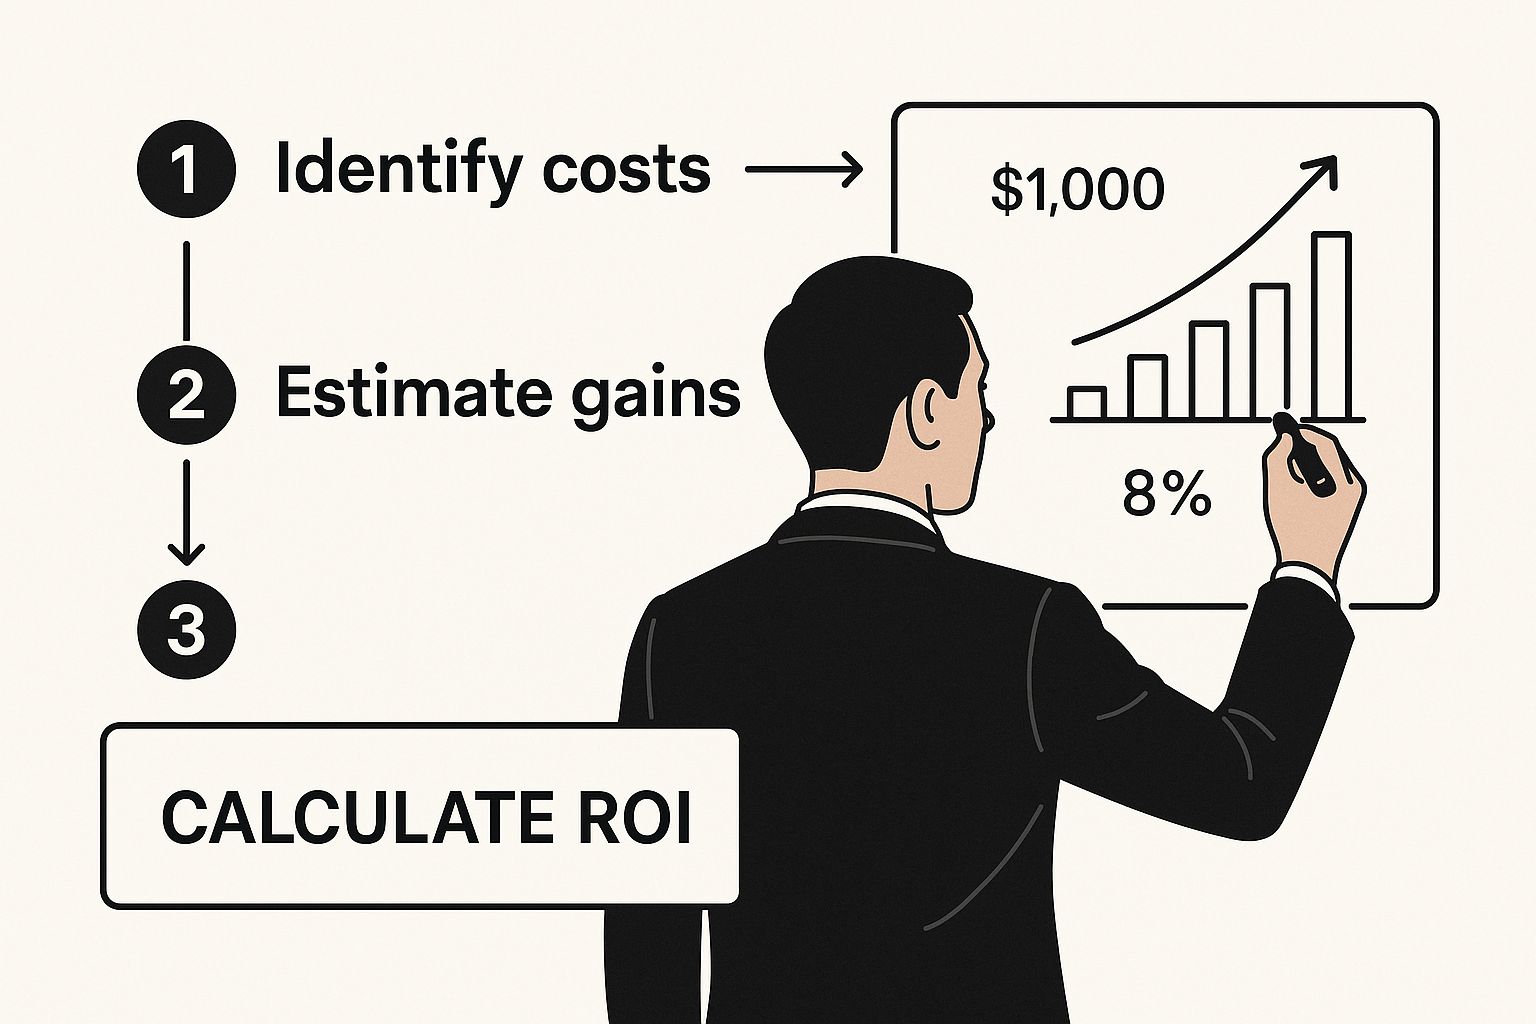
    But here's where so many people mess up: the true cost. It's not just the sticker price. If you forget to include every single related expense, you're just fooling yourself. I've seen it happen countless times—a seemingly profitable venture turns out to be a money pit once all the hidden fees, taxes, and maintenance costs are tallied up.

    This is the entire game. Nailing down your total costs is the difference between an accurate ROI and a fantasy number.
    Image

    As you can see, getting that final ROI percentage requires you to be a bit of a detective, uncovering every single cost before you can see the real profit.

    Let's walk through a few scenarios I've seen play out.

    Digital Marketing Campaign Example

    Imagine a local business decides to run a Google Ads campaign and puts $5,000 into it. That's their initial investment. The campaign is a hit, bringing in $15,000 in new sales over the quarter.

    Looks great, right? But hold on. The cost of producing the goods they sold was $4,000. So, the gross profit from those sales is actually $11,000 ($15,000 – $4,000). To get the net profit, we have to subtract the ad spend: $6,000 ($11,000 – $5,000).

    Now we can calculate the real ROI:
    ($6,000 Net Profit / $5,000 Cost of Investment) x 100 = a 120% ROI.

    Real Estate Flip Example

    This is a classic. Let's say you buy a fixer-upper for $200,000. You pour $30,000 into renovations and spend another $10,000 on closing costs, realtor commissions, and property taxes. Your actual, total Cost of Investment isn't $200k—it’s $240,000.

    You sell the spruced-up house for $300,000. Your Net Profit is the sale price minus your total investment: $300,000 – $240,000 = $60,000.

    This is a crucial point: failing to include renovations, fees, and taxes in your 'Cost of Investment' would have artificially inflated your ROI from a realistic 25% to a misleading 50%. This is how investors fool themselves.

    The real ROI on this flip is:
    ($60,000 Net Profit / $240,000 Cost of Investment) x 100 = 25% ROI.

    Stock Purchase Example

    Calculating ROI for stocks follows the same logic, you just have to account for fees. You buy 100 shares of a company at $50 per share, an initial layout of $5,000. But you also paid a $10 brokerage fee. Your total cost is actually $5,010.

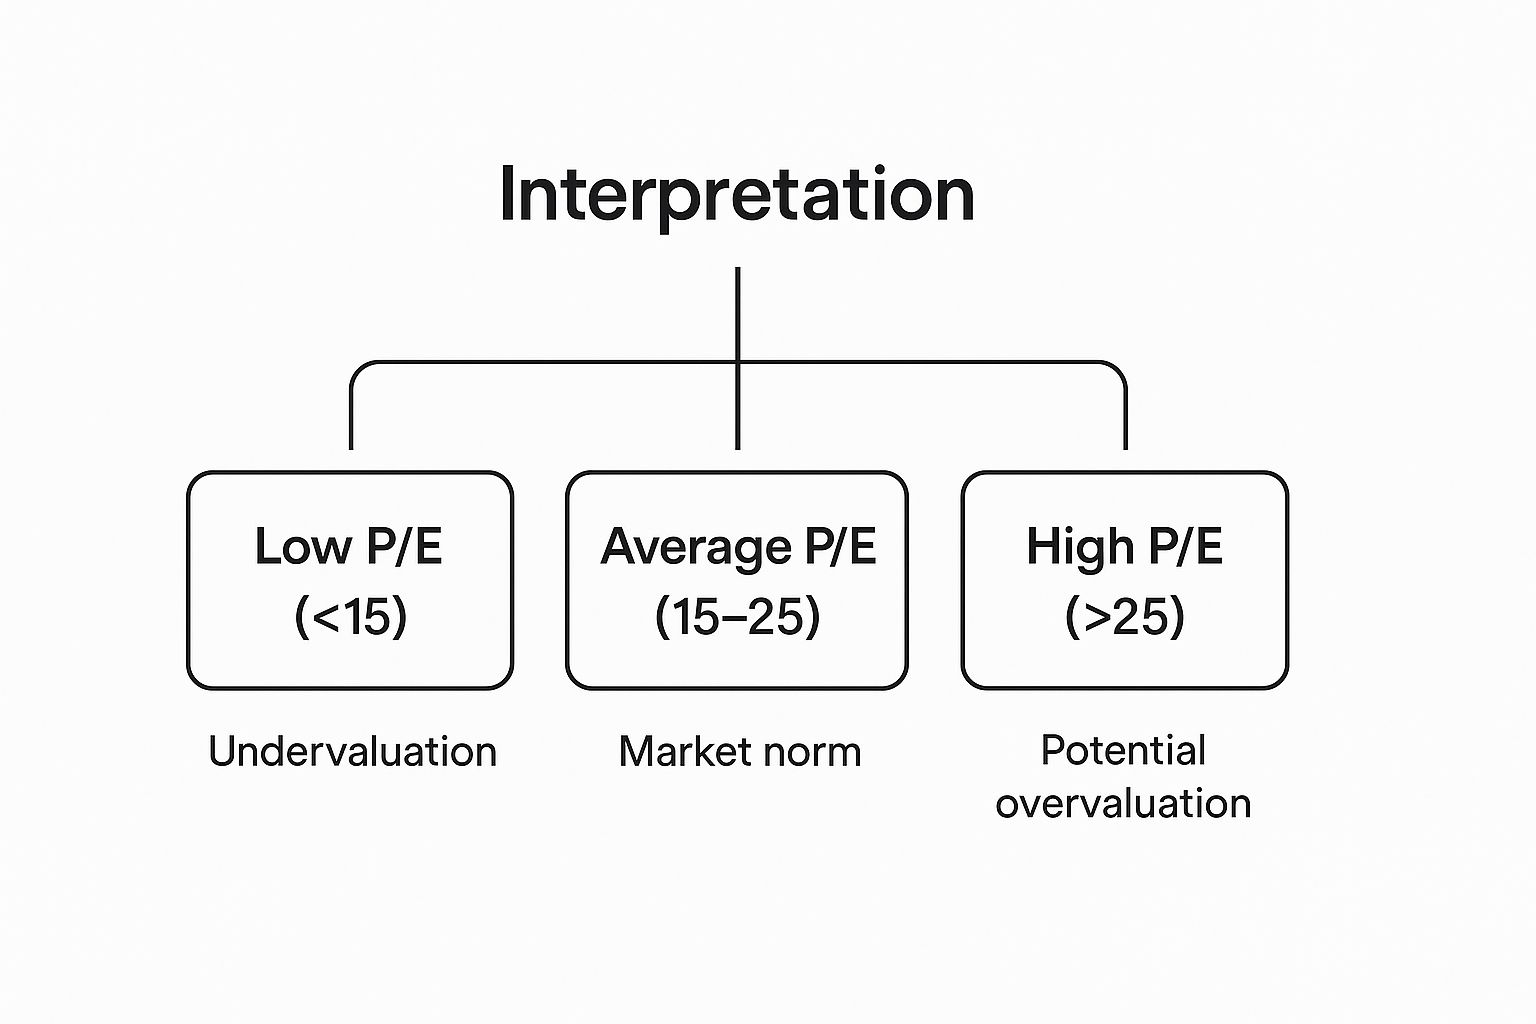
    For investors who want to go deeper than just price and ROI, our guide on understanding the price-to-earnings ratio is a great place to start.

    A year later, you sell all the shares for $60 each, pocketing $6,000. But again, there's a $10 commission on the sale. Your true net gain is $980 ($6,000 sale price – $5,010 initial cost – $10 sale fee).

    So, the ROI on your stock trade is:
    ($980 Net Profit / $5,010 Cost of Investment) x 100 = 19.56% ROI.

    As you can see, the core formula adapts to just about any scenario. If you want to see it applied to another common investment type, this guide on how to calculate CD returns breaks it down with clear examples and formulas. The principles are universal.

    Putting Your ROI Into Meaningful Context

    Image

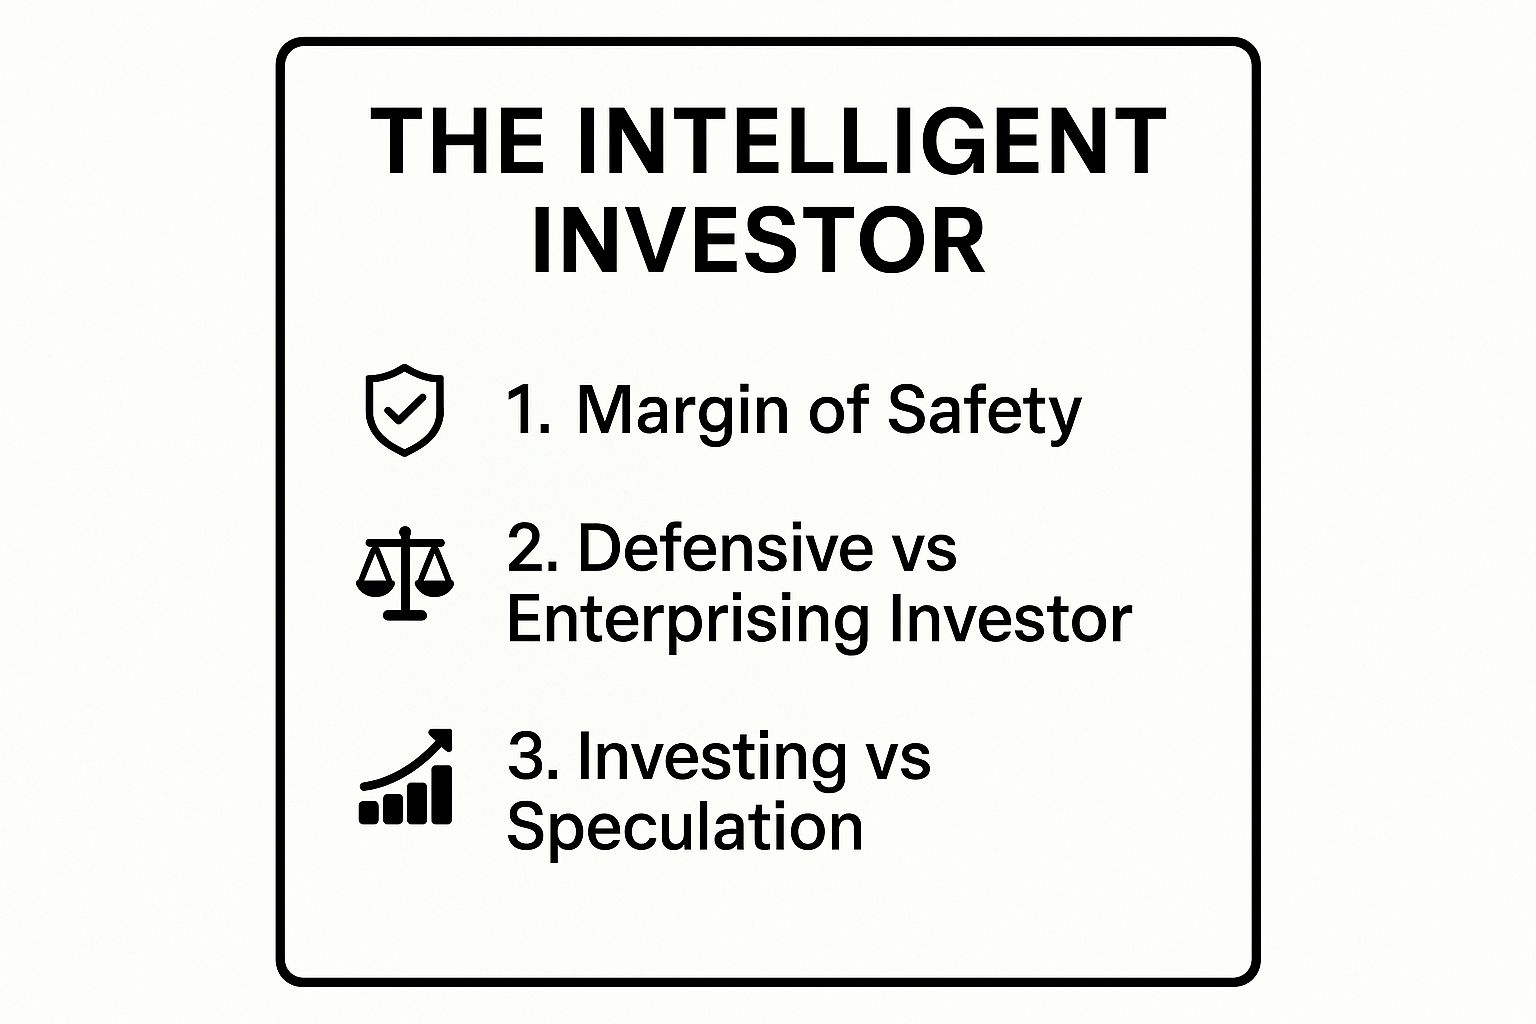
    So you've run the numbers and calculated your return on investment. Great. But that number, all by itself, is almost meaningless. A 10% ROI might be a phenomenal success for one investment and a complete dud for another. To really figure out if you made a good move, you need to add context.

    Context is what turns a simple percentage into an actionable insight. It helps you answer the real question: "Was this a good return?" This is where you graduate from the basic math of ROI and step into the art of financial analysis. It's a skill I've had to hone over years of wins and losses.

    The first thing you need to do is benchmark your results. You have to compare your ROI against industry standards, your own historical performance, and what other investments could have given you. If your real estate flip brought back 8%, but similar properties in the same neighborhood averaged 15%, your result suddenly looks very different.

    A common trap I see new investors fall into is celebrating any positive ROI without a second thought. They forget about opportunity cost. If you earned 5% on a low-risk bond while the broader stock market jumped 20%, you didn't necessarily make a "good" investment—you just made a profitable one. There's a big difference.

    Comparing Against Asset Classes And Market Conditions

    Different investments come with different expectations. It’s just the nature of the game. You wouldn't expect a sleepy government bond to deliver the same returns as a high-growth tech stock, so you shouldn't judge them with the same yardstick. The overall market environment is a huge piece of the puzzle, too.

    Look at the historical numbers. In 2019, U.S. large-cap stocks, which you can track with the S&P 500, shot up an incredible 31.49%. That same year, international stocks (using the MSCI EAFE Index as a proxy) gained only 18.88%. The next year, even with a major downturn, the S&P 500 still pulled off an 18.40% gain, which shows just how resilient—and volatile—some markets can be. For more great data, you can check out the historical returns on different asset classes from Novel Investor.

    These figures drive home why context is everything. Nailing a 15% return when the market is flying high at 30% feels a whole lot different than getting that same 15% when the market is completely flat. One feels like a missed opportunity, the other feels like a genius move.

    Key Contextual Factors to Consider

    When you’re looking at your ROI, you need to ask some critical questions to get the full picture. I always run through this mental checklist:

    • What was the time horizon? A 20% return in one month is legendary. That same 20% over ten years? Not so much.
    • What was the risk level? Did you have to sweat bullets for that return? High-risk ventures should come with the potential for much higher rewards to make them worthwhile.
    • How did it stack up to a benchmark? If you bought a stock, measure its performance against an index like the S&P 500. For real estate, look at local market trends.
    • What were the market conditions? Bagging any positive return during a recession is a massive win. Context matters.

    By layering these factors over your initial calculation, you move from a flat number to a rich, three-dimensional view of your financial performance. That's how you really learn and get better.

    Beyond the Basics with Advanced ROI Metrics

    The standard return on investment formula is a fantastic starting point. It gives you a quick, clean percentage. But in the real world, things get messy.

    What happens when you need to compare two investments with completely different lifespans? A 20% return over six months is a world away from a 20% return over five years. This is where the basic ROI formula falls short—and can actually be pretty misleading if you're not careful.

    To make fair, apples-to-apples comparisons, you have to annualize your returns. This just means converting the total return into its equivalent yearly rate. It levels the playing field, regardless of how long you held the investment, and is an essential step for anyone trying to understand true performance.

    Annualized ROI and CAGR

    The two most common tools for this job are Annualized ROI and the Compound Annual Growth Rate (CAGR). They're similar, but they have slightly different jobs.

    • Annualized ROI is simpler and works great for investments held for less than a year.
    • CAGR is more precise for multi-year investments because it accounts for the magic of compounding.

    Let's walk through a quick example. Say you invest $10,000 and it grows to $12,000 in just six months. The basic ROI is a solid 20%. But to compare it to a stock you've held for years, you need to annualize it. The Annualized ROI comes out to be roughly 40%, showing its impressive short-term performance.

    The core idea here is that time is a critical, yet often overlooked, variable in the ROI equation. Without annualizing, you're comparing apples to oranges, which can lead you to favor a less profitable investment simply because its total return looks bigger on paper.

    Understanding this concept is fundamental, especially for long-term investing. The historical average annual return of the U.S. stock market (S&P 500) has hovered around 8.0% since 1957. If an investment of yours doubled over 10 years, its basic ROI is 100%. That sounds great, but its annualized return (calculated with CAGR) is only about 7.18% per year. This shows how compounding works its magic over time, generating substantial growth from seemingly modest annual gains. You can dive deeper into these historical market returns on the NYU Stern website.

    As you get more serious about evaluating your investments, you'll want to move beyond basic ROI. Getting a solid grasp of other financial metrics is essential. We cover many of these in our guide on Mastering Excel Financial Formulas. Using these advanced metrics gives you a far more accurate picture of how your portfolio is really performing over time.

    Common Mistakes to Avoid When Calculating ROI

    Knowing the ROI formula is one thing. Actually getting a number you can trust is another thing entirely.

    It’s surprisingly easy to get the math right but the entire analysis wrong. I’ve seen it happen countless times—people end up making poor financial decisions based on a dangerously misleading ROI figure. Let's walk through the traps I see most often so you can sidestep them.

    One of the biggest pitfalls is forgetting hidden costs. People get laser-focused on the initial purchase price and what they hope to sell for, but they completely gloss over all the expenses that pile up in between.

    Think about it: maintenance on a rental property, annual subscription fees for a business tool, or the taxes you'll owe on capital gains. These aren't minor details; they can drastically slash your actual net profit. If you don't account for every single dollar spent, you're just looking at an inflated, fantasy ROI.

    Another classic error is ignoring the time value of money. A 15% return you make in one year is a whole lot better than a 15% return that took you five years to get. The basic ROI formula doesn't care about the difference, which is a major flaw. For any serious comparison between two investments, you absolutely have to look at annualized returns. It’s the only way to see which one truly performed better on a year-by-year basis.

    A critical mistake is using ROI as your only decision-making metric. It tells you about profitability but says nothing about risk or cash flow. An investment might show a high potential ROI but be so volatile it could wipe you out, or it might tie up all your money and leave you unable to pay bills.

    Looking Beyond the Simple Percentage

    Relying solely on ROI without peeking at other financial health indicators is a recipe for trouble. For example, a project can have a fantastic ROI on paper but be a total cash drain on the business.

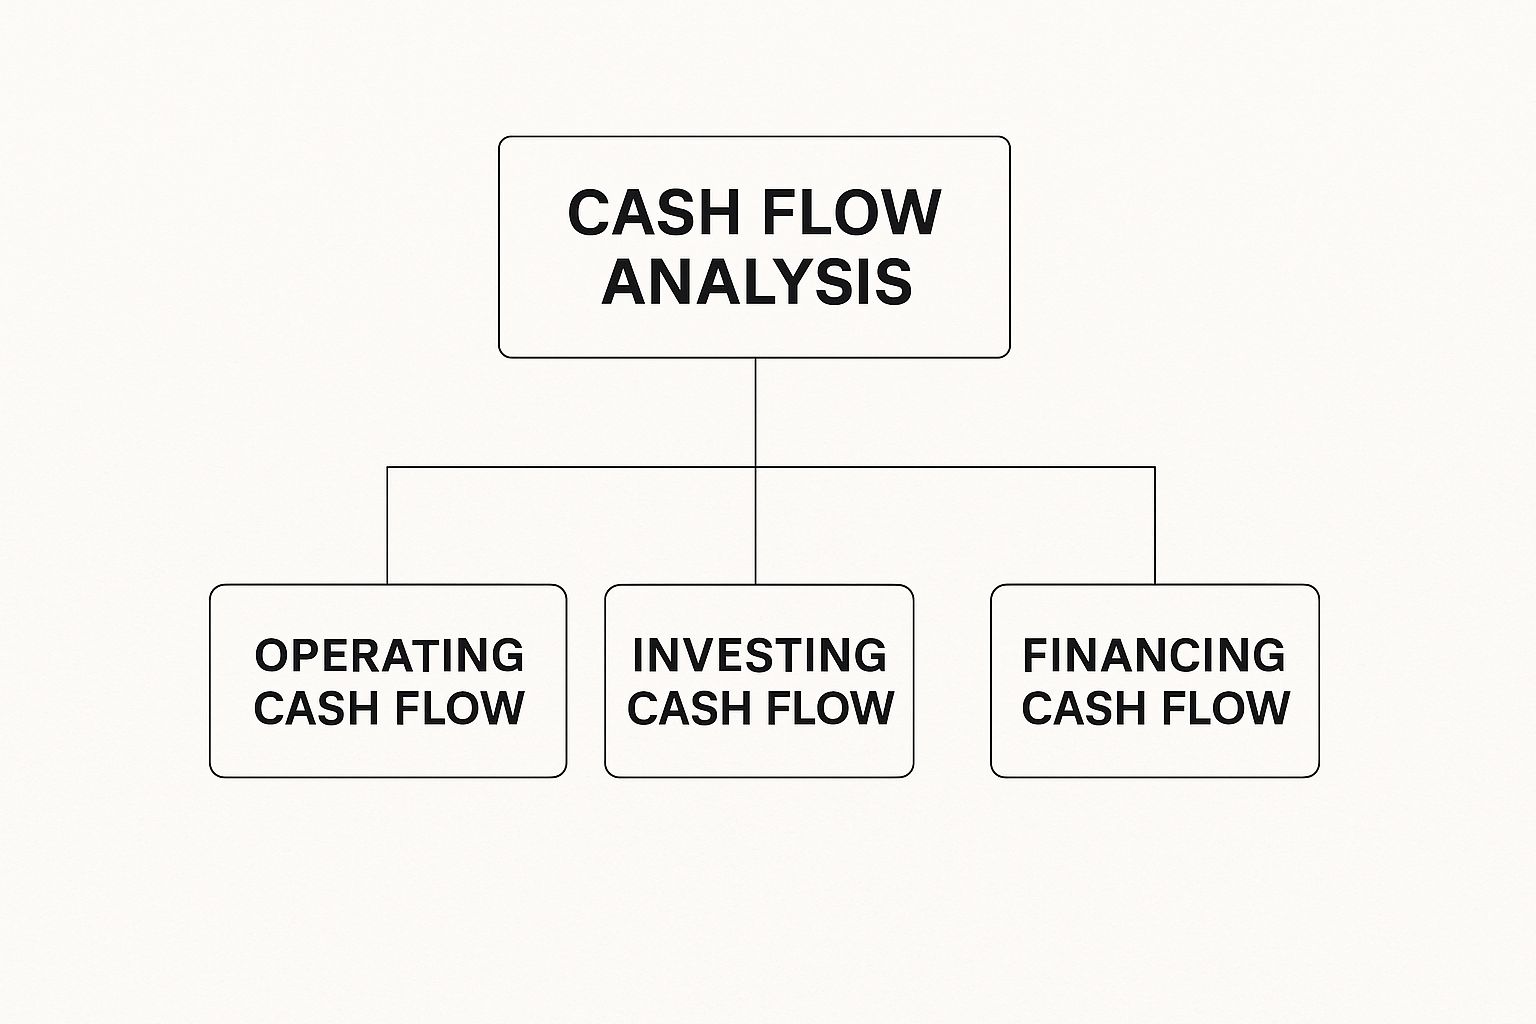
    To get the full picture, you have to look at other metrics. For anyone managing a business or a complex asset, learning what is cash flow analysis is an essential next step. It provides a much-needed dose of reality.

    To make sure your analysis is robust and honest, always double-check for these common traps:

    • Incomplete Cost Accounting: Have you really included all the fees, taxes, maintenance, and operational costs? Be ruthless here.
    • Ignoring Time Horizon: Are you comparing investments over similar timeframes? If not, have you annualized the returns for an apples-to-apples view?
    • Risk Negligence: How much risk did you take on to get that return? A high return from a safe bet is worlds apart from a high return on a speculative gamble.
    • Overlooking Benchmarks: How does your ROI stack up against the market? Compare it to a relevant index (like the S&P 500) or the industry average.

    By consciously sidestepping these mistakes, you move beyond a simple, and often flawed, calculation. You empower yourself to conduct a truly insightful investment analysis that leads to smarter decisions.

    Common Questions About ROI (And Straightforward Answers)

    Once you get the hang of the ROI formula, the real questions start popping up. It's one thing to do the math, but it's another to actually apply it with confidence to your own investments.

    Let's dig into some of the most common questions I hear.

    What Is a Good ROI, Anyway?

    This is the million-dollar question, and the honest-to-goodness answer is: it depends. There’s no magic number. A "good" ROI is completely relative to the investment's risk, the industry you're in, and what you're personally trying to achieve.

    That said, we can look at some general benchmarks to get a sense of the landscape:

    • Stocks: The S&P 500 has historically returned around 10% annually over the very long term. If you're beating that, you're generally doing quite well.
    • Real Estate: This varies wildly by location, but a lot of rental property investors I know shoot for an 8-12% cash-on-cash return.
    • Business Projects: Inside a company, an internal project often needs to clear a much higher bar. They're often looking for an ROI that blows their cost of capital out of the water, sometimes 15% or more.

    How Is ROI Different from ROE or ROA?

    Think of ROI as your trusty, all-purpose measuring stick. It’s a simple, direct way to see what you got back versus what you put in.

    Return on Equity (ROE) and Return on Assets (ROA), on the other hand, are more specialized tools you'll find in a corporate finance analyst's toolkit. They’re used to dissect a company's performance by looking at its financial statements.

    ROE tells you how effectively a company is using shareholder money to generate profits. ROA measures how much profit the company squeezes out of every dollar of its assets. They're powerful for analyzing big corporations but aren't really built for sizing up your personal investment portfolio.

    Can ROI Be Negative?

    Absolutely. And it happens more than you'd think. A negative ROI just means you lost money—the final value of your investment was less than what it cost you to get in.

    Let's walk through a painful, but realistic, example. You buy a stock for $1,000 and pay a $10 commission. Your total cost is $1,010. The stock then takes a nosedive, and you decide to cut your losses and sell it for $700, paying another $10 commission on the way out. Your net proceeds from the sale are only $690.

    Your net profit is actually a net loss of $320 ($690 – $1,010).

    Plugging that into the formula, it looks like this:
    (-$320 Loss / $1,010 Cost) x 100 = -31.7% ROI

    Seeing that negative number isn't fun, but it’s a crystal-clear sign that the investment didn't pan out.


    Ready to build your investing knowledge with real-world examples and transparent analysis? Subscribe to the free Investogy newsletter and follow a real-money portfolio in a quick 3-minute read. Join us at https://investogy.com.

  • 10 Best Long Term Investment Strategies for 2025

    10 Best Long Term Investment Strategies for 2025

    Building lasting wealth isn’t about chasing market fads or timing every dip and peak. It's about implementing disciplined, time-tested approaches that leverage the power of compounding and market growth over decades. Success in this arena is less about finding a single "perfect" stock and more about adopting a resilient, strategic mindset. The goal is to build a portfolio that can weather economic storms and consistently grow, securing your financial independence for years to come.

    This comprehensive guide moves beyond generic advice to explore the 10 best long term investment strategies that have consistently helped investors achieve their goals. We will break down the specific mechanics, benefits, and potential drawbacks of each proven method, from the foundational principles of Buy and Hold to the nuanced approaches of Value and Growth Investing. You will find actionable steps and practical examples to help you implement these strategies effectively.

    Whether you are just beginning your investment journey or looking to refine your existing portfolio, this article provides a robust framework for sustainable wealth creation. We will cover:

    • Core Philosophies: Including Dollar-Cost Averaging and Index Fund Investing.
    • Income and Growth Tactics: Such as Dividend Growth and Growth Stock Investing.
    • Portfolio Management: Asset Allocation, Rebalancing, and International Diversification.
    • Specialized Approaches: Including Real Estate and Tax-Advantaged Retirement accounts.

    By understanding these powerful concepts, you can construct a personalized plan tailored to your risk tolerance and financial aspirations, putting you on a clear path toward a more secure future.

    1. Buy and Hold Strategy

    The Buy and Hold strategy is a cornerstone of long-term wealth creation and one of the most straightforward and effective approaches for patient investors. This passive technique involves purchasing securities like stocks or funds and holding onto them for an extended period, often spanning years or even decades. The core philosophy is to ignore short-term market noise and volatility, trusting that the overall market trend is upward over the long haul.

    This method’s power lies in its simplicity and its ability to harness compound growth. It is championed by legendary investors like Warren Buffett, whose company Berkshire Hathaway famously holds stakes in robust companies like Apple and Coca-Cola for the long term. Similarly, an investor who purchased Amazon stock during its 1997 IPO and held it would have seen life-changing returns, illustrating the potential of this strategy when applied to high-quality assets.

    Buy and Hold Strategy

    Why It’s a Top Long-Term Investment Strategy

    Buy and Hold earns its place by minimizing two of the biggest drags on portfolio performance: fees and emotions. By trading infrequently, you drastically reduce transaction costs and avoid the common pitfall of panic-selling during market downturns or greedily buying at market peaks. This disciplined approach keeps you invested, allowing your assets to recover from downturns and capture subsequent growth. It’s a strategy built on patience rather than timing.

    How to Implement a Buy and Hold Strategy

    Implementing this strategy effectively requires a thoughtful, front-loaded research process. The goal isn't to buy and forget, but to buy and monitor with discipline.

    • Select Quality Assets: Focus on fundamentally strong companies with durable competitive advantages (often called "moats"), consistent earnings, and solid leadership. For diversification, low-cost index funds or ETFs that track broad market indices like the S&P 500 are excellent choices.
    • Automate and Reinvest: Set up automatic investments to consistently buy shares over time (dollar-cost averaging). Crucially, enable automatic dividend reinvestment (DRIP) to purchase more shares with your earnings, accelerating compound growth.
    • Review, Don't React: Schedule an annual or semi-annual portfolio review. The purpose is not to time the market but to check if the fundamental reasons you invested in a company still hold true. Avoid making changes based on short-term news or price swings.

    2. Dollar-Cost Averaging (DCA)

    Dollar-Cost Averaging (DCA) is a disciplined investment technique that removes market timing from the equation. Instead of trying to find the "perfect" moment to invest a lump sum, you commit to investing a fixed amount of money at regular intervals, such as weekly or monthly. This methodical approach ensures you're consistently active in the market, regardless of whether it's soaring to new highs or experiencing a downturn.

    The primary advantage of DCA is that it smooths out your average purchase price over time. When market prices are low, your fixed investment buys more shares; when prices are high, it buys fewer. This mechanism is automatically built into many retirement plans, like a 401(k), where contributions are deducted from each paycheck. It’s a powerful, automated way to build wealth systematically without the stress of market volatility. You can see how this principle extends to various asset classes by exploring further insights on the power of Dollar-Cost Averaging in precious metals.

    Dollar-Cost Averaging (DCA)

    Why It’s a Top Long-Term Investment Strategy

    Dollar-Cost Averaging excels as one of the best long term investment strategies because it systematically manages risk and removes emotion from decision-making. By committing to a predetermined schedule, investors avoid the twin traps of fear-driven inaction during market dips and greed-fueled overinvestment at market peaks. It turns volatility into an advantage by allowing you to acquire more assets when they are cheaper, potentially lowering your overall cost basis and enhancing long-term returns.

    How to Implement a Dollar-Cost Averaging Strategy

    Setting up a DCA plan is straightforward and can be almost entirely automated, making it one of the most accessible strategies for investors at any level.

    • Automate Your Investments: The most effective way to use DCA is to set up automatic transfers from your bank account to your brokerage account. Most platforms allow you to schedule recurring investments into specific stocks, ETFs, or mutual funds.
    • Choose Appropriate Assets: This strategy works exceptionally well with broad market index funds or ETFs, like those tracking the S&P 500 or a total stock market index. These assets provide instant diversification and are ideal for accumulating over time.
    • Stay the Course: The key to success with DCA is consistency. You must stick to your investment schedule regardless of market news or short-term performance. The strategy's benefits are only realized over long periods of consistent investing.
    • Increase Contributions Over Time: As your income grows, make it a point to increase your regular contribution amount. This small adjustment can significantly accelerate your portfolio's growth over the long run.

    3. Index Fund Investing

    Index Fund Investing is a passive strategy that epitomizes the "don't look for the needle, buy the haystack" philosophy. Instead of picking individual stocks, this approach involves purchasing index funds or Exchange Traded Funds (ETFs) that aim to replicate the performance of a major market index, such as the S&P 500 or the total stock market. This provides immediate, broad diversification at an exceptionally low cost.

    This strategy was pioneered and popularized by Vanguard founder John Bogle, who argued that consistently beating the market is nearly impossible for most investors and that simply matching market returns is a winning formula. Warren Buffett has famously echoed this sentiment, advising that a low-cost S&P 500 index fund is the best investment most people can make. Investing in a fund like the Vanguard Total Stock Market Index Fund (VTSAX) gives you a small piece of thousands of U.S. companies in a single transaction.

    Why It’s a Top Long-Term Investment Strategy

    Index Fund Investing is one of the best long term investment strategies because it offers market returns with minimal effort and cost. It eliminates the risk of underperforming the market due to poor stock selection and sidesteps the high management fees that often erode the returns of actively managed funds. This simplicity and low-cost structure allow investors to reliably capture the market's growth over time, making it a powerful tool for wealth accumulation.

    How to Implement an Index Fund Investing Strategy

    Putting this powerful strategy into practice is straightforward and focuses on consistency and cost-efficiency. The key is to select the right funds and maintain a disciplined, long-term perspective.

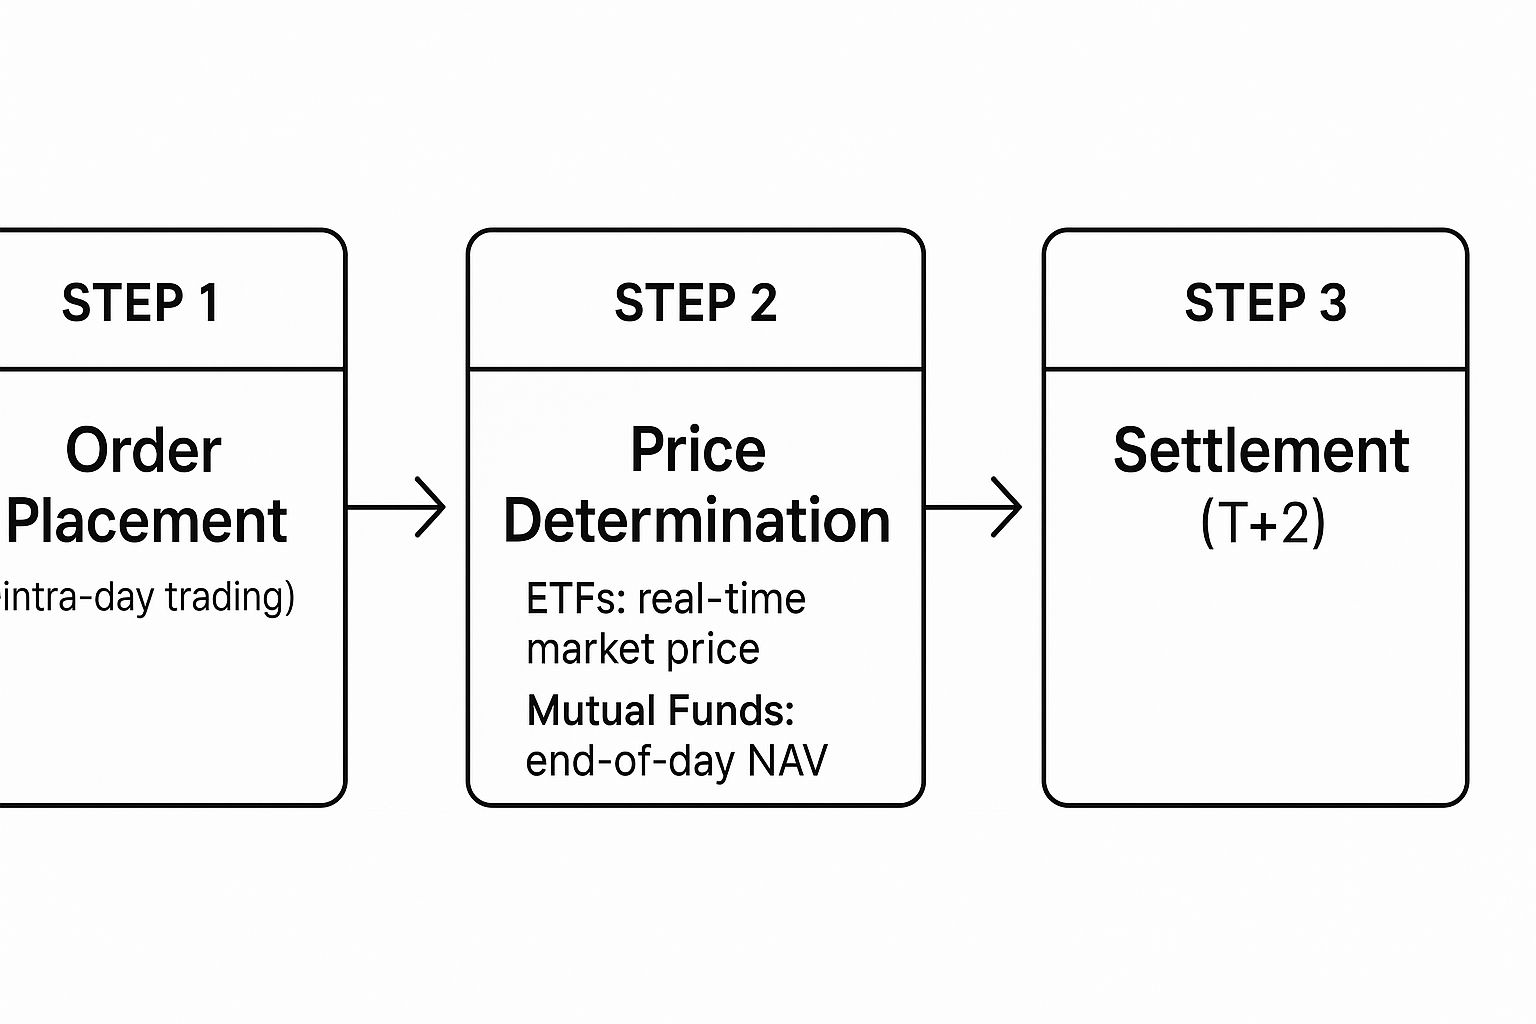
    • Choose Low-Cost, Broad-Based Funds: Focus on funds with very low expense ratios, ideally below 0.10%. Excellent options include the Vanguard S&P 500 ETF (VOO) or the iShares Core S&P 500 ETF (IVV). For even broader diversification, consider total market funds like VTSAX or international funds like the iShares Core MSCI Total International Stock ETF (IXUS). You can learn more about the differences between ETFs and mutual funds on investogy.com.
    • Automate Your Contributions: Treat your investments like a recurring bill. Set up automatic transfers from your bank account to your brokerage account on a regular schedule (e.g., weekly or bi-weekly). This leverages dollar-cost averaging, reducing risk by buying shares at various price points.
    • Rebalance Periodically: Once a year, review your portfolio's asset allocation. If your target was 80% stocks and 20% bonds, and market movements shifted it to 90/10, sell some of your outperforming assets and buy more of the underperforming ones to return to your original target. This enforces a "buy low, sell high" discipline.

    4. Dividend Growth Investing

    Dividend Growth Investing is a powerful strategy focused on building a portfolio of companies that not only pay dividends but have a consistent track record of increasing those payouts year after year. This approach offers a dual benefit: it generates a reliable and growing stream of passive income while also allowing for capital appreciation as the underlying companies thrive. The core philosophy is that a company able to regularly increase its dividend is likely financially healthy, well-managed, and growing its earnings.

    This strategy is epitomized by the "Dividend Aristocrats," S&P 500 companies that have increased their dividends for at least 25 consecutive years, such as Coca-Cola and Johnson & Johnson. An even more elite group, the "Dividend Kings," like Procter & Gamble, have done so for 50-plus years. This focus on high-quality, dividend-raising businesses makes it one of the best long term investment strategies for investors seeking both income and growth.

    Dividend Growth Investing

    Why It’s a Top Long-Term Investment Strategy

    Dividend Growth Investing secures its spot by creating a compounding machine that works for you in two ways. First, the rising dividend payments provide an income stream that can outpace inflation, protecting your purchasing power over time. Second, reinvesting these dividends buys more shares, which in turn generate more dividends, creating a powerful snowball effect on your wealth. This focus on company quality and shareholder returns instills discipline and shifts the focus from volatile stock prices to predictable income growth.

    How to Implement a Dividend Growth Investing Strategy

    A successful dividend growth strategy requires diligent research to identify durable companies capable of sustained dividend increases.

    • Analyze Key Metrics: Look beyond just the current dividend yield. Focus on the dividend growth rate to see how quickly your income will increase. Scrutinize the company's payout ratio (the percentage of earnings paid as dividends) to ensure the dividend is sustainable and has room to grow.
    • Prioritize Quality and "Moats": Invest in companies with strong competitive advantages, or "moats," that protect their market share and profitability. These are the businesses most likely to continue growing earnings and dividends for decades.
    • Reinvest for Compounding: Use a Dividend Reinvestment Plan (DRIP) to automatically use your dividend payments to purchase more shares of the company. This is best done in tax-advantaged accounts like an IRA to avoid taxes on the dividends, maximizing the power of compounding.
    • Diversify Your Income Streams: Avoid concentrating in just one or two sectors. Build a diversified portfolio of dividend-paying companies across different industries to mitigate risk and ensure a more stable overall income flow.

    5. Asset Allocation and Rebalancing

    Asset Allocation and Rebalancing is a foundational discipline for managing risk and optimizing returns over the long term. This strategic approach involves dividing your investment portfolio among different asset categories, such as stocks, bonds, and real estate, based on your specific risk tolerance, time horizon, and financial goals. The core principle, rooted in Modern Portfolio Theory pioneered by Harry Markowitz, is that different asset classes perform differently under various market conditions, and combining them can smooth out overall portfolio volatility.

    This strategy is not a one-time setup; it requires periodic maintenance through rebalancing. A classic example is the 60/40 portfolio (60% stocks, 40% bonds), which provides a balance of growth potential and stability. Similarly, Ray Dalio's All Weather portfolio is designed to perform reasonably well across all economic environments. The disciplined act of rebalancing forces you to sell assets that have performed well (selling high) and buy those that have underperformed (buying low), a counterintuitive but highly effective practice.

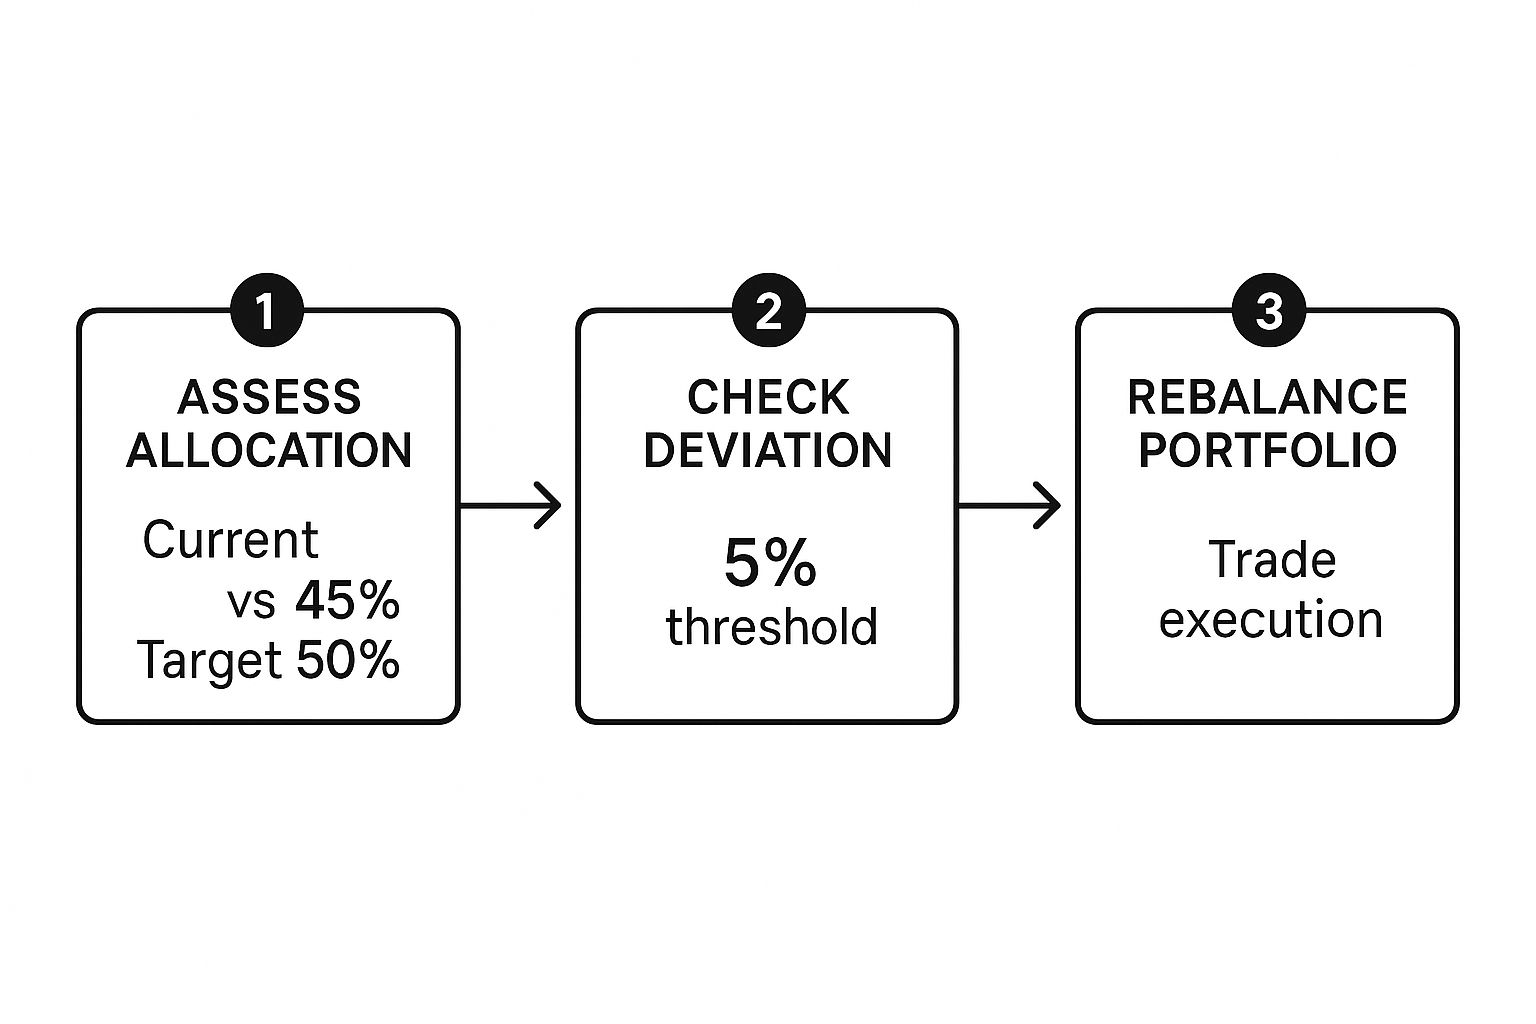
    This infographic provides a quick reference for the core components of implementing this powerful long-term investment strategy.

    These guidelines help investors maintain their desired risk profile by systematically realigning their holdings.

    Why It’s a Top Long-Term Investment Strategy

    Asset allocation earns its spot because it is the single most significant determinant of a portfolio's return and volatility, far more than individual security selection. It provides a systematic framework for managing risk and enforcing discipline. Instead of reacting emotionally to market swings, you follow a pre-determined plan. Once you've established your asset allocation, knowing how to effectively maintain your desired risk and return profile by learning to rebalance your portfolio like a pro is crucial. This prevents your portfolio from becoming overly concentrated in one high-flying asset class, which could expose you to unnecessary risk.

    How to Implement an Asset Allocation and Rebalancing Strategy

    Effective implementation hinges on defining your targets and consistently adhering to your rebalancing schedule. It’s a proactive way to manage your portfolio’s health.

    • Determine Your Target Allocation: Base your mix on your goals and risk tolerance. A common rule of thumb is the "110 – age" rule, where you subtract your age from 110 to find the percentage you should allocate to stocks. Consider a simple three-fund portfolio (U.S. stocks, international stocks, and bonds) for broad diversification.
    • Set a Rebalancing Schedule: Decide whether to rebalance based on time (e.g., annually) or a percentage threshold (e.g., when any asset class drifts more than 5-10% from its target). Using new contributions to buy underperforming assets is a tax-efficient way to rebalance.
    • Automate with Target-Date Funds: For a hands-off approach, consider target-date funds. These funds automatically adjust their asset allocation to become more conservative as the target retirement date approaches, handling all the rebalancing for you. To learn more, see this guide on how to build an investment portfolio.

    6. Growth Stock Investing

    Growth Stock Investing is a dynamic strategy centered on identifying and investing in companies poised to grow at a rate significantly faster than the overall market. Unlike value investors who seek undervalued assets, growth investors prioritize companies with strong forward-looking potential, often in innovative and expanding sectors. The core belief is that these companies' future earnings will be so substantial that their current high valuations are justified.

    This approach is exemplified by the meteoric rises of companies that defined their industries. Think of Amazon's evolution from an online bookstore to a global e-commerce and cloud computing behemoth, or Tesla's disruption of the automotive industry with electric vehicles. Investors who recognized their potential early, like T. Rowe Price or more recently Cathie Wood, captured immense returns by focusing on future expansion rather than present-day metrics. This strategy is one of the best long term investment strategies for those with a higher risk tolerance and a focus on capital appreciation.

    Why It’s a Top Long-Term Investment Strategy

    Growth investing earns its spot by offering the potential for extraordinary capital gains. While the broader market grows steadily, a portfolio of well-chosen growth stocks can deliver explosive returns that significantly outperform major indices. This strategy taps directly into innovation, technological disruption, and shifting consumer trends, allowing investors to participate in the success stories of tomorrow. It’s an forward-looking approach that rewards foresight and deep industry analysis.

    How to Implement a Growth Stock Investing Strategy

    Effective growth investing requires diligent research to separate temporary hype from sustainable, long-term expansion.

    • Analyze Growth Drivers: Focus on companies with robust revenue and earnings growth, ideally accelerating over time. Look for a large total addressable market (TAM) that provides a long runway for expansion and a sustainable competitive advantage that protects its market share.
    • Evaluate Leadership and Vision: The quality of the management team is paramount. Seek visionary leaders like Peter Lynch would, who have a clear plan for innovation and a proven track record of executing on their goals. Their ability to navigate challenges and capitalize on new opportunities is crucial.
    • Diversify and Manage Valuation: Even with great companies, it's possible to overpay. Be mindful of valuation metrics like the price-to-sales (P/S) ratio, especially for young companies. Diversify across different growth sectors (e.g., technology, healthcare, clean energy) and consider growth-focused ETFs like the Vanguard Growth ETF (VUG) to mitigate single-stock risk.

    7. Value Investing

    Value investing is a disciplined investment philosophy that involves buying stocks for less than their calculated intrinsic worth. It is a methodical search for diamonds in the rough: fundamentally strong companies that the market has temporarily and unjustly undervalued. Value investors act like business analysts, not market speculators, believing that while market sentiment can be irrational in the short term, a company's true value will eventually be recognized.

    This strategy was pioneered by Benjamin Graham and famously mastered by his student, Warren Buffett. A classic example is Buffett's investment in American Express after the "Salad Oil Scandal" of 1963, when the market panicked and dumped the stock. Buffett's research showed the company's underlying business was sound, and his investment yielded enormous returns. More recently, savvy investors who bought sound bank stocks during the 2008-2009 financial crisis or energy stocks during the 2020 pandemic downturn reaped significant rewards when those sectors recovered.

    Why It’s a Top Long-Term Investment Strategy

    Value investing is one of the best long term investment strategies because it is built around a powerful concept: the margin of safety. By purchasing assets for significantly less than their intrinsic value, you create a buffer against unforeseen business problems or inaccurate calculations. This focus on downside protection, combined with the potential for upside as the market corrects its pricing, provides a robust framework for consistent, risk-adjusted returns over time. It forces discipline and patience, preventing investors from chasing hype.

    How to Implement a Value Investing Strategy

    Executing a value investing strategy requires diligence, analytical skill, and an unwavering contrarian mindset. It's about finding quality on sale.

    • Master Valuation: Learn to calculate a company's intrinsic value. This involves analyzing financial statements, understanding cash flow, and applying various models. It’s crucial to know what a business is truly worth before you can determine if it's cheap. You can learn more about these techniques and stock valuation methods on Investogy.com.
    • Hunt for Bargains: Screen for stocks with low price-to-earnings (P/E) or price-to-book (P/B) ratios, but don't stop there. Investigate why a stock is cheap. Is it a temporary industry headwind or a fundamental flaw in the business? The goal is to find temporary problems, not permanent ones.
    • Demand a Margin of Safety: Only buy a stock when it trades at a significant discount to your calculated intrinsic value. Benjamin Graham often looked for a 33% to 50% discount. This gap is your protection against error and bad luck.
    • Be Patient: Once you buy, you must be prepared to wait. It can take months, or even years, for the market to recognize the value you've identified. Avoid "value traps," which are stocks in terminal decline that appear cheap but will only get cheaper.

    8. Real Estate Investment (REITs and Direct Ownership)

    Real estate is a classic long-term investment strategy that allows individuals to build wealth through tangible assets. This approach involves either directly owning physical properties or investing in Real Estate Investment Trusts (REITs), which are companies that own and operate income-producing real estate. The core appeal is generating consistent cash flow through rental income and benefiting from property value appreciation over time, offering powerful diversification away from traditional stocks and bonds.

    This strategy has created fortunes for investors like Sam Zell and is championed by financial educators like Robert Kiyosaki. An investor might purchase a residential duplex to generate rental income, or for a more passive approach, invest in a REIT like Realty Income (O), which owns commercial properties and pays monthly dividends. Similarly, ETFs like the Vanguard Real Estate ETF (VNQ) provide instant diversification across hundreds of real estate assets with a single purchase.

    Why It’s a Top Long-Term Investment Strategy

    Real estate earns its place by offering a unique combination of income, appreciation, and tax advantages. Unlike stocks, it's a physical asset you can see and touch, which provides a psychological sense of security for many investors. Rental income offers a steady cash flow stream that can grow with inflation, while property values historically appreciate over the long term. Moreover, direct ownership comes with significant tax benefits, including deductions for mortgage interest, property taxes, and depreciation.

    How to Implement a Real Estate Investment Strategy

    Implementing a real estate strategy depends on whether you choose the hands-on or hands-off route. Both require careful due diligence to be successful.

    • Start with REITs for Simplicity: For beginners, REITs are the easiest entry point. They are highly liquid, require minimal capital, and can be held in tax-advantaged accounts like an IRA. Analyze REITs based on their property focus (e.g., residential, industrial, healthcare) and dividend history.
    • Research Local Markets for Direct Ownership: If buying property directly, thoroughly research local markets. Look for areas with strong job growth, population increases, and favorable landlord-tenant laws. Factor in all costs, including maintenance, property management, insurance, and taxes, not just the mortgage.
    • Explore Crowdfunding Platforms: A modern hybrid approach involves using real estate crowdfunding platforms like Fundrise. These platforms allow you to pool your money with other investors to invest in a portfolio of real estate projects, offering diversification with lower capital than direct ownership.

    9. Tax-Advantaged Retirement Investing

    Tax-Advantaged Retirement Investing is a strategy focused on using specialized accounts like 401(k)s and IRAs to accelerate wealth accumulation. This powerful approach leverages government-provided tax benefits, such as tax-deferred or completely tax-free growth, to allow your investments to compound more efficiently over time. It's less about which specific stocks you pick and more about the account in which you hold them.

    The core principle is to shield your investment gains from annual taxation. For example, a high-earning professional who maxes out their 401(k) contributions not only reduces their current taxable income but also allows their investments to grow without being diminished by capital gains taxes each year. Similarly, a self-employed individual using a SEP-IRA can make significant pre-tax contributions, supercharging their retirement savings. This method is a foundational element of many of the best long term investment strategies.

    Why It’s a Top Long-Term Investment Strategy

    This strategy earns its spot by directly boosting your net returns through tax optimization. The government is essentially offering a subsidy to save for the future, and ignoring it is like leaving free money on the table. Over decades, the difference between investing in a taxable brokerage account versus a tax-advantaged one can amount to hundreds of thousands of dollars due to the unimpeded power of compounding.

    Furthermore, it instills discipline. The contribution limits and withdrawal rules of these accounts encourage a long-term mindset, preventing you from dipping into your nest egg for non-emergency reasons. For those committed to building long-term wealth, strategically planning for minimizing taxes in retirement is as vital as the investment choices themselves.

    How to Implement a Tax-Advantaged Retirement Investing Strategy

    Putting this into practice involves prioritizing these special accounts in your investment plan.

    • Capture the Full Match: If your employer offers a 401(k) match, contribute at least enough to receive the full amount. This is an immediate, guaranteed return on your investment.
    • Choose Your IRA Wisely: Decide between a Traditional IRA (tax deduction now, pay taxes in retirement) and a Roth IRA (post-tax contributions, tax-free withdrawals) based on your expected future income and tax rates. High earners can explore a Backdoor Roth IRA.
    • Leverage Health Savings Accounts (HSAs): If eligible, use an HSA as a powerful retirement tool. It offers a unique triple tax advantage: contributions are tax-deductible, growth is tax-free, and qualified medical withdrawals are tax-free.
    • Automate and Escalate: Set up automatic contributions from your paycheck. Whenever you get a salary increase, immediately increase your contribution percentage to avoid lifestyle inflation and accelerate your savings.

    10. International Diversification

    International Diversification is a strategy that moves beyond domestic borders, allocating a portion of a portfolio to companies in both developed and emerging economies. This approach is built on the fundamental principle that no single country's economy can lead forever. By investing globally, you reduce your reliance on the economic fortunes of your home country and tap into growth opportunities wherever they may arise.

    This strategy is a core component of modern portfolio theory and is championed by institutional investors and thought leaders like David Swensen, the late CIO of Yale's endowment. Instead of concentrating all risk in the U.S. market, for example, an investor might hold a fund like the Vanguard Total International Stock Index Fund (VTIAX) to gain exposure to thousands of companies across Europe and Asia, from established giants like Nestlé and Toyota to dynamic firms in emerging markets. This global reach provides a crucial buffer when one region's market is struggling while another is thriving.

    Why It’s a Top Long-Term Investment Strategy

    International Diversification earns its place as one of the best long term investment strategies by providing powerful risk reduction and enhanced return potential. Different countries and regions experience economic cycles at different times. When the U.S. market is flat or in a downturn, international markets might be booming, and vice versa. This lack of perfect correlation helps smooth out your portfolio's overall returns and can protect against country-specific risks like political instability, regulatory changes, or a localized recession.

    How to Implement an International Diversification Strategy

    Effectively adding global exposure requires a deliberate allocation that complements your domestic holdings. It’s about balance, not just adding random foreign stocks.

    • Determine Your Allocation: Financial advisors often recommend allocating between 20% and 40% of your total stock portfolio to international assets. The exact percentage depends on your risk tolerance and long-term goals.
    • Use Broad-Market Funds: The easiest implementation is through low-cost index funds or ETFs. Look for funds that cover both developed markets (like Europe and Japan) and emerging markets (like China, India, and Brazil) to ensure comprehensive diversification. The iShares MSCI Emerging Markets ETF (EEM) is one example focused on this segment.
    • Consider Currency Impact: Fluctuations in currency exchange rates can impact your returns. For added stability, especially for more conservative investors, you can consider currency-hedged funds that aim to minimize the effect of these fluctuations.
    • Rebalance Regularly: Since international and domestic markets perform differently, your target allocation will drift over time. Review your portfolio annually and rebalance back to your desired percentages to maintain your strategic risk profile.

    Top 10 Long-Term Investment Strategies Comparison

    Strategy Implementation Complexity 🔄 Resource Requirements ⚡ Expected Outcomes 📊 Ideal Use Cases 💡 Key Advantages ⭐
    Buy and Hold Strategy Low 🔄 Low ⚡ Long-term capital growth, moderate risk 📊 Investors seeking minimal active management, long horizons Tax efficiency, low fees, less emotional trading ⭐
    Dollar-Cost Averaging (DCA) Low to Moderate 🔄 Moderate ⚡ Reduced volatility impact, disciplined investing 📊 Beginners, limited capital, volatile markets Smooths market timing, builds disciplined habits ⭐
    Index Fund Investing Low 🔄 Low ⚡ Market returns with broad diversification 📊 Passive investors, low-cost exposure to markets Extremely low fees, instant diversification ⭐
    Dividend Growth Investing Moderate 🔄 Moderate ⚡ Growing income and capital appreciation 📊 Income-focused investors with long-term horizons Inflation-beating dividends, lower volatility ⭐
    Asset Allocation & Rebalancing Moderate to High 🔄 Moderate to High ⚡ Risk management and diversified returns 📊 Investors seeking balanced portfolios and risk control Reduces risk, enforces discipline ⭐
    Growth Stock Investing High 🔄 High ⚡ High return potential with elevated risk 📊 Aggressive investors targeting innovation and growth High returns in bull markets, exposure to innovation ⭐
    Value Investing Moderate 🔄 Moderate ⚡ Capital preservation with margin of safety 📊 Contrarian investors seeking undervalued stocks Lower downside risk, proven long-term results ⭐
    Real Estate Investment (REITs and Direct Ownership) Moderate 🔄 Moderate to High ⚡ Income plus appreciation, inflation hedge 📊 Diversification beyond stocks, income seekers Inflation hedge, regular income, diversification ⭐
    Tax-Advantaged Retirement Investing Low to Moderate 🔄 Moderate ⚡ Tax-efficient long-term wealth growth 📊 Retirement savers maximizing tax benefits Tax savings, employer match, forced savings ⭐
    International Diversification Moderate 🔄 Moderate ⚡ Reduced country risk, access to global growth 📊 Investors seeking geographic risk reduction Diversifies risks, global growth exposure ⭐

    Putting It All Together: Crafting Your Personalized Investment Blueprint

    Navigating the world of long-term investing can feel like learning a new language, filled with unique terms and complex concepts. Throughout this guide, we have explored ten distinct yet powerful approaches, moving from foundational principles like Buy and Hold to more nuanced tactics such as Value Investing and International Diversification. We’ve broken down each one, not as an isolated island, but as a potential component in your financial toolkit.

    The central theme connecting all these methods is that the best long term investment strategies are rarely used in isolation. True financial mastery comes from synthesis: combining these powerful ideas into a cohesive, personalized plan that aligns with your specific life goals, your comfort with risk, and your unique investment horizon. A recent college graduate’s strategy will, and should, look vastly different from that of someone planning to retire in the next five years.

    From Theory to Action: Building Your Hybrid Strategy

    Think of the strategies we've discussed as ingredients. Your job is to be the chef, selecting and combining them to create a recipe that works for you. You don't have to choose just one; in fact, you shouldn't.

    A robust, real-world portfolio often blends several of these concepts seamlessly. For instance:

    • The Foundational Core: You might decide the bulk of your portfolio, perhaps 70-80%, should be built on the steady, reliable principles of Index Fund Investing and Dollar-Cost Averaging. This combination automates your savings, captures broad market growth, and removes the emotional guesswork from market timing.
    • The Growth Engine: For a smaller portion of your portfolio, say 10-15%, you could apply the principles of Growth Stock Investing. This is where you might research and select a handful of individual companies you believe have disruptive potential, aiming for above-average returns. This "core-and-satellite" approach gives you a stable base with a bit of high-growth spice.
    • The Income and Diversification Layer: Another 5-10% could be allocated to Dividend Growth Investing or REITs to generate a steady stream of passive income and add real estate exposure. Simultaneously, ensuring some of your index funds or individual stocks are international provides crucial global diversification.

    All of this would be managed within the powerful framework of Tax-Advantaged Retirement Investing, using accounts like a 401(k) or Roth IRA to maximize your long-term, tax-free growth potential. Finally, you would use an Asset Allocation and Rebalancing schedule to periodically review this entire structure, ensuring it remains aligned with your targets.

    The Most Important Takeaway: Discipline Over Genius

    If there is one single secret to successful long-term investing, it isn't about picking the one perfect stock or timing the market flawlessly. It is about consistency and discipline. It's about creating a sound plan based on the strategies detailed here and sticking with it through market highs and lows.

    Your financial behavior is far more critical than your financial intelligence. The investor who consistently applies a good plan will almost always outperform the genius who constantly chases new ideas and abandons their strategy at the first sign of trouble.

    The journey to financial independence is a marathon, not a sprint. The concepts we've covered, from Dollar-Cost Averaging to Asset Allocation, are designed to build wealth methodically over years and decades. Mastering them provides not just the potential for financial gain, but also peace of mind. By understanding why you are invested the way you are, you build the conviction needed to stay the course when markets inevitably become volatile. Your personalized blueprint becomes your anchor in the storm, guiding you toward your ultimate financial destination.


    Ready to see these strategies in action? The Investogy newsletter offers a transparent, real-world case study by documenting the management of a live portfolio, giving you invaluable insight into the "why" behind every investment decision. Subscribe to build your conviction and learn how to apply the best long term investment strategies with confidence. Investogy

  • 12 Best Investment Portfolio Management Tools for 2025

    12 Best Investment Portfolio Management Tools for 2025

    Are you a 'Data-Driven Dabbler' buried under a mountain of browser tabs and a sprawling spreadsheet, struggling to get a clear picture of your investments? Or perhaps you're a 'Seasoned Process-Seeker' who has the strategy but lacks the time for deep, manual analysis. Modern investing demands more than raw data; it requires efficient, insightful tools for tracking performance, analyzing risk, and making confident decisions. The right investment portfolio management tools can transform a chaotic collection of assets into a coherent, actionable strategy.

    This guide cuts through the noise. Instead of just listing features, we provide a curated look at the 12 best platforms for active investors. We evaluate each based on real-world use cases, analytical depth, and suitability for different needs, from comprehensive dashboards to specialized resources like Investogy, which focuses on building conviction through transparent, real-money portfolio examples. For investors with highly specific strategies, even more focused solutions exist. For instance, beyond general portfolio management software, specialized solutions like options trading tracker tools can help you meticulously manage and analyze specific investment positions.

    Our goal is simple: to help you find the right system to command your portfolio. Each review includes screenshots and direct links, so you can build a more robust process, save valuable time, and ultimately make more informed financial decisions.

    1. Investogy

    Investogy offers a uniquely practical and educational approach to portfolio management, distinguishing itself from traditional software-based investment portfolio management tools. Rather than providing a platform for you to track your own assets, it delivers a concise, free weekly newsletter that grants transparent access to a live, real-money portfolio. This structure is ideal for active retail investors who learn best by example and seek to understand the strategic thinking behind successful portfolio adjustments.

    The core strength of Investogy lies in its narrative-driven analysis. Each three-minute read connects high-level market insights directly to tangible decisions within its publicly tracked portfolio, which has grown from $50,000 to over $60,000 since 2022. This "show, don't just tell" method builds investor conviction by demonstrating the application of value investing principles in real time.

    Key Benefit: Investogy bridges the gap between theoretical knowledge and practical application. By following a real portfolio, you gain insight into the rationale behind trades, risk management, and long-term strategy, a feature absent in most static analysis tools.

    Standout Features and Use Cases

    • Real-Money Portfolio Tracking: Follow a live portfolio's performance, holdings, and transaction history. This is invaluable for investors wanting to see how strategies play out with actual capital at stake, including both wins and losses.
    • Narrative-Driven Analysis: Each newsletter explains the "why" behind investment decisions, connecting them to broader market trends and fundamental company analysis. This helps users develop their own analytical framework.
    • Time-Efficient Insights: The concentrated three-minute format respects the user's time while delivering actionable, research-backed ideas, making it perfect for busy professionals.

    Practical Considerations

    While an exceptional learning resource, Investogy is not a direct portfolio tracker for your personal assets. It serves as an educational model and a source of high-quality investment ideas. Users should use the insights to inform their own due diligence rather than as direct financial advice.

    • Best For: Investors seeking to deepen their understanding of value investing and portfolio strategy through real-world examples.
    • Limitations: Does not offer personalized tracking or advice; its focus on a single, long-term value strategy may not suit all investment styles.
    • Access: The newsletter is free to subscribe.

    Website: https://investogy.com

    2. Empower (formerly Personal Capital)

    Empower stands out by offering a powerful, holistic view of your entire financial life, not just your investments. Its strength lies in its ability to aggregate all your financial accounts-from checking and savings to 401(k)s, IRAs, and even mortgages and loans-into a single, intuitive dashboard. This makes it one of the most comprehensive free investment portfolio management tools available for tracking your net worth in real-time.

    The user experience is clean and visually driven, making complex financial data easy to understand. While many platforms offer basic tracking, Empower excels with its detailed analysis tools.

    Key Feature: Empower's Retirement Planner is a standout. It runs thousands of simulations to assess your retirement readiness, factoring in major life events and spending goals, providing a clear probability of success.

    Core Functionality & Use Case

    • Best For: Investors who want a complete, 360-degree view of their financial health and a robust, free tool for long-term retirement planning.
    • Investment Analysis: The platform's "Investment Checkup" tool analyzes your portfolio's asset allocation, identifies hidden fees, and suggests improvements to align with your target allocation. This is invaluable for anyone looking to optimize their holdings.
    • Implementation Tip: For the most accurate analysis, link all your financial accounts. The initial setup might take 30 minutes, but the resulting comprehensive overview is well worth the effort.

    Pricing and Limitations

    Access to the financial dashboard, net worth tracker, and all planning tools is completely free. Empower generates revenue from its optional wealth management service, which is available to users with a minimum of $100,000 in investable assets. The advisory fees for this service start at 0.89% and decrease for larger portfolios, which is higher than many robo-advisors. However, there is no pressure to sign up for the paid service to use the free tools. For those just starting out, understanding the fundamentals is key; you can learn more about building an investment portfolio here.

    Website: https://www.empower.com/

    3. Quicken Premier

    Quicken Premier moves beyond simple investment tracking to offer a complete personal finance ecosystem. As a robust desktop software, it combines detailed budgeting, bill management, and powerful investment portfolio management tools into one centralized hub. Its primary differentiator is its depth, providing users with granular control over every aspect of their financial lives, from daily spending to long-term investment performance.

    The interface, while comprehensive, is designed to be user-friendly, integrating data from thousands of financial institutions. This allows for a real-time, consolidated view of your financial standing, including banking, credit cards, loans, and investments.

    Key Feature: The integration with Morningstar's Portfolio X-Ray tool is a significant advantage. It offers an in-depth analysis of your portfolio, breaking down asset allocation, sector weightings, and investment style, providing insights typically reserved for professional-grade platforms.

    Core Functionality & Use Case

    • Best For: Detail-oriented investors who want a powerful, all-in-one software to manage their entire financial picture, including comprehensive budgeting, bill pay, and tax planning.
    • Investment Analysis: Quicken Premier allows you to track performance against market benchmarks, analyze capital gains for tax planning, and view your asset allocation with precision. Customizable reports and alerts help you stay on top of your portfolio's activity.
    • Implementation Tip: Take the time to categorize transactions as they come in. Consistent categorization powers Quicken's robust reporting and budgeting features, giving you a much clearer understanding of your financial habits and investment costs.

    Pricing and Limitations

    Quicken Premier operates on a subscription model, with pricing typically around $6.99 per month (billed annually). Unlike free web-based tools, this fee provides an ad-free experience with dedicated customer support. The software can feel complex for beginners who only need basic investment tracking, as its feature set is incredibly broad. However, for those seeking a single solution to manage everything, the subscription offers substantial value.

    Website: https://www.quicken.com/

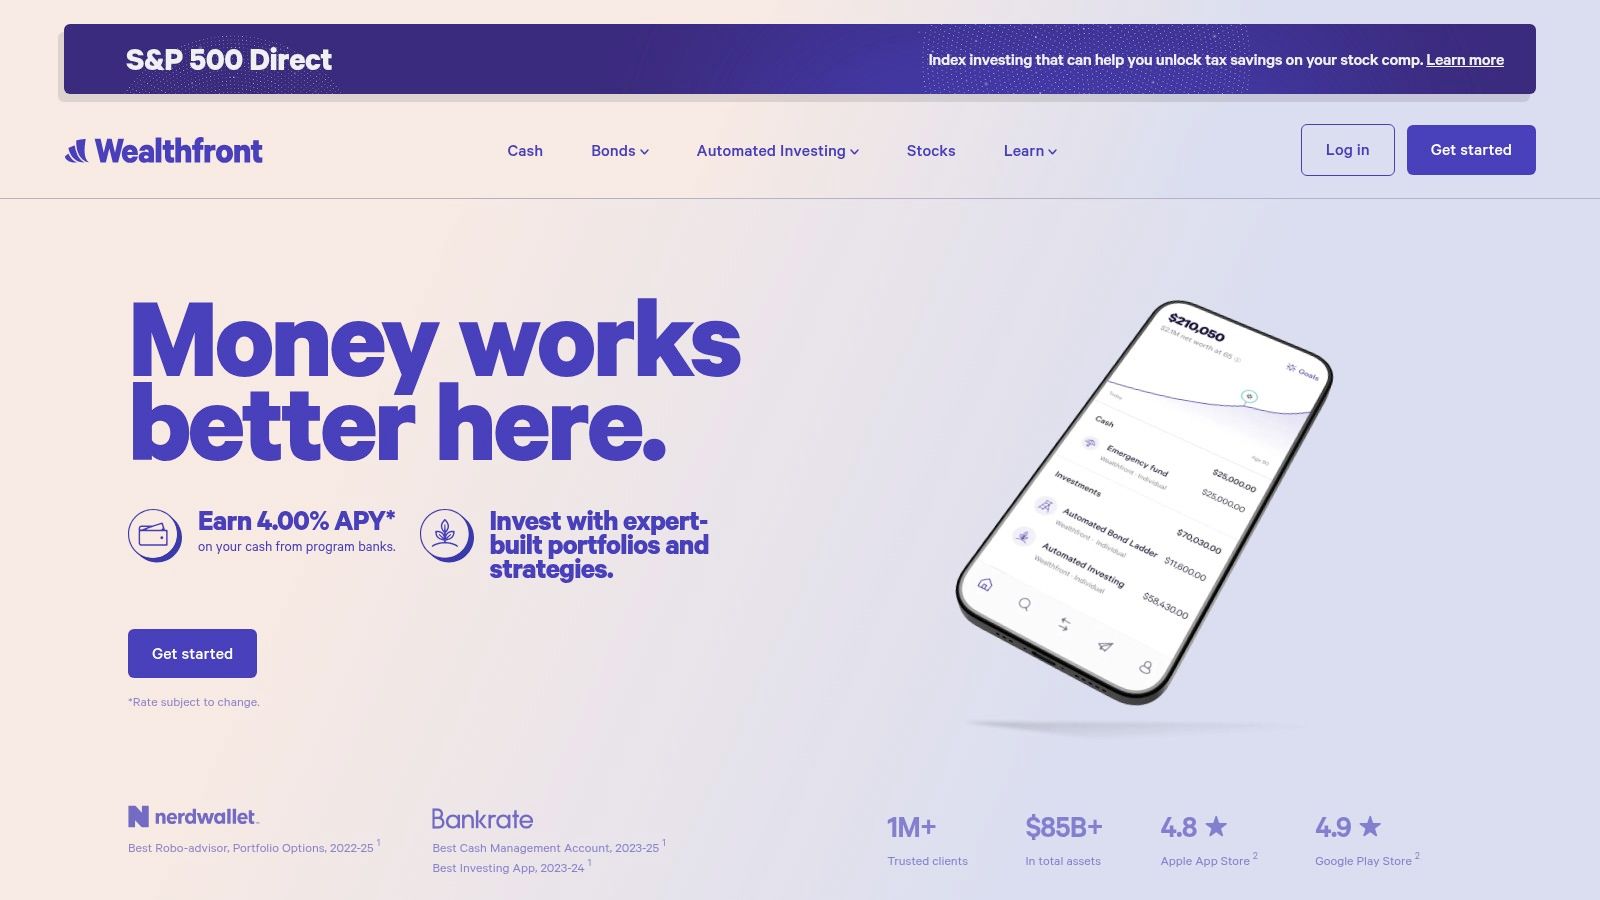
    4. Wealthfront

    Wealthfront is a pioneer in the robo-advisor space, designed for investors who prefer a sophisticated, automated, and hands-off approach to managing their money. It builds and manages a globally diversified portfolio of low-cost index funds on your behalf, tailored to your specific risk tolerance. Its primary appeal is its powerful automation, making it one of the top investment portfolio management tools for set-it-and-forget-it investing.

    The platform is known for its clean interface and strong focus on tax-efficiency, which sets it apart from many competitors. It moves beyond basic rebalancing to offer advanced strategies typically reserved for high-net-worth individuals.

    Wealthfront

    Key Feature: Wealthfront's automated Tax-Loss Harvesting is a major differentiator. It systematically sells investments at a loss to offset capital gains, potentially boosting your annual returns without any manual effort.

    Core Functionality & Use Case

    • Best For: Hands-off investors who want a low-cost, tax-optimized portfolio managed automatically, without needing access to a human advisor.
    • Investment Analysis: Beyond standard automated rebalancing, Wealthfront offers Direct Indexing for accounts over $100,000. This feature replaces a broad-market ETF with individual stocks, allowing for more granular tax-loss harvesting opportunities.
    • Implementation Tip: Use Wealthfront’s goal-based planning tools to create separate plans for retirement, a home down payment, or college savings. The platform will then manage your investments to align with each goal's specific timeline.

    Pricing and Limitations

    Wealthfront charges a straightforward annual advisory fee of 0.25% on all assets under management, with a low minimum investment requirement of $500. This fee is competitive and transparent. However, the platform is fully automated and does not offer access to human financial advisors, which can be a drawback for investors seeking personalized guidance or reassurance during market volatility. Customization is also limited; you cannot select individual stocks or ETFs outside of their prescribed portfolios.

    Website: https://www.wealthfront.com/

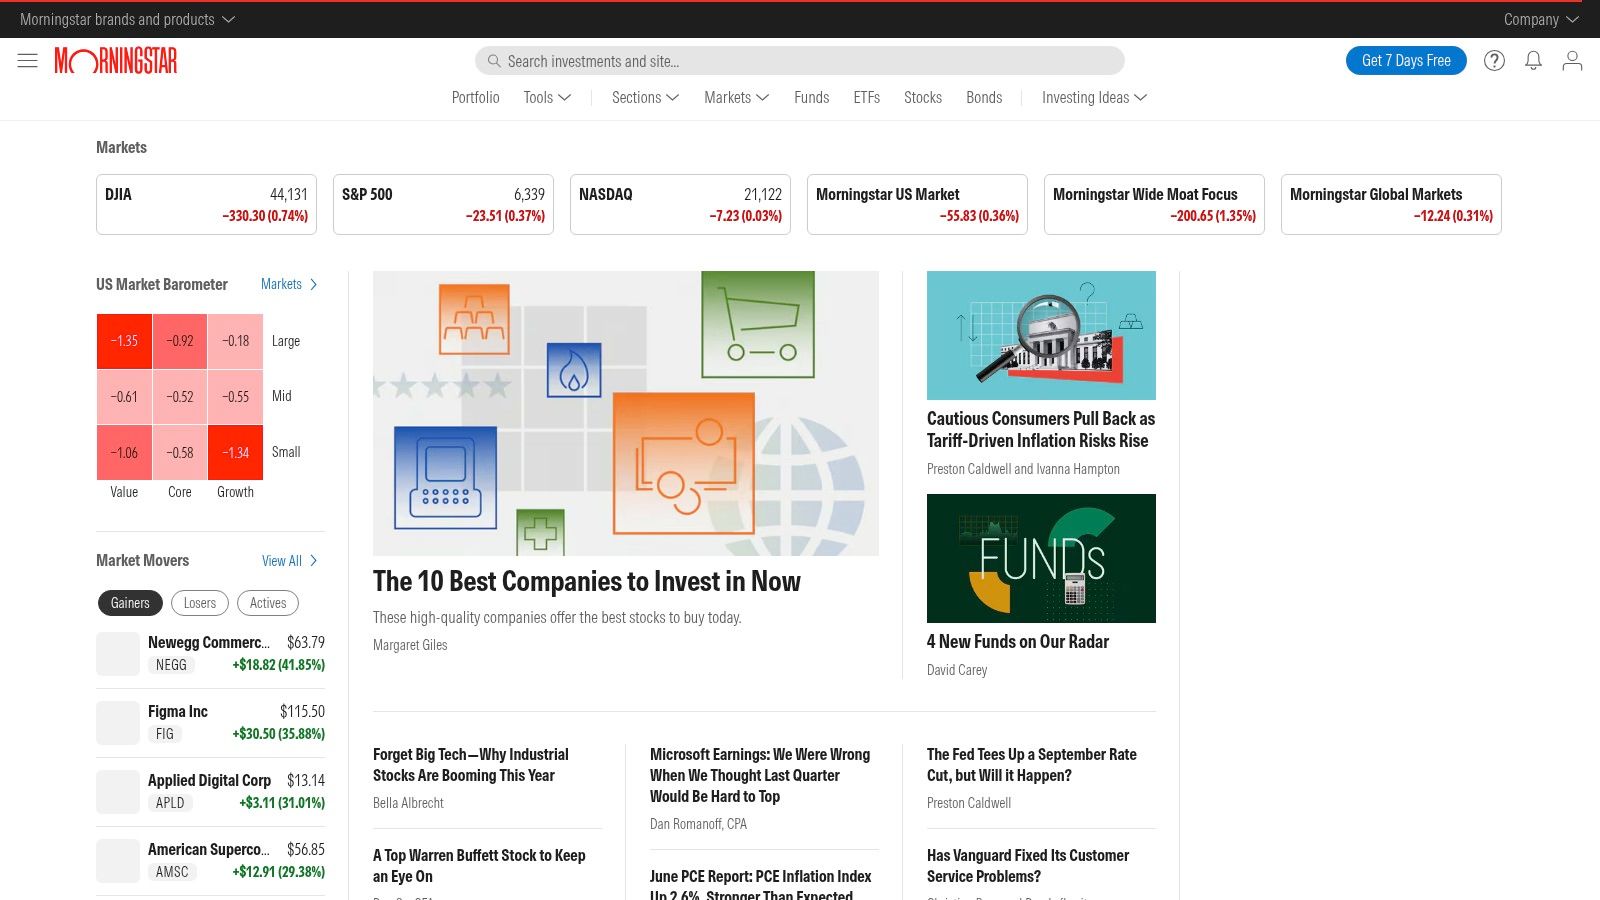
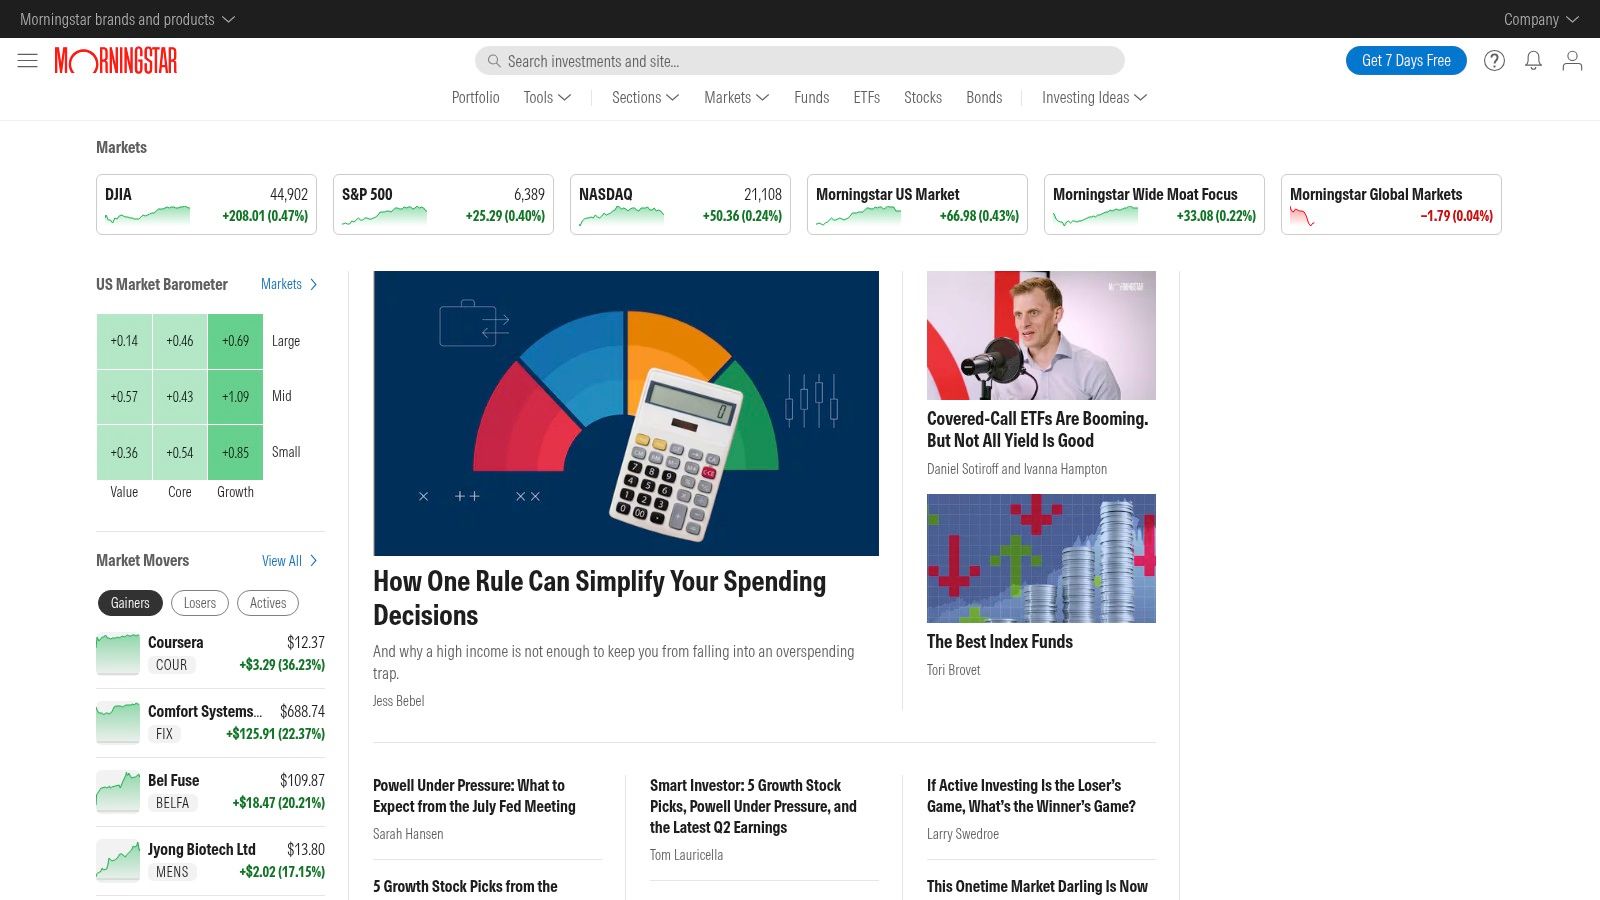
    5. Morningstar Investor

    Morningstar has long been a pillar of the investment community, known for its independent research and trusted ratings. Morningstar Investor builds on this reputation by providing a suite of powerful analytical tools designed for the serious investor who wants to go beyond surface-level tracking and perform a deep dive into their holdings. It is one of the premier investment portfolio management tools for research-driven decision-making.

    Morningstar Investor

    The platform is less about flashy dashboards and more about substance, delivering institutional-grade data and analysis directly to retail investors. While it can feel complex for beginners, those committed to understanding the "why" behind their investments will find it indispensable.

    Key Feature: The Portfolio X-Ray tool is Morningstar's crown jewel. It goes deep into your portfolio to uncover underlying stock and sector concentrations, geographic exposure, and style diversification, revealing risks you might not know you have.

    Core Functionality & Use Case

    • Best For: Detail-oriented investors who prioritize in-depth research and want to use professional-grade analytics to vet potential investments and optimize their existing portfolio.
    • Investment Analysis: Beyond the X-Ray, users get access to Morningstar's proprietary ratings for stocks, ETFs, and mutual funds. The platform provides extensive reports, analyst notes, and fair value estimates to support a thorough investment decision-making process.
    • Implementation Tip: Start by linking your main brokerage account to populate the Portfolio X-Ray. Spend time exploring the "Stock Intersection" feature within the report to identify unintended concentration in a single company across multiple funds.

    Pricing and Limitations

    Morningstar Investor operates on a freemium model. Basic portfolio tracking and access to some articles are free. However, to unlock the most valuable features, including the full Portfolio X-Ray tool, analyst ratings, and premium content, a Morningstar Investor subscription is required. The subscription costs $249 per year, though discounts are often available. The platform's interface can be data-heavy and may present a steep learning curve for those new to investing.

    Website: https://www.morningstar.com/

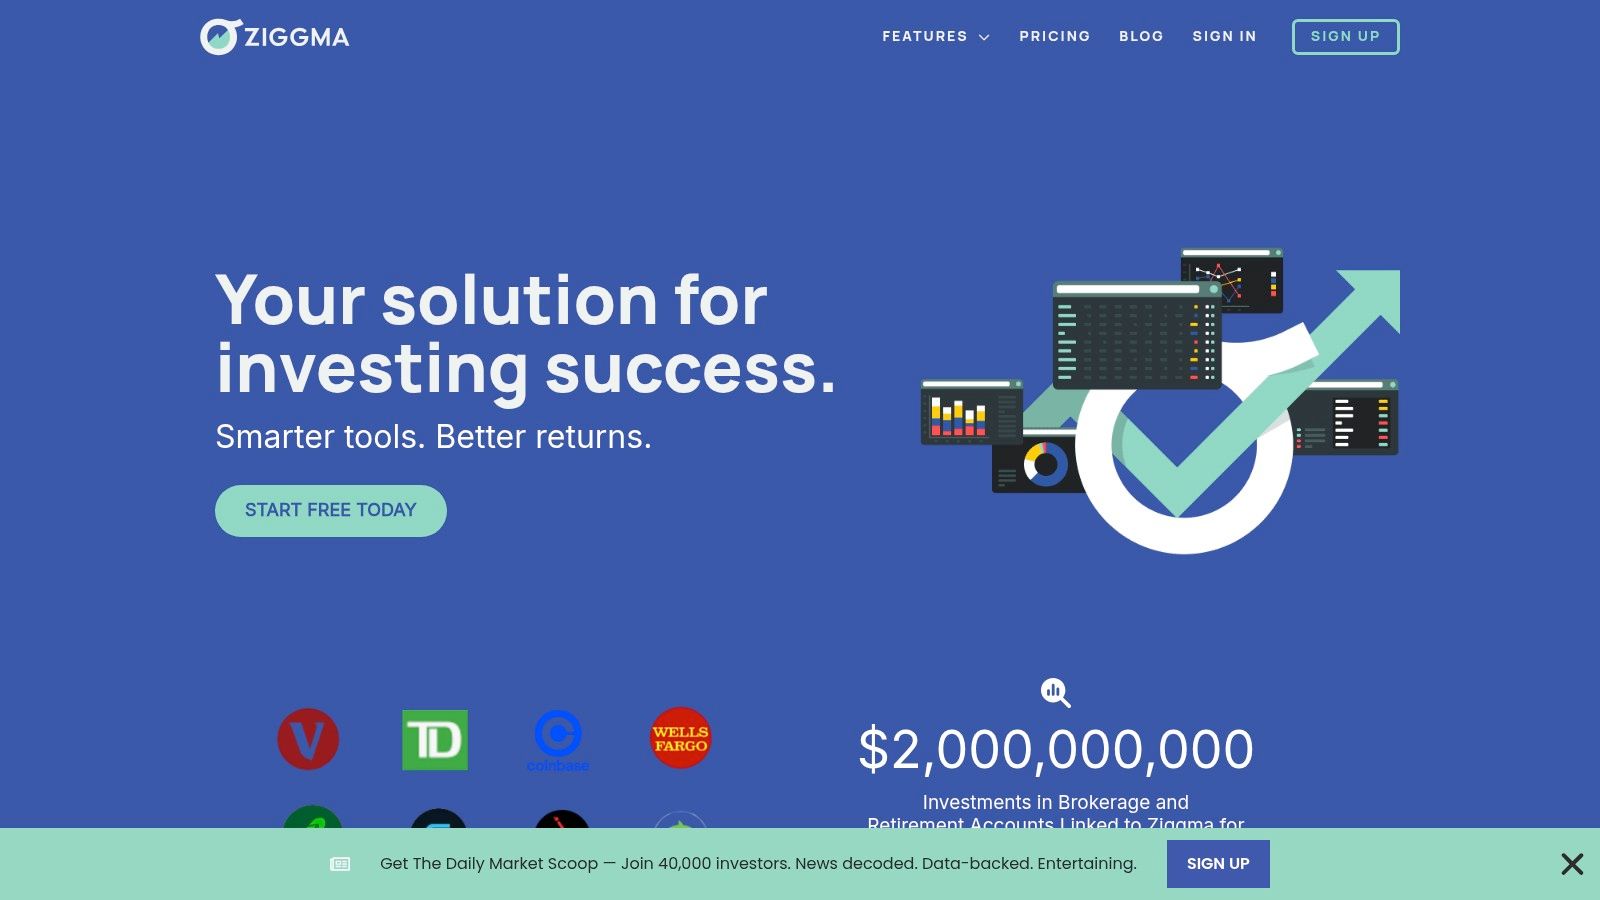
    6. Ziggma

    Ziggma is designed for the data-driven investor who wants institutional-grade portfolio analysis without the institutional-grade price tag. It combines powerful stock and ETF screening with in-depth portfolio analytics, making it a strong contender for those who actively research and manage their own holdings. The platform’s strength lies in its proprietary Z-Score, which simplifies fundamental analysis by condensing over 50 financial metrics into a single, digestible score for quick company evaluation.

    Ziggma

    The user interface is clean and functional, prioritizing data over flashy visuals. While many platforms offer basic tracking, Ziggma provides advanced tools to dissect your portfolio’s performance, risk exposure, and dividend income.

    Key Feature: The platform’s stock and ETF screeners are exceptionally robust. You can filter investments using a wide array of fundamental, quality, and valuation metrics, making it easy to find opportunities that align with a specific strategy.

    Core Functionality & Use Case

    • Best For: Hands-on investors who enjoy deep-dive research and want powerful analytical tools to optimize their portfolio and discover new investment ideas.
    • Investment Analysis: Ziggma excels at portfolio monitoring, offering detailed breakdowns of your allocation, risk-adjusted returns, and peer group comparisons. This makes it one of the more analytical investment portfolio management tools for individual stock pickers.
    • Implementation Tip: Start by using the portfolio import feature. While brokerage integration is limited, uploading a CSV file of your holdings will quickly populate your dashboard and unlock the full suite of analytical features.

    Pricing and Limitations

    Ziggma offers a free plan that includes basic portfolio tracking and limited access to its screeners. The Premium plan, which unlocks all features including the Z-Score, advanced screeners, and in-depth analytics, is priced affordably at $9.90 per month or $89 per year. A significant limitation is the lack of broad, direct brokerage account syncing, which requires manual data entry or uploads for most users. Furthermore, there is currently no dedicated mobile app available.

    Website: https://www.ziggma.com/

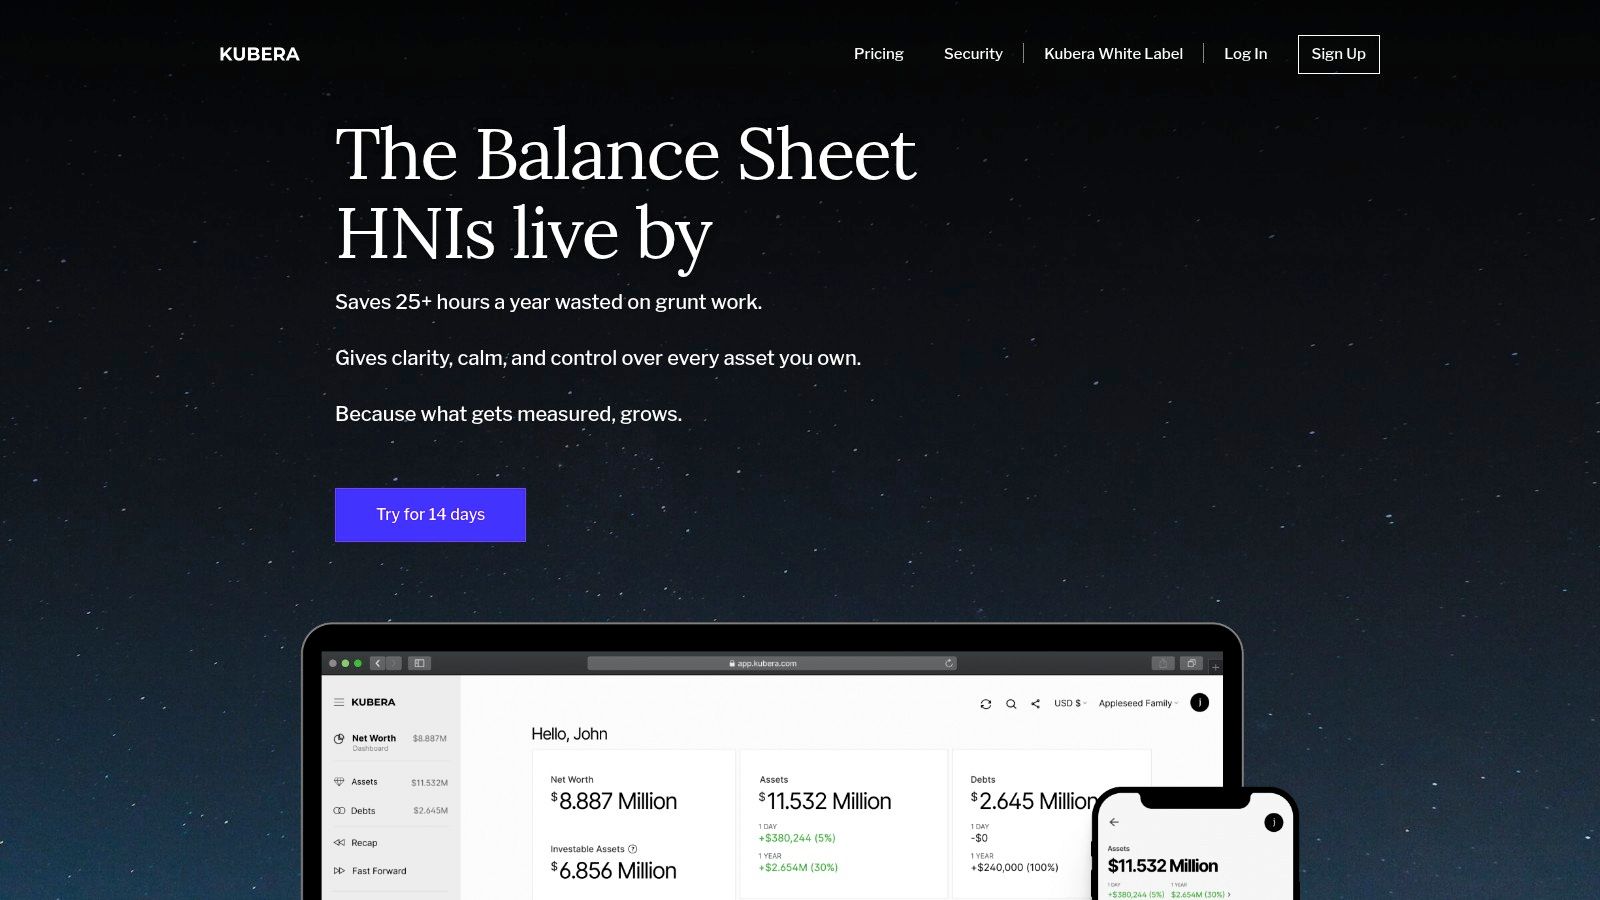
    7. Kubera

    Kubera positions itself as the ultimate modern net worth tracker, designed for investors who hold a diverse and global mix of assets. Where many platforms focus solely on traditional stocks and funds, Kubera excels at integrating everything from bank accounts and brokerage holdings to cryptocurrencies, DeFi assets, NFTs, real estate, and even collectibles like cars or domain names. It provides a clean, private, and spreadsheet-like interface for a consolidated view of your wealth.

    Kubera

    The platform prioritizes simplicity and a premium, ad-free user experience. This makes it one of the more focused investment portfolio management tools for users who value privacy and need to track unconventional assets alongside their traditional investments.

    Key Feature: Kubera’s “Safe Deposit Box” allows you to securely store important documents and designate a beneficiary who will receive access to your complete financial portfolio and files in the event of your death.

    Core Functionality & Use Case

    • Best For: High-net-worth individuals and tech-savvy investors with a complex portfolio of traditional, digital, and alternative assets.
    • Investment Analysis: The platform automatically pulls data from thousands of institutions and provides easy-to-read charts that show your asset allocation and performance over time. Its strength is in aggregation, not deep financial analysis.
    • Implementation Tip: Take full advantage of the manual asset entry for items like art, real estate, or private equity. Regularly update their values to maintain an accurate net worth picture.

    Pricing and Limitations

    Kubera operates on a simple subscription model, costing $15 per month or $150 per year, with a 14-day trial available. There is no free version. This price buys you a completely private, ad-free experience with no upselling of financial products or advisory services. The platform’s primary limitation is its lack of advanced analytical or retirement planning tools found in competitors like Empower. It is a pure tracking and aggregation tool, not a financial advisor.

    Website: https://www.kubera.com/

    8. Portfolio Visualizer

    Portfolio Visualizer is not a typical account aggregator; instead, it's a powerful analytical engine designed for sophisticated investors who want to dive deep into data. It offers a suite of institutional-grade backtesting and simulation tools that are accessible to the public. This makes it one of the most powerful free investment portfolio management tools for anyone serious about stress-testing their investment strategies against historical data.

    The platform's interface is clean and function-oriented, prioritizing data analysis over flashy visuals. It allows you to model and compare different portfolios without needing to link any live accounts.

    Key Feature: The platform’s Backtest Portfolio tool is unparalleled. It allows you to construct hypothetical portfolios using various assets (stocks, ETFs, mutual funds) and analyze their historical performance, risk metrics, and drawdowns against multiple benchmarks.

    Core Functionality & Use Case

    • Best For: DIY investors and financial enthusiasts who want to perform quantitative analysis, test asset allocation theories, and optimize their portfolio based on historical data.
    • Investment Analysis: Beyond backtesting, its Monte Carlo simulation tool projects potential future outcomes, helping you understand the probability of meeting your financial goals and the range of potential returns. Its factor analysis capabilities are also a significant asset; you can learn more about how these different analytical approaches compare to other stock market analysis tools here.
    • Implementation Tip: Start by using the "Backtest Portfolio" feature with your current allocation to understand its historical behavior. Then, model alternative allocations to see how different asset mixes could have impacted risk and return.

    Pricing and Limitations

    A generous version of Portfolio Visualizer is available for free, providing access to most of the core backtesting and analysis tools. For more advanced features, such as intraday backtesting, factor model regressions, and saving multiple portfolios, a paid subscription is required. The "Basic" tier starts at $29/month, with a "Premium" tier for financial professionals. The free version is more than sufficient for most individual investors, but the learning curve can be steep for complete beginners.

    Website: https://www.portfoliovisualizer.com/

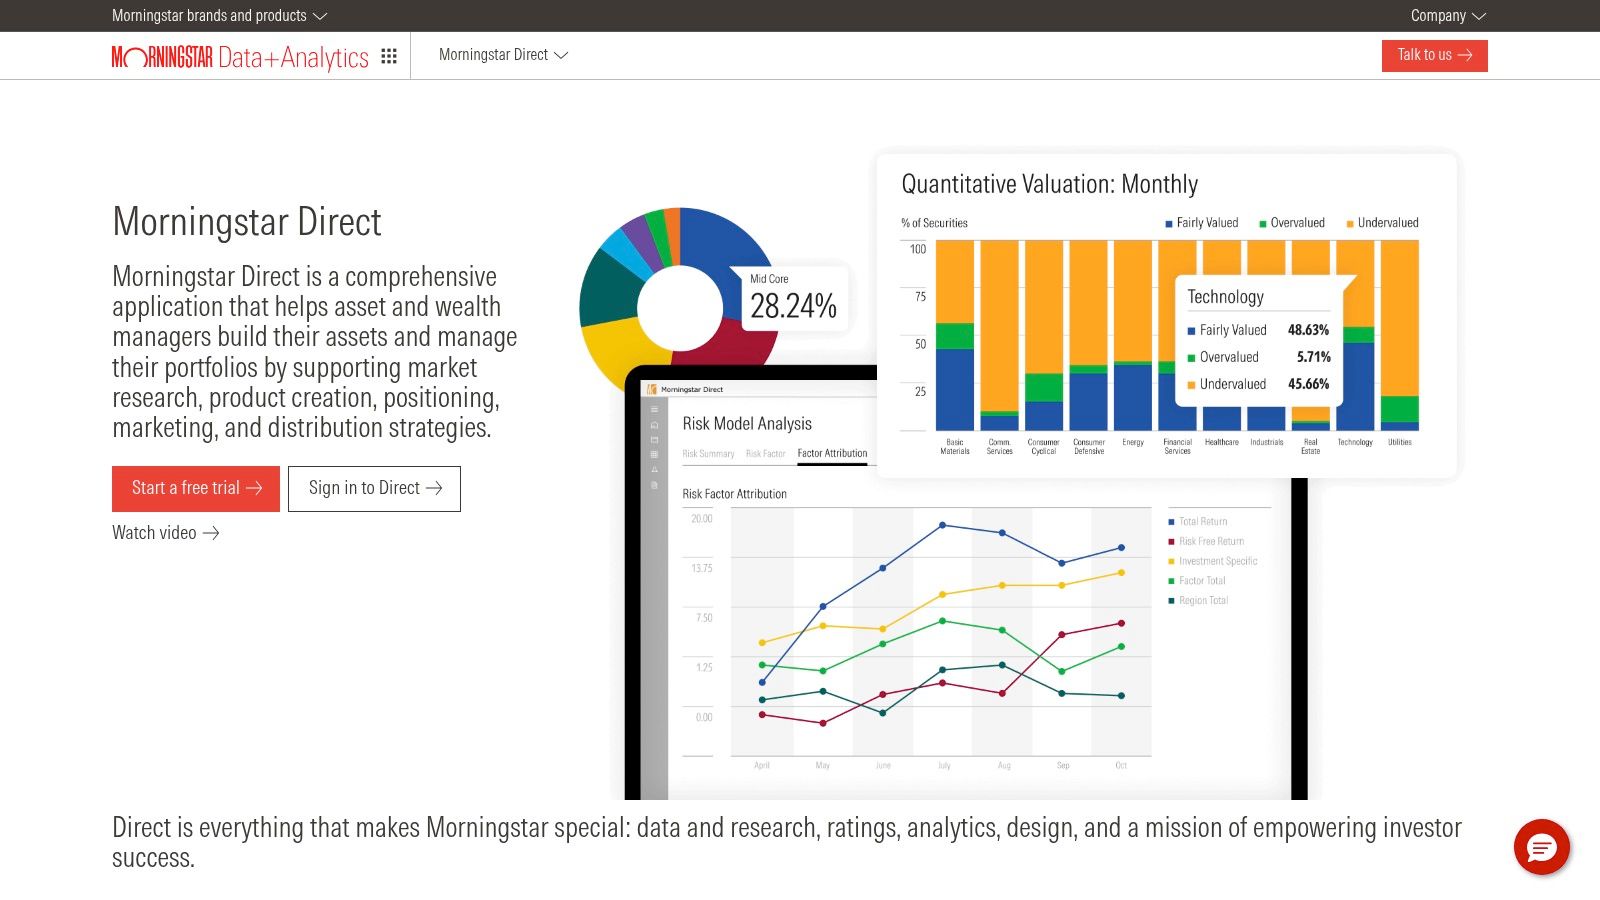
    9. Morningstar Direct

    Morningstar Direct is an institutional-grade powerhouse, offering a level of data depth and analytical precision that goes far beyond typical retail platforms. It is designed for financial advisors, asset managers, and institutional investors who require exhaustive research, performance attribution, and advanced portfolio analytics. This platform is less about simple tracking and more about deep, data-driven investment decision-making.

    The interface is complex and data-rich, reflecting its professional user base. While not as intuitive as consumer-focused apps, its strength lies in its comprehensive database and powerful, customizable reporting capabilities.

    Morningstar Direct

    Key Feature: The platform’s access to Morningstar’s proprietary data and research on millions of securities (including mutual funds, ETFs, stocks, and private assets) is unparalleled, providing an incredible research advantage.

    Core Functionality & Use Case

    • Best For: Financial professionals, RIAs, and sophisticated individual investors who need institutional-quality research, portfolio construction, and risk analysis tools.
    • Investment Analysis: Morningstar Direct enables users to conduct advanced performance attribution, scenario analysis, and stress testing. You can dissect a portfolio's exposure to various factors and compare investment strategies with granular detail.
    • Implementation Tip: Leverage the pre-built report templates to get started. Customizing reports from scratch can be time-consuming, so modifying existing ones is a more efficient way to learn the system's capabilities.

    Pricing and Limitations

    Morningstar Direct is a premium, subscription-based service with pricing aimed at enterprise clients, often running into thousands of dollars per user annually. It is not suitable for the average retail investor due to its high cost and complexity. The platform's extensive features can have a steep learning curve, requiring significant time commitment to master. It is one of the most powerful investment portfolio management tools available, but its accessibility is limited to those who can justify the significant expense.

    Website: https://www.morningstar.com/products/direct

    10. YCharts

    YCharts is a powerful, professional-grade research and analysis platform that brings institutional-quality data to the individual investor. While many tools focus solely on portfolio tracking, YCharts excels at deep fundamental analysis, providing extensive historical data on stocks, ETFs, and mutual funds. It serves as a comprehensive tool for those who want to move beyond basic tracking and perform their own in-depth due diligence on potential investments.

    YCharts

    The platform is renowned for its charting capabilities and vast library of financial metrics, making it easier to visualize trends and compare securities. It’s one of the best investment portfolio management tools for serious, data-driven investors.

    Key Feature: The Excel Add-in is a game-changer for advanced users. It allows you to pull YCharts' vast dataset directly into your own spreadsheets for custom modeling and analysis, a feature typically reserved for expensive institutional terminals.

    Core Functionality & Use Case

    • Best For: Serious DIY investors and financial professionals who need access to deep financial data for equity research, screening, and comparative analysis.
    • Investment Analysis: Use the powerful screener to filter thousands of stocks based on hundreds of specific financial metrics, from P/E ratios to free cash flow yield. You can then use the charting tools to visually compare the finalists side-by-side.
    • Implementation Tip: Start by using the pre-built chart templates to familiarize yourself with the platform. Once comfortable, create and save your own custom templates for metrics you track regularly to streamline your research workflow.

    Pricing and Limitations

    YCharts operates on a subscription model and is positioned as a premium product. Pricing is not publicly listed and requires contacting their sales team for a quote, but plans are known to be significantly more expensive than consumer-focused tools, often starting at several hundred dollars per year. A free trial is typically available. While powerful, the cost makes it less suitable for casual investors or those with smaller portfolios who may not utilize its full range of advanced features.

    Website: https://ycharts.com/

    11. Addepar

    Addepar is an institutional-grade wealth management platform designed for the highest echelons of finance, serving registered investment advisors (RIAs), family offices, and private banks. It provides unparalleled data aggregation, analytics, and reporting capabilities for managing complex, multi-asset class portfolios that often include alternative investments like private equity and real estate.

    Addepar

    While not intended for the average retail investor, its inclusion in this list highlights what the most sophisticated professional investment portfolio management tools are capable of. The platform excels at transforming vast, disparate financial data into clear, actionable insights through highly customizable reports and dashboards.

    Key Feature: Addepar's strength lies in its ability to handle and analyze complex ownership structures and illiquid alternative assets, providing a true, consolidated performance picture that most retail platforms cannot replicate.

    Core Functionality & Use Case

    • Best For: Financial advisors, family offices, and institutional investors managing significant, diversified wealth across public and private markets.
    • Investment Analysis: The platform offers deep, flexible analytics, allowing users to drill down into performance attribution, risk exposure, and cash flow projections across any segment of a portfolio.
    • Implementation Tip: This is a professional tool. Its power is unlocked through a dedicated implementation process, often requiring collaboration between the financial institution and Addepar's team to integrate data sources correctly.

    Pricing and Limitations

    Addepar operates on a tiered, enterprise-level subscription model based on assets under management (AUM). It is a premium-priced solution with costs far exceeding what an individual investor would consider, typically running into the tens of thousands of dollars annually or more. It is not available for direct use by retail investors; access is through a financial advisor or institution that uses the platform.

    Website: https://addepar.com/

    12. Koyfin

    Koyfin is often described as a more accessible and user-friendly alternative to a Bloomberg Terminal, offering institutional-grade financial data and analytics to individual investors. It excels at providing deep market analysis, sophisticated charting, and robust portfolio tracking tools within a single, highly customizable interface. This makes it an exceptional choice for serious investors who need more than basic performance metrics.

    Koyfin

    The platform is built for in-depth research, allowing users to create custom dashboards with everything from advanced charts and watchlists to detailed financial statements and economic data.

    Key Feature: Koyfin's "My Dashboards" functionality is its crown jewel. It allows users to build completely customized layouts, combining charts, news, financial data, and personal portfolio information into a single screen for efficient monitoring and analysis.

    Core Functionality & Use Case

    • Best For: Data-driven investors and financial professionals who want powerful analytical tools and comprehensive market data without the prohibitive cost of institutional platforms.
    • Investment Analysis: Beyond simple tracking, you can analyze your portfolio's factor exposures (e.g., value, growth, momentum), sector breakdown, and performance attribution. This helps you understand why your portfolio is performing a certain way.
    • Implementation Tip: Start by using one of Koyfin’s pre-built dashboard templates and gradually customize it. Link your brokerage accounts to populate your portfolio and begin exploring the advanced charting features to overlay different securities or economic indicators.

    Pricing and Limitations

    Koyfin operates on a freemium model. The free plan offers impressive functionality, including portfolio tracking for a limited number of accounts and access to a vast amount of data, but with some delays and feature restrictions. Paid plans unlock real-time data, more powerful analytics, unlimited watchlists, and advanced features. The paid tiers can be a significant cost for a casual investor. While powerful, its depth can present a steeper learning curve compared to simpler investment portfolio management tools.

    Website: https://www.koyfin.com/

    Investment Portfolio Management Tools Comparison

    Product Core Features/Characteristics User Experience / Quality ★ Value Proposition 💰 Target Audience 👥 Unique Selling Points ✨
    🏆 Investogy Free weekly newsletter; live $50K+ portfolio ★★★★☆ Concise 3-min read; expert tone 💰 Free; high trust & transparency 👥 Active retail investors (28-60), data & process seekers ✨ Narrative-driven analysis; real-money accountability
    Empower Account aggregation; investment & retirement tools ★★★★ User-friendly dashboard 💰 Free tools; paid advisory options 👥 Users seeking full financial overview ✨ Holistic financial management
    Quicken Premier Investment tracking; tax planning; reports ★★★★ Integrated & customizable 💰 Subscription-based 👥 Finance managers & DIY investors ✨ In-depth tax + investment management
    Wealthfront Automated investment; tax-loss harvesting ★★★★ Low fees; hands-off style 💰 Low management fees 👥 Hands-off investors; low-fee seekers ✨ Automated rebalancing; goal-based planning
    Morningstar Investor In-depth research; portfolio analysis tools ★★★★ Advanced analytics 💰 Subscription required 👥 Experienced investors & analysts ✨ Trusted data; Portfolio X-Ray
    Ziggma Portfolio analytics; stock & ETF screeners ★★★★ User-friendly 💰 Free + affordable premium 👥 Novice & experienced investors ✨ Affordable, essential features
    Kubera Multi-asset tracking; automated integrations ★★★★ Intuitive, supports alt-assets 💰 Subscription-based 👥 Investors with diverse asset classes ✨ Tracks stocks, crypto, real estate
    Portfolio Visualizer Backtesting; Monte Carlo simulations; optimization ★★★★ Comprehensive tools 💰 Free + subscription for advanced 👥 Individual investors & advisors ✨ Advanced portfolio risk & performance analysis
    Morningstar Direct Institutional-level analytics & reporting ★★★★★ Professional-grade 💰 High subscription cost 👥 Institutions & financial advisors ✨ Deep data, customizable reports
    YCharts Financial data; screening; customizable reporting ★★★★ Extensive database; user-friendly 💰 Subscription-based 👥 Investors & financial advisors ✨ Customizable charts & reports
    Addepar Data aggregation; portfolio reporting ★★★★★ Advanced & comprehensive 💰 High subscription cost 👥 Financial advisors & institutions ✨ Custom dashboards; institutional focus
    Koyfin Financial data & analytics; portfolio tracking ★★★★ User-friendly; extensive data 💰 Subscription-based 👥 Individual investors & financial advisors ✨ Customizable dashboards & charts

    From Insight to Action: The True Goal of Portfolio Management

    Navigating the vast landscape of investment portfolio management tools can feel overwhelming. We've journeyed through a comprehensive list, from the holistic dashboard of Empower and the detailed expense tracking of Quicken Premier to the powerful institutional-grade analytics of Morningstar Direct and Koyfin. Each tool offers a unique lens through which to view your financial world, promising clarity, efficiency, and deeper insight.

    However, the ultimate purpose of adopting any of these platforms is not merely data aggregation or creating sophisticated charts. The true goal is to bridge the gap between insight and action. A tool can show you what is happening with your asset allocation or how a specific security is performing, but it cannot, on its own, provide the conviction to act on that information. Technology is a powerful enabler, but the bedrock of successful long-term investing remains a disciplined, well-defined process.

    Finding Your Starting Point

    The key to avoiding "analysis paralysis" is to resist the urge to adopt every feature-rich tool at once. Instead, begin by identifying your single most significant pain point as an investor.

    • Is it a lack of a unified view? If your assets are scattered across multiple brokerages, 401(k)s, and crypto wallets, a tool like Empower or Kubera can provide the 30,000-foot perspective you need to make holistic decisions.
    • Is it analytical depth? If you find yourself struggling to compare ETFs, understand factor exposures, or backtest strategies, a platform like Portfolio Visualizer or Ziggma will give you the necessary analytical firepower.
    • Is it wavering conviction? A tool like Investogy is designed not just to track, but to help you document your investment thesis and decisions, reinforcing the "why" behind your holdings and helping you stay the course during market volatility.

    Choosing the right platform starts with an honest self-assessment of your needs, your investing style, and the specific problem you are trying to solve.

    Implementation and Principles

    Once you’ve selected a tool, remember that its effectiveness is directly tied to the quality of your underlying investment knowledge. Technology provides the data, but your strategy dictates how you interpret and act upon it. A powerful analytics platform in the hands of an undisciplined investor can lead to over-trading and poor outcomes just as easily as it can lead to success.

    To truly translate insights into effective action in portfolio management, a solid understanding of underlying investment principles is crucial, which can often be gained through an investment academy. Building this foundational knowledge ensures you're not just reacting to numbers on a screen but are making strategic decisions aligned with your long-term financial goals. The best investment portfolio management tools are those that complement, rather than replace, a sound investment process.

    Ultimately, the journey from being a passive account-holder to an active, engaged portfolio manager is one of continuous learning and refinement. The tools we’ve explored are your allies in this quest, built to illuminate the path and empower you to make smarter, more confident decisions. The goal isn't just to track your wealth, but to actively build it with purpose and conviction.


    Ready to move from tracking to true management? Investogy helps you build and maintain a strong investment process by focusing on the 'why' behind every decision. Stop just watching your portfolio; start managing it with conviction by signing up for a free Investogy account today.

  • Understanding Price to Earnings Ratio for Smart Investing

    Understanding Price to Earnings Ratio for Smart Investing

    Learning to read the price to earnings ratio is like getting a cheat sheet for a company's profitability. It’s a surprisingly simple yet powerful number that tells you exactly how many dollars investors are willing to pay for each dollar a company makes.

    This one metric is your first reality check to see if a stock is a potential bargain or just dangerously overhyped.

    What Is the P/E Ratio and Why Should You Care

    Image

    Imagine you’re thinking about buying a local coffee shop. The shop consistently brings in a profit of $50,000 a year. The owner wants $500,000 for it.

    What you're really doing is paying 10 times its annual earnings. That's it. You've just calculated its P/E ratio: 10. It works the exact same way for massive companies on the stock market, just with much bigger numbers.

    The P/E ratio gives you a quick, standardized way to check the market's pulse on a company. A high P/E isn't automatically good; it suggests investors are betting on big growth ahead. A low P/E isn't always a steal, either—it could signal an overlooked gem or a business with serious problems under the hood.

    Getting a handle on this metric is the first real step from just picking stocks to making truly informed investment decisions.

    Decoding the Components

    At its heart, the P/E ratio is just a mashup of two key pieces of data. If you don't understand where each number comes from, the final ratio is pretty much useless.

    Let's break them down.


    The Two Core Components of the P/E Ratio

    A simple breakdown of the two inputs that create the Price to Earnings ratio and what each component signifies for an investor.

    Component What It Represents Where to Find It
    Price (P) This is the current market price for one share of the company's stock. It’s what someone is willing to pay for a tiny piece of the business right now. You'll see this on any stock ticker or financial news site.
    Earnings (E) This is the company's Earnings Per Share (EPS). It’s the total profit divided by the total number of shares, telling you how much profit is attributed to each individual share. This is a key figure in a company's quarterly or annual earnings reports.

    By slamming these two numbers together, you get a powerful snapshot of a company's valuation.

    Once you have a solid grasp of what the P/E ratio is telling you, you can use various portfolio analysis tools to apply this knowledge across all your investments. Think of this simple ratio as your gateway to a much deeper understanding of a company's financial health and its place in the market.

    How to Calculate the P/E Ratio With Real-World Numbers

    Image

    Alright, let's roll up our sleeves and put the price-to-earnings ratio into practice. It’s refreshingly simple. While just about every financial platform will hand you the P/E on a silver platter, calculating it yourself is the best way to really get what it means for a company's valuation.

    It all boils down to one simple formula.

    P/E Ratio = Market Price per Share / Earnings per Share (EPS)

    This little bit of division is powerful—it tells you exactly how much the market is willing to pay for each dollar of a company's profit. To get this right, you need to be comfortable finding the "Earnings Per Share" number, which means knowing how to read earnings reports where companies publish this key data.

    Let's walk through the math with a couple of real-world scenarios. This will show you not just how it works, but why context is everything.

    Example 1: The Established Consumer Brand

    First up, let's picture a big, reliable company that sells stuff we all use, like household goods. We’ll call it "Global Goods Inc." This is a mature, stable business. No one is expecting it to grow at a blistering pace, but it's a steady earner.

    Here are its vitals:

    • Market Price per Share (P): $150
    • Earnings per Share (EPS): $10

    Now, we just plug those numbers into our formula:

    • P/E Ratio = $150 / $10 = 15

    A P/E of 15 means investors are currently paying $15 for every $1 of Global Goods Inc.'s annual profit. For a stable company in a mature industry, this is pretty standard. It suggests a reasonable valuation, without the kind of wild growth expectations that can inflate prices.

    Example 2: The High-Growth Tech Company

    Next, let’s look at a totally different beast: a fast-moving tech company, "InnovateTech." This company is famous for its groundbreaking software and is expanding like crazy. Investors are betting on huge profit growth in the future.

    Here are its numbers:

    • Market Price per Share (P): $300
    • Earnings per Share (EPS): $6

    Plugging these into the formula paints a very different picture:

    • P/E Ratio = $300 / $6 = 50

    A P/E of 50 is way up there, and it’s a clear signal of massive market optimism. Investors are willing to pay a hefty premium—$50 for every $1 of current earnings—because they're convinced InnovateTech’s profits are about to skyrocket, making today's high price look like a bargain down the road.

    These two examples make it crystal clear: a P/E ratio isn't just a dry number; it's a story about market expectations. While it's one of the most popular metrics out there, it’s just one tool in a whole toolbox of stock valuation methods you can use. Comparing these two results shows you can't ever look at a P/E ratio in a vacuum.

    What High and Low P/E Ratios Are Actually Telling You

    Image

    A P/E ratio is just a number until you give it a story. This is where real investment analysis begins—digging into what that number says about the market's collective opinion of a stock.

    A high or low P/E isn’t a simple buy or sell signal. Think of it as the start of a conversation. It's a prompt, pushing you to ask deeper questions about a company's future, its industry, and the economy as a whole.

    Decoding a High P/E Ratio

    When a company has a high P/E ratio, it simply means investors are willing to pay a premium price for every dollar of its earnings. This isn't automatically a bad thing; in fact, it’s a huge sign of high expectations.

    Key Insight: A high P/E ratio often reflects powerful optimism about a company's future. Investors are betting its earnings will grow so quickly that today's high price will look like a bargain down the road.

    You see this kind of optimism all the time in fast-moving sectors like technology or biotech, where a single innovation can lead to explosive profit growth. But a high P/E also comes with a lot of risk. If that rocket-ship growth doesn't happen, the stock can get hammered as its valuation crashes back to earth.

    For this reason, a sky-high P/E can be a red flag for an overvalued stock, one that's fueled more by hype than solid fundamentals. Before you even think about investing, you have to do a deep dive into its business model and what makes it special.

    Unpacking a Low P/E Ratio

    On the flip side, a low P/E ratio means the market is taking a more conservative view of a company's earnings. Investors are paying less for each dollar of profit, and that can happen for a couple of key reasons.

    A low P/E might be signaling a classic "value" stock—a solid, profitable company that the market has just overlooked for now. For investors who are willing to do their homework, these can be incredible opportunities to buy great businesses at a discount.

    But a low P/E can also be a serious warning sign. The market might be pricing in some very real concerns:

    • Slowing Growth: The company could be in a dying industry or losing ground to competitors.
    • Hidden Problems: There might be skeletons in the closet, like massive debt, shaky management, or other operational headaches.
    • Cyclical Slumps: Industries like manufacturing or energy often see their P/E ratios drop during economic downturns.

    To get a better handle on how Wall Street views these valuations, it's worth learning how stock analyst ratings are put together, since they often lean heavily on metrics just like the P/E ratio.

    The Power of Context and Comparison

    A P/E ratio by itself is almost useless. To make it a powerful tool, you absolutely must compare it against the right benchmarks.

    Here are the most important comparisons to make:

    1. Industry Average: A tech company with a P/E of 35 might be perfectly normal, but a utility company with that same ratio would be seen as absurdly expensive. You always have to compare a company's P/E to its direct rivals.
    2. Historical Performance: How does the company’s current P/E compare to its own five- or ten-year average? If a stock's P/E is way higher than its historical norm, it might be overvalued relative to its own past performance.
    3. Broad Market Average: Stacking a stock’s P/E against an index like the S&P 500 gives you a general feel for its valuation. For example, the S&P 500’s 10-year P/E ratio hit 34.3 as of March 2025, which is about 67.5% above its modern historical average of 20.5. This context helps you figure out if a stock's price is out of step with the wider market.

    Just when you think you've got the price-to-earnings ratio all figured out, you discover it’s not just one metric—it's more like a family of them. To really get a handle on a company's valuation, you need to know which version you're looking at. Each one tells a slightly different story by looking at earnings from different angles: past, present, and future.

    Getting comfortable with these variations is a game-changer for doing a proper analysis.

    This infographic gives you a quick visual guide for how to think about P/E values in general.

    Image

    Think of it as a cheat sheet that sorts P/E ratios into low, average, and high buckets, offering a fast way to gauge if a stock might be undervalued or flying a little too close to the sun.

    Trailing P/E: The Rearview Mirror

    The most common version you’ll bump into is the Trailing P/E. You'll often see it written as P/E (TTM), which stands for "trailing twelve months." This is the classic formula we've been talking about, using a stock's current price divided by its actual, reported earnings per share over the last year.

    Its biggest strength is that it's based on cold, hard facts. The numbers come from real, historical performance, not some analyst's guess. But that's also its main weakness—it's entirely backward-looking. A company's past success is no guarantee of future results, so a trailing P/E might not catch a big growth spurt or a painful downturn that's just around the corner.

    Forward P/E: The Crystal Ball

    The Forward P/E flips the script. It divides the current stock price by the estimated future earnings per share for the next year. These forecasts are put together by Wall Street analysts who are crunching numbers on industry trends, company guidance, and the overall economy.

    Key Insight: The Forward P/E is the go-to metric for growth investors. It helps you value a company based on its expected potential, not just where it's been.

    The obvious advantage here is its focus on the future, which is what investing is all about. The catch? It’s built on predictions, and predictions can be wrong. If those analyst estimates are too rosy, a stock that looked cheap on its forward P/E can suddenly seem way too expensive when reality hits.

    Shiller P/E: The Long-Term Stabilizer

    To smooth out the wild swings that can happen in the economy, economists came up with the Cyclically Adjusted Price-to-Earnings (CAPE) ratio, also known as the Shiller P/E. This is a pretty powerful tool. It compares the current price to the average inflation-adjusted earnings from the previous 10 years. This long-term view helps iron out the peaks and valleys of business cycles, giving you a much more stable picture of a company's valuation.

    For example, during the 2008 financial crisis, corporate earnings cratered by nearly 90% in just one year. This sent the standard P/E ratio soaring above 120 even as stock prices were tanking. The CAPE ratio is designed to correct for these extreme, temporary situations. You can find more analysis on how CAPE provides a stable view of market valuation to see it in action. The main knock against it is that it can be slow to react to truly fundamental changes in an industry or a company's business model.

    To put it all together, let's look at these different P/E ratios side-by-side. Each one has its place in an investor's toolkit, and knowing when to use which is key.

    A Head-to-Head Comparison of P/E Ratio Types

    P/E Ratio Type Earnings Basis Primary Advantage Key Limitation
    Trailing P/E (TTM) Last 12 months of actual, reported earnings Based on real, historical data; reliable and easy to find. Backward-looking; may not reflect future prospects.
    Forward P/E Next 12 months of estimated earnings Forward-looking; focuses on a company's future potential. Based on predictions that can be inaccurate or overly optimistic.
    Shiller P/E (CAPE) Average inflation-adjusted earnings over the last 10 years Smooths out business cycles for a stable, long-term view. Slow to react to fundamental business or industry changes.

    Ultimately, no single P/E ratio tells the whole story. By using them together, you can get a more well-rounded and nuanced view of a company's true value.

    Common Blind Spots and Pitfalls of the P/E Ratio

    While the price-to-earnings ratio is a fantastic starting point, relying on it alone is a classic—and costly—investor mistake. It’s a powerful tool for a quick valuation check, but it has significant blind spots that can lead you astray if you’re not careful. Think of it as one instrument on your dashboard, not the entire navigation system.

    For a complete and reliable financial check-up, smart investors always pair the P/E ratio with other metrics.

    It Ignores Debt and Accounting Tricks

    One of the biggest pitfalls of the P/E ratio is that it tells you absolutely nothing about a company’s debt. A business could have a very attractive P/E ratio but be drowning in liabilities, making it a much riskier investment than the ratio suggests. Heavy debt can easily choke out future earnings.

    On top of that, the "E" in P/E can be massaged. Creative accounting practices can temporarily inflate earnings per share, making a company’s valuation look much more appealing than it really is. This is why you must look beyond the P/E and scrutinize the balance sheet and cash flow statement.

    Key Takeaway: A low P/E ratio is not always a bargain. It might be hiding a mountain of debt or accounting red flags that require a deeper investigation.

    Another major blind spot is its complete uselessness for companies that aren't profitable. If a business has negative earnings—meaning, it’s losing money—the P/E ratio is undefined and tells you nothing. This is a common scenario for startups and high-growth companies reinvesting every dollar back into the business.

    Comparing Apples to Oranges

    One of the most critical mistakes an investor can make is comparing P/E ratios across completely different industries. A tech company and a utility company operate in fundamentally different worlds with vastly different growth prospects and capital needs. A P/E of 25 might be a steal for a fast-growing software firm but alarmingly expensive for a slow-growing utility.

    To use the P/E ratio effectively, you have to compare apples to apples. Always check these two things:

    • Against Direct Competitors: How does the company’s P/E stack up against others in its specific industry?
    • Against its Own History: Is its current P/E ratio higher or lower than its five-year average? This tells you if it's cheap or expensive for itself.

    Ultimately, understanding the price-to-earnings ratio is about using it as a screener to identify potentially interesting stocks. The real work begins after that, as you'll need to use other metrics to build a complete picture of the investment. This holistic approach is essential when learning how to build an investment portfolio that stands the test of time.

    Common Questions About the Price to Earnings Ratio

    Once you get the hang of the P/E ratio, a bunch of practical "what if" scenarios always seem to pop up. These are the real-world questions that come from trying to actually apply the metric. Let's walk through some of the most common ones I hear from investors.

    What Does It Mean if a Company Has No P/E Ratio?

    Ever look up a stock and see "N/A" where the P/E ratio should be? It almost always means one thing: the company has negative earnings. In plain English, it's losing money.

    Because the "Earnings" part of the P/E formula is zero or negative, you simply can't calculate a meaningful ratio. This is super common with young, high-growth startups or companies trying to pull off a major turnaround. They're often pouring every dollar they have (and then some) back into the business to fuel growth.

    What Is a Good P/E Ratio in Today's Market?

    This is the million-dollar question, but the honest answer is pretty unsatisfying: there is no single "good" P/E ratio. A good P/E is all about context.

    What looks "good" completely depends on a few things:

    • The Industry: A P/E of 15 might be totally normal for a slow-and-steady utility company. But for a fast-growing tech firm, that same P/E would probably set off alarm bells.
    • Growth Prospects: Companies that investors believe will grow their earnings rapidly in the future will almost always have higher P/E ratios. People are paying a premium today for tomorrow's expected growth.
    • The Overall Market: When the market is in a full-blown bull run, everything gets more expensive, and average P/E ratios tend to climb across the board.

    For example, taking a peek at the global market gives us some much-needed perspective. As of July 30, 2025, the all-world stock market benchmark had a P/E of 20.98, which is a bit higher than its five-year average. The U.S. market, on the other hand, was sitting at a loftier P/E of 25.75—well above its own historical norms. That suggests a pricier, more optimistic market environment. You can discover more insights about global market valuations on worldperatio.com.

    The key is never to look at a P/E in a vacuum. You always, always have to compare it to its direct competitors, its own historical P/E range, and the average for the broader market.

    How Often Should I Check a Company's P/E Ratio?

    The stock price (the "P") bounces around every second the market is open, but the earnings (the "E") are only updated once a quarter. For anyone with a long-term mindset, getting worked up over daily P/E swings is just a waste of time and energy.

    A much more sensible approach is to check in on the P/E ratio quarterly, right after the company releases its fresh earnings report. This gives you a much clearer picture of how the valuation is trending without getting lost in all the daily noise. Making this a regular part of your investment check-up is a huge step to master the investment decision-making process. It keeps you focused on the fundamentals, not the market's fleeting moods.


    At Investogy, we cut through the noise by sharing the "why" behind every move in our real-money portfolio. Subscribe to our free weekly newsletter to see how we apply concepts like the P/E ratio to make confident, long-term investment decisions. Join us for free at https://investogy.com.

  • ETF vs Mutual Funds A Practical Investor’s Guide

    ETF vs Mutual Funds A Practical Investor’s Guide

    When you boil it all down, the fundamental difference is this: ETFs trade like stocks with real-time pricing, giving you flexibility and better tax efficiency. On the other hand, mutual funds are priced just once per day, which often suits hands-off, long-term investors just fine.

    Your choice really hinges on a simple question: Do you value hands-on trading control, or do you prefer a simplified, set-it-and-forget-it approach?

    ETF vs. Mutual Funds: The Key Differences

    Image

    It’s easy to get lost in the weeds when comparing ETFs and mutual funds. But honestly, the most critical distinctions are pretty straightforward and they directly impact how you manage your money. The real heart of the matter is their trading structure—when you can actually buy or sell them.

    This one operational difference creates a ripple effect, influencing everything from your costs to your tax bill. Think about it. For an active investor who wants to react to market news right now, being able to trade an ETF at 11:00 AM is a massive advantage. But for someone making automatic monthly contributions to their 401(k), a mutual fund's end-of-day price works perfectly.

    ETF vs. Mutual Fund At a Glance

    To put things in perspective, let's start with a high-level summary. This table cuts through the noise and highlights the main characteristics that separate these two hugely popular investment vehicles.

    Feature Exchange-Traded Funds (ETFs) Mutual Funds
    Trading Throughout the day on an exchange, like a stock Once per day at the Net Asset Value (NAV)
    Pricing Real-time market price that fluctuates End-of-day NAV price, set after market close
    Typical Cost Lower expense ratios, plus brokerage commissions Higher expense ratios, may have sales loads
    Tax Efficiency Generally higher (fewer capital gains passed on) Generally lower (can distribute capital gains)
    Best For Active traders, tax-conscious investors Hands-off investors, 401(k) and retirement plans

    This table gives you a solid starting point, but the real-world implications of these differences are where things get interesting. Let’s dig a little deeper.

    Liquidity and Flexibility in Action

    Liquidity—or how easily you can buy or sell an asset—is a huge differentiator here. We saw a powerful real-world test of this during the extreme volatility of the COVID-19 pandemic.

    As markets went on a rollercoaster ride, ETFs provided continuous price discovery and liquidity. This allowed investors to trade exactly when they felt they needed to. In contrast, many mutual funds were stuck, only able to execute trades at the day's closing price—a significant handicap during such fast-moving market chaos. You can find more analysis on this kind of event over at Ultimus Fund Solutions.

    How Fund Structure Impacts Your Bottom Line

    When you're picking between an ETF and a mutual fund, what's happening behind the curtain is just as critical as the fund's name. The internal plumbing—how these funds are built and traded—has a direct impact on your costs, your tax bill, and ultimately, how much money you actually make. It’s a textbook case of function following form.

    The real divergence is in how shares get created and redeemed. This process is the secret sauce that often gives ETFs a huge structural advantage, especially when it comes to tax efficiency. When you buy or sell an ETF, you're usually just trading with another investor on the stock market, plain and simple.

    That peer-to-peer trading is clean. But for big institutional players, it's a different game. They use a special "creation and redemption" mechanism, letting them swap a whole basket of the underlying stocks directly for new ETF shares, or vice-versa. This "in-kind" swap is a non-taxable event, which is a massive win. It lets the ETF sidestep realizing capital gains that it would otherwise have to pass down to you.

    Mutual Funds and Shared Tax Burdens

    Mutual funds don't work that way. When investors decide to sell their shares, the fund manager often has to sell some of the fund's underlying stocks to get the cash to pay them out. This selling activity can trigger capital gains for the entire fund.

    Here's the kicker: even if you haven't sold a single share yourself, you could get hit with a capital gains distribution—and a surprise tax bill—just because a bunch of other investors decided to cash out. This "shared tax burden" is a fundamental, and frankly annoying, drawback of the mutual fund structure if you're investing in a regular taxable account.

    This infographic breaks down how the trading process differs, which affects when your order actually gets priced and completed.

    Image

    As you can see, ETF pricing is live and dynamic throughout the day, just like a stock. Mutual funds? They're priced just once, at the end of the trading day.

    Why This Matters for Your Portfolio

    So, what's the real-world takeaway from all this technical jargon? The ETF structure essentially gives you a protective shield from the trading decisions of other investors. You get much more control over when you realize your own capital gains—which is typically only when you decide to sell your ETF shares.

    Let's play out a scenario:

    • In an ETF: You buy shares and hold them for five years. You won't owe a dime in capital gains tax until the day you sell.
    • In a mutual fund: You buy and hold. But if the fund sees a wave of redemptions one year, the manager might be forced to sell appreciated stocks. This triggers a capital gains distribution that lands on your lap, and you'll owe taxes on it even though you did nothing.

    This single structural difference is a core reason so many long-term investors now lean heavily toward ETFs in their taxable brokerage accounts. Over decades, minimizing these tax drags can compound into a significant amount of extra money in your pocket, not the government's.

    Comparing the True Cost of Investing

    Image

    When you get into the ETF vs. mutual fund debate, the conversation almost always lands on one simple assumption: ETFs are cheaper. And while that’s generally true on the surface, the "true cost" of investing is a lot more nuanced than a single number on a fact sheet. The real answer often comes down to your personal investing habits.

    The most obvious fee is the expense ratio—that annual percentage skimmed off the top to cover a fund’s operating costs. ETFs, especially the big passive index trackers, almost always win this fight with rock-bottom fees. But that’s just where the cost story begins.

    The Hidden Costs of Trading

    For ETFs, trading costs can quietly pile up, particularly if you’re an active investor. Every time you buy or sell an ETF, you can run into a couple of costs that mutual fund investors don't have to worry about:

    • Brokerage Commissions: A lot of brokers now offer commission-free trading for many ETFs, but it's not a universal guarantee. If you're trading frequently on a platform that still charges commissions, those little fees can take a serious bite out of your returns over time.
    • The Bid-Ask Spread: This is the tiny gap between the highest price a buyer is willing to pay (the bid) and the lowest price a seller will take (the ask). For a super-popular ETF like SPY, this spread is practically zero. But for less-traded, niche funds, it can be a meaningful hidden cost on every single trade.

    Mutual funds, on the other hand, have their own set of potential landmines. You have to watch out for sales loads, which are nasty commissions paid to a broker that can be as high as 5% or more. Then there are 12b-1 fees, which are baked in to cover marketing expenses. The trick here is to stick to no-load mutual funds, which completely sidestep that big upfront sales commission.

    So, Who Wins on Cost?

    It really depends on your strategy. An active trader jumping in and out of ETFs dozens of times a year might see their costs climb from spreads and commissions. At the same time, a long-term investor who unknowingly buys a mutual fund with a high sales load could end up paying way more than they should.

    The most cost-effective path is often determined by your behavior. A long-term, buy-and-hold investor in a no-load, low-cost index mutual fund could face nearly identical costs to someone holding a similar ETF, making the choice less about fees and more about structure and convenience.

    Research backs this up. While ETFs do tend to have lower expense ratios, that doesn't automatically translate to better net performance once all costs are considered. One study found that after accounting for all fees, ETFs still produced a net annualized CAPM alpha of about -0.75%, which wasn't drastically better than the -1.13% for actively managed mutual funds.

    The big takeaway? Neither vehicle is a magic bullet for beating the market after costs. It reinforces the simple truth that you need to be vigilant about minimizing every single fee you have control over. To sharpen your strategy further, check out our guide on essential stock market investing tips.

    Understanding Tax Efficiency in Your Portfolio

    Taxes are one of those silent killers in your portfolio. If you’re not careful, they can slowly eat away at your hard-earned returns over decades. When you put an ETF and a mutual fund side-by-side, tax efficiency is often where ETFs pull ahead—but this advantage isn't a given in every situation. It’s not just marketing talk; it's a real benefit that’s baked right into their structure.

    So, where does this "superior" tax efficiency come from? It’s all about how ETFs handle buying and selling. When an ETF manager needs to rebalance the fund, they don't usually sell stocks for cash on the open market. Instead, they can swap shares directly with large institutions in what's called an "in-kind" transfer. This simple but brilliant process sidesteps a capital gain, which means the fund isn’t forced to pass a taxable event down to you, the individual investor.

    How Capital Gains Distributions Work

    Contrast that with a typical actively managed mutual fund. When investors decide to cash out, especially in large numbers, the fund manager often has no choice but to sell appreciated stocks to raise the cash. This sale triggers capital gains, and by law, the fund must distribute those gains to all remaining shareholders at the end of the year.

    This can lead to a seriously frustrating situation. You might get hit with a "phantom" capital gains distribution—and a surprise tax bill that comes with it—even if you never sold a single share of your mutual fund. You're literally paying taxes because of what other investors decided to do.

    The Right Account for the Right Fund

    This tax benefit is a huge reason to lean towards ETFs, but there's a big asterisk here: it only matters in a taxable brokerage account.

    If you're investing inside a tax-advantaged retirement account like a 401(k), Roth IRA, or traditional IRA, all the growth is already tax-deferred or completely tax-free. Since you aren't paying annual capital gains taxes within these accounts anyway, the structural tax advantage of an ETF becomes totally irrelevant.

    Your choice really needs to be contextual:

    • Taxable Brokerage Account: This is where the tax efficiency of an ETF really shines. It can lead to significantly higher after-tax returns over the long haul. If you're investing outside of a retirement account, this is a major point in the ETF's favor.
    • Retirement Account (IRA, 401(k)): The tax difference is a moot point. Here, your decision should come down to other factors, like which funds are available, what the expense ratios are, and how easily you can set up automatic investments.

    To really get a handle on how different types of investment income and gains are taxed, it’s worth diving into this guide on investment tax basics covering capital gains and dividend income tax implications. Remember, where you invest is just as critical as what you invest in.

    Active vs Passive: The Real Performance Driver

    Image

    The debate over ETF vs mutual funds often misses the forest for the trees. While structures, fees, and tax rules are important pieces of the puzzle, the real engine behind your long-term returns isn't the wrapper—it's the investment strategy inside.

    The central decision you face isn't just about choosing a fund type. It’s about choosing a philosophy: active management or passive indexing. This choice will have a far greater impact on your portfolio's performance over time.

    Active management is the classic approach. A fund manager and their team of analysts try to beat the market by hand-picking stocks, bonds, or other assets they believe will outperform. For this expertise, you pay a higher fee. This strategy is available in both mutual funds and, more and more, in ETF formats.

    Passive investing, or indexing, is the complete opposite. Instead of trying to find a needle in the haystack, these funds simply aim to own the whole haystack. A passive fund just buys and holds all the stocks in a market index, like the S&P 500.

    The Great Shift in Investor Money

    This active vs. passive distinction has completely reshaped the investment world. For decades, investors have been pouring money into low-cost index funds, and the numbers are staggering.

    The evidence is undeniable. Indexed funds recently held $16.79 trillion in assets, officially blowing past the $15.88 trillion held by their active counterparts. If you want to see the data for yourself, you can learn more about this critical shift in investor preference on ici.org.

    This isn't just a blip on the radar; it's an ongoing tidal wave. Investors are voting with their wallets, and the message is loud and clear: they want cost-efficient, market-mirroring strategies.

    Why Performance Favors Passive

    So, what's behind this massive migration to passive? It boils down to a simple, hard truth: most active managers fail to consistently beat their benchmarks, especially after their higher fees are factored in.

    Decades of performance data repeatedly show that a low-cost index fund is one of the most reliable ways to build wealth. By simply accepting the market's return, you are statistically likely to outperform the majority of professionals who are paid handsomely to try and do better.

    This reality reframes the entire "ETF vs. mutual fund" discussion. The better question to ask is, "Should I be an active or passive investor?" You can find great, low-cost index funds in both structures.

    While our focus here is on these pooled funds, some investors do build their portfolios with individual stocks. It's always smart to weigh all your options, and it’s worth exploring how individual stocks compare to ETFs as part of your research.

    Ultimately, mastering the choice between active and passive strategies is a cornerstone of our own approach at Investogy. You can see exactly how we navigate this decision in our guide to master the investment decision-making process.

    Matching the Right Fund to Your Investment Style

    So, after all that, what’s the final verdict in the ETF vs. mutual fund debate? The truth is, there isn't one. The best choice is intensely personal—it all boils down to your investing personality, where you're putting the money, and what you’re trying to achieve long-term.

    This isn't a step to gloss over. Getting this match right is where the rubber meets the road, and it underscores the importance of due diligence to make sure your pick actually works for you. Let's walk through a few common investor profiles to see where you might fit.

    When an ETF Is Likely Your Best Bet

    For the hands-on investor who lives for control, flexibility, and efficiency, ETFs are tough to beat. You’re probably an ETF person if this sounds like you:

    • You're an active trader. If you want the power to react to market news the second it breaks, place limit orders to snag a specific price, or set stop-losses to protect your downside, you need the intraday tradability of an ETF. It’s non-negotiable.
    • You're investing in a taxable brokerage account. This is where ETFs really shine. Their structure is just flat-out better at minimizing capital gains distributions each year. Over many years, that tax efficiency can make a huge difference in your actual, take-home returns.
    • You're obsessed with low costs. While great low-cost mutual funds are out there, the biggest, most popular broad-market ETFs often have the absolute rock-bottom expense ratios you can find—sometimes just a few hundredths of a percent.

    For the self-directed investor managing their own taxable portfolio, the combination of intraday liquidity, tax efficiency, and ultra-low costs makes an ETF an almost automatic choice for core holdings.

    When a Mutual Fund Makes More Sense

    Don't count out the old guard just yet. Mutual funds still have a solid role to play, particularly for investors who value simplicity and automation above all else. A mutual fund might be the clear winner if:

    • You're just starting out. Buying mutual funds can feel much more straightforward for a beginner. You can invest an exact dollar amount—say, $100—directly with the fund company, without navigating a brokerage screen or worrying about buying whole shares.
    • You're automating your retirement savings. There's a reason mutual funds are the workhorse of most 401(k) plans. They are perfect for setting up automatic, recurring investments into an IRA. You just set your monthly dollar amount and forget it.
    • You prefer a "set-it-and-forget-it" strategy. The fact that mutual funds only price once per day is a feature, not a bug, for many. It removes the temptation to obsessively check your portfolio or react to every little market blip, which helps enforce disciplined, long-term behavior.

    At the end of the day, both are fantastic tools for building wealth. Choosing the right vehicle is just one piece of the puzzle as you figure out how to build an investment portfolio that's built to go the distance.

    Lingering Questions About ETFs And Mutual Funds

    Even after laying out all the details, you might still have a few questions rattling around in your head. It's completely normal. Sometimes, tackling those last points of confusion is what really cements your understanding and helps you make the final call.

    So, let's clear up some of the most common questions I hear when people are weighing ETFs against mutual funds.

    Are All ETFs Just Passive Index Funds?

    Nope, and this is a huge misconception. It's an easy mistake to make, though. The first ETFs to hit the market, and arguably still the most famous ones, were built to passively track big indexes like the S&P 500. They were cheap, simple, and they exploded in popularity.

    But the game has changed. Today, the market is flooded with actively managed ETFs. These are funds where a real, live portfolio manager is picking stocks, trying to outperform the market, just like in an active mutual fund.

    Honestly, the rise of active ETFs just muddies the waters even more. It reinforces a point I've been making all along: the wrapper—ETF or mutual fund—is becoming less important than what's inside.

    The real debate isn't about the fund structure (ETF vs. mutual fund). It's about the investment philosophy driving it: are you an active or a passive investor? That's the decision that truly matters.

    Which One Is Better For My Retirement Account?

    Inside a tax-sheltered account like a 401(k) or an IRA, one of the ETF's biggest selling points—its tax efficiency—is completely off the table. Since you aren't paying capital gains taxes in these accounts anyway, that advantage disappears.

    So, the choice really boils down to logistics and what's available to you.

    • Mutual Funds: These are the bread and butter of most 401(k) plans. They're built for "set it and forget it" investing, making it dead simple to set up automatic, recurring contributions every payday.
    • ETFs: You'll find these more in IRAs, where you have the freedom to buy almost anything. They work perfectly fine, but you might have to be a bit more hands-on with reinvesting dividends or making those regular investments, since it's more like buying a stock.

    For retirement, my advice is simple: don't get too hung up on the structure. Focus on finding a low-cost fund that gives you the asset allocation you want. Both ETFs and mutual funds are fantastic tools for building long-term wealth in a tax-advantaged account.


    Ready to see how these principles work in a real-money portfolio? Subscribe to Investogy for our free weekly newsletter. We share the "why" behind every buy and sell decision, showing you how we're building wealth one investment at a time. Join us at https://investogy.com.

  • How to Build an Investment Portfolio That Lasts

    How to Build an Investment Portfolio That Lasts

    So, you want to build an investment portfolio. It's not about memorizing stock tickers or chasing the latest hot trend. It really comes down to a simple, disciplined process: figuring out your goals, knowing how much risk you can stomach, picking the right assets, and then mixing them up to smooth out the ride.

    This is how you build a real plan that connects your financial dreams to what you actually do with your money.

    Your Framework for Building an Investment Portfolio

    Image

    Jumping into building an investment portfolio is your first real move toward financial independence. Forget about what the talking heads on TV are shouting about. This is about creating a methodical, personalized blueprint for creating wealth—one that’s built for your life.

    This guide will give you a practical framework for the whole process. We'll start with the stuff you absolutely need to understand before you invest a single dollar. With this foundation, you'll see that building a portfolio that actually grows over time is something anyone can do if they're willing to learn the basics.

    Connecting Goals to Strategy

    First things first: you need to turn those vague financial dreams into solid, time-based targets. Are you saving for retirement in 30 years? A down payment on a house in five? Your kid’s college tuition in 15? Your timeline is the single most important piece of the puzzle. It dictates everything else.

    A long-term goal like retirement gives you the runway to take on more risk for potentially bigger returns. But if you’re saving for a car you want to buy next year, you need to be much more conservative to protect your cash. To get this right, you have to master the investment decision-making process, which is all about confidently prioritizing and executing your strategy.

    Key Takeaway: A solid portfolio is built on clear, time-bound goals. You can't pick the right road if you don't know where you're going.

    The Pillars of a Strong Investment Portfolio

    Before you start picking individual stocks or funds, you need to get a handle on the core concepts that make a portfolio strong and resilient. Think of these as the bedrock of any smart investment strategy.

    To really get started, you need to be familiar with a few key ideas. These are the fundamental components that every successful investor, from a beginner to a seasoned pro, relies on to build and manage their wealth.

    The Pillars of a Strong Investment Portfolio

    Component What It Is Why It's Essential
    Asset Classes The main building blocks of any portfolio, like stocks, bonds, and real estate. Each class behaves differently, offering a unique mix of risk and potential return.
    Risk Tolerance Your personal comfort level with the market's ups and downs. It ensures your portfolio matches your emotional and financial ability to handle volatility.
    Diversification The old saying: "Don't put all your eggs in one basket." Spreading investments around helps cushion the blow when one part of the market takes a hit.
    Time Horizon How long you have until you need to pull your money out. A longer timeline generally lets you be more aggressive and aim for higher growth.

    Grasping these pillars is what turns investing from a pure gamble into a calculated plan. It's the difference between just randomly buying things and strategically assembling the right tools to build the financial future you want.

    Defining Your Goals and Personal Risk Profile

    Image

    Before you even think about looking at a stock or a bond, the most important work happens right between your ears. You have to get brutally honest about why you're investing in the first place and how much risk you can actually stomach.

    Getting this groundwork right is what separates disciplined investors from those who panic and sell at the first sign of trouble. We need to move beyond vague ideas like "I want to get rich" and get specific. Your timeline, more than anything else, will dictate your entire investment strategy.

    Clarifying Your Financial Goals

    Think of your goals as destinations on a road trip. A quick drive across town needs a very different plan—and a different vehicle—than a six-month, cross-country adventure. Your investing approach has to match the journey.

    Let's look at two real-world examples:

    • Scenario A: The Future Homeowner. Sarah is 29 and has her sights set on buying a house. Her target is a $70,000 down payment, and she wants to have it in the next five years. Because her timeline is short, protecting the money she has is just as crucial as growing it.
    • Scenario B: The Retirement Planner. David is 40 and is laser-focused on building a nest egg for retirement, which is still 25 years away. With decades on his side, he can afford to take on more market risk for the shot at much greater long-term growth.

    Sarah’s portfolio needs to be more conservative, probably leaning heavily on less volatile assets like bonds. David, on the other hand, can build a portfolio dominated by stocks, which have historically delivered much higher returns over long stretches. If you want to dive deeper into this mindset, it's worth understanding what long-term investing truly means and how it uses time as your greatest ally.

    Your investment timeline is your most valuable asset. A longer timeline allows you to ride out market downturns and benefit from the power of compounding, while a shorter timeline demands a more cautious approach to protect your principal.

    Assessing Your Personal Risk Profile

    Once you know your destination, you need to figure out what kind of driver you are. This isn't just a simple quiz; it's a gut check that combines two critical pieces: your risk capacity and your risk tolerance.

    • Risk Capacity: This is the financial side of the coin—your actual ability to absorb a loss without derailing your life. It's objective. Someone with a stable, high-paying job and no debt has a much higher capacity for risk than someone working an unstable job with a mountain of financial commitments.
    • Risk Tolerance: This is the emotional side. It’s completely subjective. How would you feel if you saw your portfolio drop by 20% in a single month? Would you see it as a buying opportunity, or would you be fighting the urge to hit the sell button?

    Be honest with yourself here. It’s easy to call yourself an aggressive investor when the market is hitting all-time highs. Your true tolerance only shows up when things get ugly. Imagine logging into your account and seeing your hard-earned $50,000 suddenly worth $40,000. Your gut reaction to that scenario is a pretty powerful indicator of your real risk tolerance.

    Finding Your Investor Type

    Based on your goals and your honest risk assessment, you can start to see where you land on the investor spectrum. This isn't about putting you in a box; it's about creating a framework to keep you on track.

    Common Investor Profiles

    Investor Type Typical Time Horizon Risk Tolerance Potential Portfolio Mix
    Conservative 1-5 years Low 80% Bonds / 20% Stocks
    Moderate 5-15 years Medium 60% Stocks / 40% Bonds
    Aggressive 15+ years High 80% Stocks / 20% Bonds

    Pinpointing your profile creates the discipline you need to build a portfolio you can actually live with. Nailing this down is the secret to staying the course when the markets inevitably get choppy, ensuring you don't get sidetracked on the way to your financial destination.

    Understanding the Building Blocks of Your Portfolio

    Image

    Alright, you've got your financial goals mapped out. Now it's time to get familiar with the tools you'll use to get there. Think of building a portfolio like building a house. You wouldn't use just one material for the whole thing, right? You need a solid foundation, some flexible framing, and a roof that protects you from the elements.

    In the investing world, we call these materials asset classes. Each one has a specific job to do. Mixing them the right way is how you build a portfolio that can handle market storms while still growing your wealth.

    Let's break down the core building blocks you'll be working with.

    Stocks: The Engine of Growth

    When you buy a stock, also called an equity, you're buying a tiny piece of a company. If that company crushes it—grows its profits, expands its market—the value of your piece can go up. A lot.

    For most people, stocks are the main engine for long-term growth. History shows they've beaten most other asset classes over long stretches, which is why they're crucial for big goals like retirement.

    Of course, that potential for high returns comes with higher risk. Stock prices can swing wildly based on everything from a bad earnings report to a tweet. That volatility is exactly why they’re best for investors who have time on their side and can stomach the ups and downs without panicking. Digging into stock valuation methods can help you understand what separates a potentially great company from a dud.

    Bonds: The Stabilizer

    If stocks are your portfolio's engine, think of bonds as the suspension and brakes. When you buy a bond, you're lending money to a government or a corporation. They promise to pay you interest along the way and give you your original investment back on a specific date. Simple as that.

    Bonds, or fixed-income securities, play a huge role in keeping your portfolio steady.

    • Steady Income: They generate a predictable stream of cash from interest payments.
    • Less Volatility: Bond prices are generally much less jumpy than stock prices.
    • Diversification Power: This is the big one. Bonds often zig when stocks zag. During a recession, for example, investors tend to rush into the safety of government bonds, which can push their prices up just as stock prices are tanking. This balancing act is a cornerstone of smart investing.

    Cash and Equivalents: The Safety Net

    This is the most basic asset class. It’s the cash in your savings account, CDs, or a money market fund. The main purpose of cash isn't to make you rich; it’s about safety and liquidity.

    You need cash for two key reasons: to have an emergency fund for life's curveballs, and to have "dry powder" ready to jump on investment opportunities when they pop up. Sure, cash won't grow much and will get eaten away by inflation over time, but it’s your ultimate source of stability.

    I've found that each asset class plays a psychological role, too. Stocks give you the optimism for growth. Bonds give you the peace of mind to not sell everything in a panic. And cash gives you the security to make rational decisions instead of fearful ones.

    Alternative Investments: The Wild Cards

    Once you've covered the basics, there's a whole world of alternative investments. These can be a great way to diversify even further because their performance often has little to do with what the stock and bond markets are doing.

    Some common alternatives include:

    • Real Estate: This could be owning a rental property or investing in Real Estate Investment Trusts (REITs).
    • Commodities: Think raw materials like gold, oil, or even coffee. Gold, for instance, has long been a go-to for investors worried about inflation or a weakening dollar.
    • Private Equity: This means investing in companies before they go public on a stock exchange.

    These assets can be more complicated and harder to sell quickly, but they can offer returns that you just can't get from traditional stocks and bonds. The trick is to really understand what you're getting into and how it fits with the rest of your strategy.

    At the end of the day, a disciplined, diversified approach is what helps investors ride out the market's mood swings. The data backs this up. UBS's Global Investment Returns Yearbook, which crunches market data going back 125 years, consistently shows that a strategic mix of assets is the key to managing risk and boosting long-term returns. Investors who stick to a plan almost always do better than those who try to make big, speculative bets. You can see more on how these long-term trends shape wealth in the full 2025 yearbook analysis.

    Designing Your Portfolio and Diversifying Smartly

    Alright, you've figured out your goals and know how much risk you can stomach. Now for the fun part—this is where we move from planning to doing. We're going to tackle asset allocation, which is just a fancy way of saying "how you split up your money."

    Honestly, this single decision will have more impact on your long-term results than trying to pick the next hot stock. It's all about deciding how much of your money goes into different buckets: stocks, bonds, and maybe some alternatives.

    Constructing Your Core Portfolio

    The right mix of assets is a direct reflection of your timeline and your comfort with market swings. A classic, battle-tested starting point is the 60/40 portfolio. That's 60% in stocks for growth and 40% in bonds for a bit of a safety net. For many, it's been a solid balance of growth and stability over the years.

    But your personal situation is what really matters here. If you're young with decades to go until retirement, you might feel comfortable with an 80/20 or even a 90/10 split, leaning heavily into stocks for maximum growth. On the flip side, if you're getting close to retirement, you might flip that to something like a 30/70 mix, where protecting your capital is the top priority.

    Think of these as templates, not rigid rules:

    • Conservative (Short-Term Goals):
      • 20% Stocks (just a little something for growth)
      • 70% Bonds (for stability and reliable income)
      • 10% Cash (for emergencies and quick access)
    • Moderate (Medium-Term Goals):
      • 60% Stocks (for balanced, steady growth)
      • 40% Bonds (to protect against the worst of the market dips)
    • Aggressive (Long-Term Goals):
      • 80% Stocks (aiming for the highest possible growth)
      • 20% Bonds (enough to smooth out the really rough patches)

    The real key? Pick a mix that lets you sleep at night. You need to be able to stick with the plan, even when the market gets choppy, to see it through to your goals.

    Diversifying Within Each Asset Class

    Real diversification isn't just about owning some stocks and some bonds. That's just the first layer. To build a truly resilient portfolio, you need to diversify within each of those buckets. Buying just one company's stock and one type of bond still leaves you dangerously exposed if something goes wrong with either.

    Let’s break it down. For your stock portion, you want to spread your money across different corners of the market:

    • Large-Cap Stocks: These are the big, established players like Apple or Microsoft. They tend to be less volatile.
    • Small-Cap Stocks: Shares in smaller, up-and-coming companies. They've got more room to grow but come with bigger price swings.
    • International Stocks: Investing in companies outside of your home country is crucial. It helps protect you if your local economy hits a rough patch that doesn't affect the rest of the world.

    The same logic goes for bonds. You can create a more robust bond holding by mixing ultra-safe government bonds with corporate bonds (which offer higher yields for a bit more risk) and international bonds.

    Pro Tip: Look, the easiest way to do this without buying dozens of individual securities is through low-cost index funds or Exchange-Traded Funds (ETFs). For example, a single S&P 500 ETF instantly gives you a piece of 500 of the largest companies in the U.S. It's diversification in a box.

    Exploring Private Markets for Enhanced Diversification

    For those who want to take their diversification to the next level, the private markets are a compelling place to look. For a long time, this world was only open to big institutions, but it's becoming more accessible to individual investors. The big draw? Potential returns that aren't tied to the daily drama of the stock market.

    This means investing in things like private companies, real estate deals, or infrastructure projects that aren't traded on an exchange. And it's not just a niche strategy anymore. A global survey from Adams Street Partners found that a whopping 88% of institutional investors plan to put up to 20% of their portfolios into private market co-investments. They're chasing higher potential returns and unique growth opportunities you just can't find in public stocks. You can get more details on this shift by checking out the 2025 global investor survey.

    The Rebalancing Imperative

    Once you've built your portfolio, the job isn't done. Your portfolio won't stay in perfect balance on its own. Some investments will grow faster than others, causing your carefully chosen allocations to drift. This is where rebalancing saves the day.

    This simple infographic sums up the process perfectly.

    Image

    It’s all about a disciplined cycle: check your portfolio regularly, see if any asset class has strayed too far from your target (say, by more than 5%), and then make the trades to bring it back into line. This process naturally forces you to do what every successful investor aims for: sell high and buy low.

    How to Manage and Rebalance Your Portfolio

    Building your portfolio is just the first step. The real work—and where long-term success is forged—is in the ongoing management. Your portfolio isn't a trophy to put on a shelf; it’s more like a garden that needs regular tending to actually produce a harvest.

    This is where a lot of investors stumble. They either get glued to their screens, reacting to every market hiccup, or they completely forget about their investments for years on end. Neither approach works.

    The secret is finding that sweet spot in the middle. It’s about monitoring your progress without letting the daily noise knock you off course. And, most importantly, it involves the discipline of rebalancing—a simple but incredibly powerful tool for keeping your portfolio aligned with your actual goals.

    The Art of Monitoring Without Micromanaging

    Once your portfolio is live, the urge to check it daily, or even hourly, can be overwhelming. This is a surefire way to make emotional, and likely poor, decisions. The goal isn't to react to every breaking news story but to make sure your overall strategy is still sound.

    For most of us with a long-term view, a quarterly check-in is plenty. This schedule is frequent enough to spot if any part of your portfolio has drifted way off target, but not so frequent that you're tempted to make knee-jerk moves based on normal market volatility. It gives you a clear picture without drowning you in data.

    Why Rebalancing Is Your Secret Weapon

    Over time, your portfolio's original mix will naturally change. Let's say stocks have a fantastic year. Their value grows, and suddenly they make up a much larger slice of your portfolio pie than you intended. Your carefully planned 60/40 stock-to-bond portfolio might have morphed into a riskier 70/30 mix without you doing a thing.

    This "portfolio drift" quietly cranks up your risk exposure. Rebalancing is the process of steering your portfolio back to its original target. It means selling a bit of your outperforming assets and using that cash to buy more of the assets that have been lagging.

    It can feel totally counterintuitive. Why on earth would you sell your winners? Because rebalancing automatically enforces the oldest rule in the investing playbook: sell high and buy low. It’s a disciplined, systematic way to lock in some profits and reinvest them into assets that are temporarily on sale.

    This simple act of trimming your winners is what separates a real strategy from just crossing your fingers and hoping for the best. It’s the engine that keeps your risk level right where you want it.

    Choosing Your Rebalancing Strategy

    There's no single "best" way to rebalance. The right method is simply the one you'll actually stick to. The two most common approaches are based on either time or a predetermined trigger.

    • Calendar-Based Rebalancing: This is as straightforward as it gets. You pick a date on the calendar—quarterly, semi-annually, or annually—and you rebalance on that day, period. For example, you might decide that every January 1st, you'll get your portfolio back in line.
    • Threshold-Based Rebalancing: This method is a bit more dynamic. You set a trigger point, usually a 5% band around your targets. If any single asset class drifts outside that band, it's time to rebalance. So, if your target for U.S. stocks is 40%, you’d rebalance whenever it hits 45% or dips to 35%.

    Many savvy investors use a hybrid model. They check their portfolio on a set calendar (like quarterly) but only rebalance if an asset class has breached their 5% threshold. This approach avoids pointless trading costs while still making sure your risk never gets too far out of whack.

    Adapting to Life and Market Changes

    Your portfolio isn't set in stone; it should evolve as your life does. The aggressive strategy that made sense in your 20s probably isn't the right fit for your 50s. Major life events are a natural time to review your entire strategy. As you get closer to retirement, for instance, it's wise to gradually shift toward a more conservative allocation with a higher concentration in bonds.

    It’s also smart to keep an eye on the bigger picture. Major economic and geopolitical shifts have a real impact on risk and returns. For example, JPMorgan’s recent Global Asset Allocation Views noted that even with a spike in volatility, global stocks gained over 9% in the third quarter. In that kind of environment, advisors were suggesting a moderate risk profile, focusing on specific winners like U.S. tech while also having a preference for certain types of bonds. This shows how a high-level economic view can help you make smarter tweaks to your own portfolio.

    Ultimately, managing your portfolio is a marathon, not a sprint. It’s an ongoing process of small, gentle course corrections, not dramatic, panicked overhauls. By monitoring thoughtfully, rebalancing with discipline, and adapting when life calls for it, you can ensure the portfolio you worked so hard to build will continue to serve you well for years to come.

    Common Investing Questions Answered

    Even with a solid plan, it's completely normal to feel a little intimidated when you're just starting out. I've seen so many new investors get tripped up by the same few questions before they even make their first move. Getting some straight, no-nonsense answers is the key to pushing past that initial hesitation and actually getting your money to work.

    Let's break down some of the most common hurdles I see people face.

    How Much Money Do I Really Need to Start?

    This is probably the biggest myth in all of investing. You can start with so much less than you think. Years ago, you might have needed a few thousand dollars to get a broker to even talk to you, but those days are long gone. Today, tons of modern brokerage platforms have no account minimums.

    Seriously. You can open an account with whatever you're comfortable with, whether that's $1,000 or just $25. Thanks to fantastic tools like fractional shares, you can even own a piece of a powerhouse stock like Amazon or Apple for just a handful of dollars.

    The most important thing isn't the dollar amount you start with; it’s the habit of consistent investing. An investor who puts in $50 every month without fail will almost always end up in a better position than someone who waits years to start with a large lump sum.

    Consistency is what builds real wealth, not a big one-time deposit. Start small, get the hang of it, and build your momentum from there.

    ETFs vs. Mutual Funds: What's the Difference?

    Both Exchange-Traded Funds (ETFs) and mutual funds are incredible inventions for getting instant diversification. At their core, they both bundle hundreds or even thousands of individual stocks or bonds into a single investment you can buy easily. But, they have some key differences in how they operate and what they cost you.

    Here’s a quick rundown of what you need to know:

    Feature ETFs (Exchange-Traded Funds) Mutual Funds
    Trading Trade like a stock throughout the day at changing prices. Priced only once at the end of the trading day.
    Fees Generally have lower expense ratios (annual fees). Often have higher expense ratios and may include sales loads.
    Transparency Holdings are typically disclosed daily, so you know what you own. Holdings are usually disclosed quarterly or semi-annually.
    Minimums Can be bought for the price of a single share, even via fractional shares. Often require a minimum initial investment (e.g., $1,000 or more).

    For most people getting started today, I find the lower costs, greater flexibility, and day-to-day transparency of ETFs make them a much more practical choice for building an investment portfolio from the ground up.

    How Often Should I Check My Investments?

    This is a big one. Compulsively checking your portfolio is a surefire recipe for anxiety and making bad, emotional decisions. The stock market’s daily swings are mostly noise, and reacting to that noise will almost certainly hurt your returns in the long run. You have to remember: you're a long-term investor, not a day trader.

    For most of us who are building wealth over years or decades, a quarterly check-in is plenty. This is frequent enough to see if your portfolio has drifted and needs rebalancing, but infrequent enough to keep you from panicking during a totally normal market dip.

    The goal is to let your well-designed strategy do the heavy lifting, not to second-guess it every time there's a scary headline.


    At Investogy, we show you exactly how this looks in practice with our own real-money portfolio. Subscribe to our free weekly newsletter to see the "why" behind every decision we make. Join us at Investogy and start building your investing conviction.

  • 12 Best Stock Market Analysis Tools for 2025

    12 Best Stock Market Analysis Tools for 2025

    Navigating the stock market without the right tools is like trying to sail the ocean without a compass. The sheer volume of data, from company fundamentals to real-time price action, can be overwhelming. Effective stock market analysis tools cut through this noise, transforming raw data into actionable insights that can inform your trading and investment strategies. Whether you are a long-term value investor performing deep fundamental analysis or a day trader executing rapid-fire technical trades, a dedicated platform is essential for success. This guide is designed to help you find the perfect fit for your specific needs.

    We have meticulously reviewed and compared the top platforms available today, from comprehensive research hubs like Morningstar and Zacks to advanced charting software like TradingView and TC2000. Each review provides a detailed breakdown of key features, pricing structures, and honest pros and cons based on real-world use. We’ll explore who each tool is best for, highlighting specific use cases to guide your decision-making process. Complete with screenshots and direct links, this resource list will equip you with the information needed to select the ideal stock market analysis tools to enhance your research, streamline your workflow, and ultimately, make more informed investment decisions.

    1. Investogy

    Best for: Narrative-Driven Analysis & Real-Portfolio Transparency

    Investogy carves out a unique and compelling space among stock market analysis tools by focusing on clarity and conviction over raw data. Instead of providing a complex dashboard, it delivers its insights through a free, expertly crafted weekly newsletter. This makes it an exceptional resource for investors who value understanding the why behind an investment, not just the what.

    What truly sets Investogy apart is its radical transparency. The core of its content is built around a real-money portfolio, which the team has publicly grown from $50,000 to over $60,000 since 2022. This "skin in the game" approach provides subscribers with a tangible, unfolding case study in value investing, complete with candid discussions on both successful and unsuccessful decisions.

    Key Advantage: By showcasing a live, transparent portfolio, Investogy moves beyond theoretical analysis and demonstrates the practical application of its investment theses, building unparalleled trust and educational value.

    This narrative-driven analysis is particularly effective for busy professionals and discerning investors who want high-signal insights without the noise. The concise, 3-minute read format respects the reader's time while delivering actionable intelligence rooted in deep research. With a subscriber base that includes professionals from Google and OpenAI, its credibility is well-established.

    Access: Free subscription at investogy.com

    Feature Analysis
    Real-Money Portfolio Track a live portfolio's performance, trades, and rationale.
    Weekly Newsletter Receive concise, high-quality analysis directly to your inbox.
    Narrative Deep Dives Understand the full investment thesis behind each portfolio holding.
    Community Trust Join over 1,800 investors learning from a proven process.

    Pros:

    • Completely Free: No hidden fees or premium paywalls.
    • Unique Transparency: Real-money portfolio tracking builds confidence.
    • Concise & Actionable: 3-minute reads packed with valuable insights.
    • Educational Focus: Learn by following real-world investment decisions.

    Cons:

    • Singular Focus: Analysis is tied to one specific portfolio's strategy.
    • No Direct Advice: Serves as an educational tool, not a financial advisory service.

    2. TradingView

    TradingView has become a dominant force among stock market analysis tools by seamlessly blending powerful charting capabilities with a massive social network. It's the go-to platform for traders who value both technical precision and community-driven insights. Its intuitive interface makes it accessible for newcomers, while its advanced features satisfy seasoned professionals.

    TradingView

    The platform’s standout feature is its charting package, which is arguably one of the best available. You can utilize over 100 built-in indicators, countless drawing tools, and even create your own custom indicators using the proprietary Pine Script language. This level of customization is unparalleled.

    Platform Breakdown

    • Key Feature: Pine Script allows users to build, backtest, and share custom trading tools and strategies. This fosters a collaborative environment where you can leverage indicators created by a global community.
    • Best For: Technical traders of all levels, from beginners learning to chart to advanced quants developing complex algorithms.
    • Pricing: A robust free version is available. Paid plans (Pro, Pro+, and Premium) unlock more indicators per chart, multi-chart layouts, and additional server-side alerts, starting around $14.95/month.
    • Pros: Exceptional charts, vast community script library, multi-broker integration for direct trading.
    • Cons: Real-time data for certain exchanges costs extra, and the most powerful features are behind a paywall.

    Website: https://www.tradingview.com/

    3. Zacks Investment Research

    Zacks Investment Research has carved out a niche in the world of stock market analysis tools by focusing heavily on earnings estimates and fundamental data. It's an essential resource for long-term, value-oriented investors who prioritize deep-dive research over short-term technical signals. The platform is built around its proprietary Zacks Rank system, which has a well-documented history of identifying stocks poised for growth based on earnings revisions.

    Zacks Investment Research

    The platform’s strength lies in its ability to distill complex financial information into actionable ratings. This makes it particularly valuable for investors who may not have the time to perform exhaustive due diligence on every company but still want a data-driven approach to their portfolio. You can learn more about the principles behind their ratings by understanding different stock valuation methods.

    Platform Breakdown

    • Key Feature: The Zacks Rank is a quantitative model that grades stocks from #1 (Strong Buy) to #5 (Strong Sell) based on trends in earnings estimate revisions. This provides a clear, systematic way to surface potential opportunities.
    • Best For: Fundamental and value investors seeking in-depth equity research and a proven, data-driven stock rating system.
    • Pricing: A free basic membership is offered with limited access. Zacks Premium provides full access to the Zacks Rank list, research reports, and advanced screens starting at $249/year.
    • Pros: Strong, historically-backed ranking system, extensive database of financial data, and comprehensive equity research reports.
    • Cons: Heavily focused on fundamentals, which may not suit technical traders; the most valuable insights are behind a significant paywall.

    Website: https://www.zacks.com/

    4. Seeking Alpha

    Seeking Alpha has carved out a unique space among stock market analysis tools by leveraging crowd-sourced content. It provides a platform where thousands of independent investors, analysts, and industry experts share their in-depth research and opinions, offering a perspective you won't find in traditional Wall Street reports. This approach delivers an unparalleled breadth of coverage, especially for smaller, under-the-radar stocks.

    The platform excels by combining this qualitative, human-driven analysis with powerful quantitative data. Users get access to proprietary "Quant Ratings" and factor grades (e.g., Value, Growth, Profitability) for thousands of stocks, providing a quick, data-backed assessment to complement the detailed written articles. This blend of subjective insight and objective metrics is its core strength.

    Platform Breakdown

    • Key Feature: The extensive library of crowd-sourced articles and analysis offers deep dives into individual stocks, ETFs, and market trends. Accessing earnings call transcripts and presentations is another major plus.
    • Best For: Fundamental investors who value diverse opinions and want to combine qualitative research with quantitative screening tools.
    • Pricing: Offers a free "Basic" plan with limited article access. The "Premium" plan (around $239/year) unlocks unlimited content, quant ratings, and portfolio tools.
    • Pros: Massive diversity of viewpoints, comprehensive coverage of lesser-known stocks, and active community discussions.
    • Cons: The quality of analysis can be inconsistent due to its crowd-sourced model, and the best features require a paid subscription.

    Website: https://www.seekingalpha.com/

    5. Morningstar Premium

    For investors prioritizing fundamentals over technicals, Morningstar Premium stands as a pillar among stock market analysis tools. It forgoes the fast-paced charting of day trading platforms in favor of deep, research-driven analysis. This makes it an indispensable resource for long-term, value-oriented investors who want to understand the "why" behind a company's performance, not just its price action.

    Morningstar Premium

    The platform's strength lies in its proprietary research and ratings. Morningstar's team of independent analysts provides detailed reports on thousands of stocks, mutual funds, and ETFs. Their "Portfolio X-Ray" tool is a standout, offering a comprehensive look into your holdings to identify concentration risks, style drift, and underlying fees you might otherwise miss.

    Platform Breakdown

    • Key Feature: Independent analyst reports and fair value estimates provide a clear, unbiased perspective on a security's long-term potential. This is crucial for making informed decisions based on core business health.
    • Best For: Fundamental investors, retirement planners, and anyone building a long-term portfolio of stocks, ETFs, and mutual funds.
    • Pricing: Basic data is free. A Morningstar Premium subscription, which unlocks all analyst reports and advanced tools, costs $249 annually. A 7-day free trial is available.
    • Pros: Trusted and widely recognized research, powerful portfolio analysis tools, strong emphasis on fundamental data like cash flow. For a deeper understanding, explore what cash flow analysis entails.
    • Cons: Limited technical analysis features, and the most valuable research is locked behind the premium paywall.

    Website: https://www.morningstar.com/

    6. Benzinga Pro

    Benzinga Pro is a real-time news and research platform built for speed, making it one of the most powerful stock market analysis tools for traders who rely on timely information. It excels at delivering actionable, market-moving headlines faster than many traditional news sources. This focus on speed gives day traders and active investors a critical edge in reacting to news before the broader market.

    Benzinga Pro

    The platform’s core strength is its curated newsfeed, which cuts through the noise to highlight significant events. Its Audio Squawk feature is particularly valuable, providing live, broadcasted headlines from a team of reporters, allowing traders to receive updates without taking their eyes off their charts.

    Platform Breakdown

    • Key Feature: The Audio Squawk provides a live, human-read broadcast of critical news, catalysts, and market analysis, ensuring traders never miss a beat.
    • Best For: Day traders and short-term investors who need instant access to market-moving news and data to make quick decisions.
    • Pricing: Offers a free Basic plan with delayed data. Paid plans like Essential and a trial-based premium option unlock real-time data, the squawk, and advanced scanners, starting around $99/month.
    • Pros: Extremely fast news delivery, highly customizable newsfeeds and alerts, insider trading tracker.
    • Cons: The price point is higher than many other tools, and its feature set can be overwhelming for casual, long-term investors.

    Website: https://pro.benzinga.com/

    7. Stock Rover

    Stock Rover is a powerhouse among stock market analysis tools for investors who prioritize deep fundamental research over technical charting. It excels at providing a vast universe of financial data and powerful screening capabilities, allowing users to find undervalued companies based on specific, granular criteria. Its strength lies in transforming raw data into actionable insights for long-term investors.

    Stock Rover

    The platform’s screeners are a key differentiator, offering over 700 financial metrics for comparison. Users can build incredibly detailed custom screens or use pre-built ones designed by investment gurus. This makes it an invaluable tool for implementing strategies like dividend growth investing, value investing, or GARP (Growth at a Reasonable Price).

    Platform Breakdown

    • Key Feature: The comprehensive portfolio analysis tool allows you to link your brokerage accounts for a holistic view of your holdings, including performance, risk analysis, and future dividend income projections.
    • Best For: Fundamental and dividend-focused investors who perform in-depth research and want robust screening and portfolio management in one place.
    • Pricing: A free plan offers basic features. Paid plans (Essentials, Premium, and Premium Plus) unlock more metrics, historical data, and advanced features, starting at $7.99/month.
    • Pros: Extensive fundamental data library, powerful and customizable stock screeners, excellent portfolio analysis and dividend tracking.
    • Cons: Limited technical analysis tools compared to charting-focused platforms, and there is no dedicated mobile app.

    Website: https://www.stockrover.com/

    8. TC2000

    TC2000 has carved out a niche as a high-performance stock market analysis tool beloved for its speed, powerful scanning, and clean charting interface. For traders who prioritize quick, fluid analysis and custom screening conditions, it offers an exceptionally smooth user experience. It's particularly favored by technical traders who need to sift through thousands of stocks efficiently to find specific setups.

    TC2000

    The platform's standout capability is its EasyScan feature, which allows you to build complex market scans based on a vast library of technical and fundamental conditions. You can layer indicators, set custom parameters, and even draw trendlines that become part of your scan criteria, offering a dynamic way to hunt for opportunities.

    Platform Breakdown

    • Key Feature: The integrated drawing tools and scanning allow for unique condition-based alerts. You can draw a trendline on a chart and set an alert for when the price crosses it, a powerful feature for active traders.
    • Best For: Technical traders and options traders looking for top-tier scanning, charting, and integrated brokerage services.
    • Pricing: Offers Silver, Gold, and Platinum plans. The basic Silver plan starts at $9.95/month, but real-time data feeds require the Gold plan ($29.95/month) plus additional data fees.
    • Pros: Highly customizable and fluid interface, powerful stock and options screening, integrated brokerage for seamless trading.
    • Cons: Real-time data costs extra, and the platform has limited fundamental analysis capabilities compared to competitors.

    Website: https://www.tc2000.com/

    9. Koyfin

    Koyfin has carved out a niche as a powerful yet affordable alternative to expensive institutional terminals like Bloomberg. It positions itself as a premier research platform, offering professional-grade data and analytics that cater to serious investors looking for deep insights. This makes it one of the most comprehensive stock market analysis tools for macro and fundamental research.

    Koyfin

    The platform excels at providing a holistic view of the market, seamlessly integrating global equity data, macroeconomic indicators, and advanced charting. Users can create custom dashboards to track everything from individual stock financials to broad economic trends, all within a clean, intuitive interface. This integrated approach is crucial for a well-rounded investment decision-making process.

    Platform Breakdown

    • Key Feature: The "My Dashboards" feature allows for unparalleled customization, letting users build bespoke screens with graphs, watchlists, and financial data snapshots to monitor what matters most to them.
    • Best For: Fundamental and macro-focused investors who require extensive historical data, financial statements, and economic analysis without the high cost of an institutional platform.
    • Pricing: Koyfin offers a free plan with significant functionality. Paid plans (Plus and Pro) unlock more advanced data, financial modeling, and remove data limits, starting around $39/month.
    • Pros: Extensive and high-quality data coverage, highly customizable dashboards, excellent value compared to high-end terminals.
    • Cons: Limited brokerage integration for direct trading, and some of the more powerful analytical tools have a steeper learning curve.

    Website: https://www.koyfin.com/

    10. Finbox

    Finbox empowers fundamental investors by providing a powerful suite of valuation models and in-depth financial data. While many stock market analysis tools focus on charting, Finbox excels at helping you determine a stock's intrinsic value. It is designed for those who want to look beyond the price chart and understand the financial health and long-term potential of a company.

    Its core strength lies in its extensive library of pre-built, customizable valuation models, including Discounted Cash Flow (DCF), Dividend Discount, and multiples-based analyses. This allows investors to quickly generate a fair value estimate for thousands of global stocks without building complex spreadsheets from scratch.

    Platform Breakdown

    • Key Feature: The platform's customizable valuation models and templates allow users to adjust key assumptions and see their impact on a stock’s fair value in real-time, providing a dynamic way to test investment theses.
    • Best For: Fundamental and value investors who prioritize financial statement analysis and company valuation over technical trading.
    • Pricing: Offers a free plan with limited access. Paid plans with full feature access start at a competitive price point, making it accessible for individual investors.
    • Pros: Extensive database with over 900 financial metrics, user-friendly interface for building complex models, strong global coverage.
    • Cons: Limited real-time data availability, and some advanced modeling features can have a learning curve for beginners.

    Website: https://finbox.com/

    11. TradeStation

    TradeStation positions itself as a powerhouse for serious, active traders, offering an integrated brokerage and one of the most robust stock market analysis tools available. It's designed for those who demand institutional-grade analytics, speed, and the ability to automate complex strategies, moving beyond simple charting into a full-fledged trading environment.

    TradeStation

    The platform’s core strength lies in its proprietary EasyLanguage scripting, which allows traders to design, backtest, and automate their unique trading ideas without needing to be a professional programmer. This feature transforms the platform from a simple analysis tool into a personalized trading engine.

    Platform Breakdown

    • Key Feature: EasyLanguage allows traders to build custom indicators and fully automated trading strategies, then historically backtest them with remarkable detail and precision.
    • Best For: Experienced active traders, systematic traders, and those who want to develop and automate their own custom trading rules.
    • Pricing: TS GO offers commission-free stock and ETF trades with a per-contract fee for options. The more advanced TS SELECT plan has a competitive commission structure. Market data fees may apply.
    • Pros: Powerful strategy backtesting and automation, excellent charting capabilities, direct brokerage integration.
    • Cons: The platform has a steep learning curve for beginners, and some data feeds or advanced tools come with extra costs.

    Website: https://www.tradestation.com/

    12. Bloomberg Terminal

    The Bloomberg Terminal is the undisputed gold standard among professional stock market analysis tools, representing the pinnacle of institutional-grade financial data and analytics. It is the central nervous system for finance professionals globally, from hedge fund managers to investment bankers, providing an all-encompassing ecosystem for real-time data, news, research, and execution. While its price point places it outside the reach of most retail investors, its influence and power are unmatched in the industry.

    Bloomberg Terminal

    The platform is renowned for its depth, offering everything from macroeconomic data and intricate fixed-income analytics to proprietary news and direct communication with other financial professionals. The Terminal’s command-line interface, while initially daunting, allows for incredibly fast and powerful data retrieval once mastered, making it an essential tool for high-stakes decision-making.

    Platform Breakdown

    • Key Feature: Its comprehensive and integrated ecosystem provides unparalleled access to real-time market data, historical financial statements, economic statistics, and exclusive news from the Bloomberg News service.
    • Best For: Institutional investors, portfolio managers, financial analysts, and other finance professionals who require the highest fidelity data and advanced analytical capabilities.
    • Pricing: A subscription costs upwards of $24,000 per user, per year, making it one of the most expensive tools on the market.
    • Pros: Unrivaled depth and breadth of reliable data, integrates news and analytics seamlessly, the established industry standard for professionals.
    • Cons: Extremely high cost, a complex interface with a significant learning curve that is not intuitive for beginners.

    Website: https://www.bloomberg.com/professional/solution/bloomberg-terminal/

    Top 12 Stock Market Tools Feature Comparison

    Platform Core Features/Characteristics User Experience/Quality ★ Value Proposition 💰 Target Audience 👥 Unique Selling Points ✨ Price Points 💰
    🏆 Investogy Weekly 3-min newsletter, real-money portfolio ★★★★☆ Clear, concise, narrative-driven Free, actionable insights with transparency Data-driven dabblers & seasoned pros Transparent portfolio growth, educational, no raw data flood Free
    TradingView Advanced charting, 100+ indicators, social network ★★★★☆ Easy-to-use, cross-platform Flexible plans for all trader levels Traders, technical analysts Pine Script, broker integration Free + Paid tiers
    Zacks Investment Research Stock rankings, screening, research reports ★★★★☆ User-friendly, proven ranking system Freemium, premium for full access Retail & professional investors Zacks Rank system, detailed stock data Free + Premium subscription
    Seeking Alpha Crowd-sourced analysis, news, transcripts ★★★☆☆ Varies by contributor Freemium, premium content access Investors wanting diverse perspectives Large community, broad coverage Free + Premium subscription
    Morningstar Premium Fundamental research, portfolio analysis ★★★★☆ Trusted research, educational Premium for deep fundamental analysis Value investors, long-term oriented Portfolio X-Ray, analyst reports Premium subscription
    Benzinga Pro Real-time news, audio updates, scanners ★★★★☆ Fast, customizable alerts High cost justified by speed & breadth Active traders Audio squawk, real-time news Paid subscription
    Stock Rover Stock screening, portfolio/risk analytics ★★★★☆ Robust data, customizable dashboards Affordable, fundamental focus Fundamental investors 700+ financial metrics, dividend tracking Tiered paid plans
    TC2000 Charting, options screening, backtesting ★★★★☆ Highly customizable, integrated broker Paid plans, extra fees for real-time data Technical traders Paper trading, backtesting Paid subscription + fees
    Koyfin Equity/macro data, charting, dashboards ★★★★☆ User-friendly, regular updates Affordable alternative to terminals Equity researchers, macro investors Financial modeling, global coverage Free + Paid plans
    Finbox Financial data, valuation models, stock screening ★★★☆☆ User-friendly but advanced features Affordable for individual investors DIY investors 900+ metrics, valuation customization Freemium
    TradeStation Trading platform, strategy backtesting ★★★★☆ Powerful but complex Competitive commissions for active traders Active traders EasyLanguage scripting, multi-market access Free + Paid features
    Bloomberg Terminal Real-time data, news, analytics ★★★★★ Industry standard, complex interface High cost, top-tier professional service Financial professionals Unmatched data depth & reliability Very high cost

    Final Thoughts

    Navigating the vast ocean of financial data can feel overwhelming, but as we've explored, the right set of stock market analysis tools acts as your compass and sextant, guiding you toward more informed decisions. The journey from a novice investor to a seasoned analyst is paved with the insights these platforms provide. We've dissected a dozen powerful options, from the comprehensive charting capabilities of TradingView and TC2000 to the deep fundamental research offered by Morningstar Premium and Stock Rover.

    The key takeaway is that there is no single "best" tool for everyone. Your ideal platform is a direct reflection of your personal investment philosophy, experience level, and strategic goals. The high-frequency day trader has vastly different needs than the long-term, value-focused investor. One requires real-time news and Level 2 data like Benzinga Pro provides, while the other thrives on the institutional-grade research and fair value estimates from a service like Zacks or Morningstar.

    How to Choose Your Toolkit

    Before committing to a subscription, it's crucial to perform a self-assessment. Ask yourself these critical questions:

    • What is my primary investment style? (e.g., day trading, swing trading, long-term value, growth, dividend investing)
    • What is my current skill level? Am I just starting out and need educational resources, or am I an advanced user who needs sophisticated screening and backtesting?
    • What is my budget? Be realistic about what you can afford monthly or annually. Many of the best tools offer tiered pricing or free versions to get started.
    • What features are non-negotiable? Do I absolutely need real-time data, advanced charting with custom indicators, or deep fundamental screening capabilities?

    Your answers will narrow down the list significantly. A growth investor might find the powerful screening of Stock Rover indispensable, while a technical analyst will feel at home with the community and charting features of TradingView. Don't underestimate the power of free trials; use them to test the user interface and see if the workflow genuinely suits your process.

    Implementing Your Tools for Success

    Remember, these stock market analysis tools are not magic wands that print money. They are instruments that, when used skillfully, enhance your own research and decision-making process. The most successful investors integrate these platforms into a disciplined routine, using them to test hypotheses, identify opportunities, and manage risk, not to blindly follow automated signals.

    The ultimate goal is to build a personalized system that you trust and understand. This might mean combining the charting from one service with the fundamental data from another. Your confidence as an investor will grow not just from the profits you make, but from the conviction you have in your analysis, a conviction built upon the solid foundation of powerful, well-chosen tools.


    Ready to streamline your fundamental analysis with AI-powered insights? Investogy offers a unique approach, transforming complex financial reports into clear, actionable intelligence. Instead of spending hours on research, get the data-driven stories behind the stocks you follow. Explore how Investogy can become a core part of your stock market analysis toolkit by visiting us at Investogy.

  • Master the Investment Decision Making Process

    Master the Investment Decision Making Process

    A winning investment decision making process doesn't start with a hot stock tip. It starts long before you even glance at a market chart. It begins with building your own personal framework. Think of it as your internal playbook—the set of rules that dictates how you invest, making sure every move you make lines up with your real life and long-term dreams.

    Building Your Personal Investment Framework

    Before you get lost in market research or company financials, the most important work you'll do is looking inward. A solid investment framework is your personal constitution. It's the document that keeps you steady when markets get choppy and stops you from making emotional, knee-jerk mistakes. This foundation is what separates disciplined investors from those just chasing the latest trend.

    This entire framework really boils down to three core pillars: your goals, your time horizon, and your genuine comfort level with risk. If you don't have absolute clarity on these three things, you're basically navigating the markets without a map.

    Define Your Financial Goals and Time Horizon

    What are you actually investing for? The answer to this question shapes your entire strategy. Saving up for a down payment on a house you want to buy in five years demands a completely different game plan than saving for a retirement that's 30 years away.

    Get specific. A vague goal like "build wealth" is useless. Define what that actually looks like for you. Is it hitting a $1 million portfolio by the time you're 60? Or maybe it's generating $2,000 a month in passive income to cover your bills.

    Your time horizon is the most powerful variable here.

    • Short-Term Goals (Under 5 years): These goals need a capital preservation mindset. Think lower-risk investments like high-yield savings accounts or short-term bonds.
    • Mid-Term Goals (5-10 years): You can afford to take on a bit more moderate risk, maybe with a balanced portfolio of stocks and bonds.
    • Long-Term Goals (10+ years): A long runway like this is your green light to embrace higher-risk, higher-growth assets like stocks. You have plenty of time to ride out—and recover from—inevitable market downturns.

    This process flow shows how identifying your time horizon and risk tolerance logically leads to setting your return objectives—not the other way around.

    Image

    As the visual makes clear, you can't know what returns to aim for until you've figured out your timeline and how much risk you can stomach.

    Honestly Assess Your Risk Tolerance

    Risk tolerance isn't about how much you think you can handle on a good day. It's about how you'd actually react when your portfolio takes a 20% nosedive in a single month. Being brutally honest with yourself here is non-negotiable.

    A critical mistake I see all the time is people overestimating their emotional strength. They sell everything in a panic during a market crash, locking in their losses and completely derailing their long-term plans. Your framework is designed to prevent you from doing exactly that.

    Take a hard look at your financial stability, your age, and your emotional wiring. A young investor with a secure job can afford to take on more risk than someone on the verge of retirement. This self-assessment is the bedrock of a sound investment decision making process.

    Before diving into the nitty-gritty of picking investments, it's crucial to formalize these core components. Many experienced investors do this by creating an Investment Policy Statement (IPS). This simple document acts as your guide, helping you maintain discipline and focus no matter what the market throws at you.

    Core Components of Your Investment Framework

    Here's a breakdown of the essential elements you need to define. Think of this table as the blueprint for your personal investment constitution.

    Component Description Real-World Example
    Financial Goals The specific, measurable outcomes you're investing to achieve. "Save $50,000 for a house down payment within the next 7 years."
    Time Horizon The length of time you have to invest before you need to access the money. "I have 25 years until my target retirement age of 65."
    Risk Tolerance Your emotional and financial capacity to handle market fluctuations and potential losses. "I'm a moderate investor. I can handle a 15-20% drop without panicking, but a 40% loss would be too stressful."

    By taking the time to nail down these components, you're not just preparing to invest—you're setting yourself up for success by creating a powerful tool for maintaining discipline and focus over the long haul.

    How Macroeconomic Trends Shape Your Investments

    Okay, so you’ve got your personal framework dialed in. That's a great start, but a truly solid investment decision making process means looking beyond your own bank account and seeing the bigger picture. Companies don’t operate in a bubble; they're all swimming in the same massive, interconnected global ocean. Understanding how the major economic currents and weather patterns affect the markets is what separates investors who ride the waves from those who get swept away.

    Image

    Think of the global economy as the climate system for your portfolio. A sunny day for the tech sector might be a full-blown hurricane for industrial stocks. You don't need a PhD in economics to get this, but you absolutely need to grasp how certain key indicators act as a forecast. It gives you a massive edge.

    Reading the Economic Tea Leaves

    A few key data points give you powerful clues about where the economy is heading. Paying attention to them is a non-negotiable part of my process.

    • Gross Domestic Product (GDP): This is the big one—the broadest measure of a country's economic pulse. When GDP is climbing, it generally means the economy is healthy, which is great for corporate profits and stock prices.
    • Inflation Rates: When the price of everything starts rising too fast, it eats away at everyone's purchasing power. This usually forces central banks to step in and hike interest rates, which makes it more expensive for companies to borrow money to grow.
    • Interest Rate Policies: The decisions made by central banks like the Federal Reserve create huge ripple effects. Lower rates can juice the economy, while higher rates are used to pump the brakes and fight inflation.

    These aren't just abstract numbers; they have real-world consequences for your money. For example, high inflation and rising rates can slam growth-heavy tech stocks. But they can also be a tailwind for value stocks in sectors like consumer staples—because people always need to buy toothpaste and toilet paper, no matter what. Recognizing these patterns is a cornerstone of smart investing.

    Geopolitics and Where the Money is Flowing

    Beyond the hard data, you have to watch the world stage. Geopolitical events, new trade deals, and regulatory shake-ups are constantly creating fresh risks and opportunities. A trade agreement could blow open huge new markets for an industry, while a conflict somewhere could shatter supply chains and send commodity prices soaring.

    One of the most powerful, and often overlooked, signals of global confidence is foreign direct investment (FDI). This is when a company or individual in one country plows money into business interests in another. It's basically a long-term vote of confidence with real cash.

    A recent trend I'm watching closely is a concerning 11% drop in global FDI, the second straight year of decline. What's driving this? Geopolitical tensions, new trade barriers, and governments getting much stricter about who invests where. It shows a global shift toward playing it safe and avoiding long-term risks. Even if some headline numbers look good, they often hide a serious drop in productive, real-world investment. You can explore the full UNCTAD report on these global investment trends to see for yourself.

    This kind of data tells me that big, institutional money is getting nervous and picky. When the smart money pulls back, it’s a flashing yellow light for individual investors to be extra careful. It also underscores how economic downturns change how people invest, a topic we dive into in our guide on how to invest during a recession.

    When you combine this top-down, big-picture macroeconomic view with your specific, bottom-up analysis of individual companies, you build a much more resilient investment decision making process. You’ll be in a far better position to see major shifts coming, protect your capital, and strategically place your bets for future growth.

    Conducting Effective Research and Due Diligence

    Image

    Alright, you've got your high-level strategy figured out. Now it's time to roll up your sleeves and get your hands dirty. This is where the real work of the investment decision making process begins: the research and due diligence phase.

    Think of yourself as an investigative reporter. Your job is to move past the headlines and flashy news clips to uncover the real story behind a potential investment. This isn't about a quick Google search; it's a systematic process of gathering facts to find quality assets, spot hidden value, and—most importantly—identify any red flags before you put a single dollar at risk.

    Getting Into the Weeds with Company Fundamentals

    If you're looking at individual stocks, your first stop is the company's financial records. These aren't just numbers on a page; they're the vital signs that tell you about the health of the business.

    • Income Statement: This is the report card. Is the company actually making money? I look for consistent revenue growth and, just as crucially, stable or expanding profit margins.
    • Balance Sheet: This is a snapshot of financial resilience. It shows you what the company owns (assets) versus what it owes (liabilities). A business buried in debt is a huge red flag for me. I want to see a strong balance sheet that can weather a storm.
    • Cash Flow Statement: Honestly, this might be the most important of the three. It tracks the real cash coming in and going out. A company can look profitable on paper but go bankrupt if it can't manage its cash flow to pay the bills. Cash is king for a reason.

    Beyond the raw data, you need to understand the why. What gives this company a lasting edge, what Warren Buffett famously calls a "moat"? It could be a brand people trust implicitly, a patent on a game-changing technology, or a network so large that it's nearly impossible for a competitor to replicate. The quality of the management team is another huge piece of the puzzle. Are they smart, visionary, and acting in the best interests of shareholders?

    Your Due Diligence Checklist Isn't Just for Stocks

    These core principles of digging deep apply to any asset class, not just stocks. The specific questions you ask will just change depending on what you're analyzing.

    For instance, if you're evaluating a rental property, your checklist is going to be completely different. You'll be looking at local vacancy rates, the direction of property taxes, and the physical condition of the building. A new roof and HVAC system can save you from massive headaches and expenses down the line. If you're looking at bonds, your focus shifts to the issuer's credit rating and their fundamental ability to make interest payments on time, every time.

    A critical part of any smart investment process is realizing that no asset exists in a vacuum. Its potential is massively influenced by the world around it. Things like geopolitical shifts and overall investor sentiment can be powerful clues about where the smart money is heading next.

    Think about how global attitudes are changing capital flows right now. A recent survey revealed a major shift in how institutional investors see the world. Only 36% now see China as a hotbed of opportunity, a massive drop from 47% just a year earlier.

    Where is that interest going? It's flowing into other emerging markets in the Asia-Pacific region. You can dig into these evolving investor attitudes yourself on Adams Street Partners.

    This kind of big-picture information is invaluable. It adds a crucial layer of context, helping you understand not just the specific investment, but the economic and political currents it's swimming in. When you combine that deep, fundamental analysis with a sharp awareness of these broader trends, you build an investment thesis that is far more robust and defensible.

    Valuing an Investment and Finding a Good Price

    Image
    You've done the high-level analysis and dug deep into the research. Now comes the moment of truth in your investment decision making process: it’s time to crunch the numbers. I can't stress this enough: finding a great company is only half the battle. The other, equally crucial half is buying its stock at a great price.

    This is where the art and science of valuation come in. It’s all about figuring out what a business is truly worth, completely separate from its fluctuating price on the stock market. I’ve seen it happen time and time again—overpaying for even the world's best company can lead to years of frustratingly poor returns.

    Getting a Handle on Key Valuation Metrics

    You don't need a PhD in finance, but you do need to be comfortable with a few core metrics. Think of them as a quick health check on how the market is pricing a company against its actual performance.

    A couple of the big ones you'll see everywhere are:

    • Price-to-Earnings (P/E) Ratio: This is the classic. It stacks up a company's stock price against its earnings per share. A high P/E might scream "expensive," while a low one could signal a bargain. But context is everything. A high-flying tech company will almost always have a higher P/E than a slow-and-steady utility company, and that's perfectly normal.

    • Dividend Yield: If you're investing for income, this metric is your best friend. It tells you how much cash the company pays out in dividends each year compared to its stock price. A solid, reliable dividend is often the hallmark of a stable, mature business.

    These numbers are just the starting point, though. To really know if you're getting a good deal, you have to go deeper and estimate the company's intrinsic value. This is your best guess at what the business is actually worth, based on all the cash it's expected to generate for the rest of its life.

    The real goal here is to find a big gap between the market price and your calculated intrinsic value. Legendary investors call this the "margin of safety." It’s your cushion against being wrong, bad luck, or the economy taking an unexpected nosedive.

    Finding the Right Price in Today's Economy

    Valuation isn’t done in a vacuum. It’s hugely influenced by the bigger economic picture. Things like interest rates and GDP growth directly affect how much a company can earn in the future, which in turn impacts its intrinsic value.

    For instance, look at the current economic forecasts. With global GDP growth projected at 2.9% and 2.8% for the next couple of years, and U.S. growth slowing to 1.6%, the landscape is clearly shifting. This slowdown, fueled by economic uncertainty, changes how we should think about potential returns and risk.

    This is where you might roll up your sleeves and use a more advanced (but still manageable) tool like a Discounted Cash Flow (DCF) analysis. A DCF model helps you estimate a company's future cash flows and then "discounts" them back to what they're worth today to arrive at an intrinsic value.

    Getting good at these techniques is a massive step up for any serious investor. We actually take a much deeper look into the most popular stock valuation methods in our detailed guide. By combining your solid research with a disciplined approach to valuation, you can move forward with real confidence, knowing not just what to buy, but also when to pull the trigger.

    You’ve done the hard work, picked a winner, and now you’re ready to see your investment grow. But hitting the “buy” button isn’t the finish line. Not even close. The real work—the part that separates a lucky one-off from a lifetime of successful investing—is the ongoing management and review of your portfolio. Your investment decision making process hasn't ended; it's just entered its most critical phase. This is the marathon, not the sprint.

    The first step is actually executing your trade effectively. You have a few options here, and knowing which tool to use is key. A market order buys or sells immediately at whatever the current price is. It’s fast, but you have zero control over the price you get. I almost always use a limit order, which lets you name your price—the maximum you’ll pay or the minimum you’ll accept. It gives you control, which is something you rarely want to give up in the market.

    And don't forget about protective orders. A stop-loss order, for instance, automatically sells your stock if it drops to a predetermined price. This is a lifesaver for managing downside risk, especially with more volatile stocks where you want to cap your potential losses without being glued to your screen all day.

    The Power of a Disciplined Review Schedule

    Once you own a stock, the temptation is to either check it compulsively every five minutes or completely forget you own it. Both are recipes for disaster. The sweet spot is a consistent, disciplined review schedule. For most of us with a long-term mindset, a quarterly or semi-annual check-in is just about right.

    This isn’t about panic-selling because of a scary headline. It’s a structured time to look at two crucial things:

    • Are you on track? How is your portfolio performing against the financial goals you set way back in the beginning? Are you on pace, or do you need to make some adjustments?
    • Is the story the same? Is the original reason you bought each investment still true? Has something fundamentally changed with the company, its industry, or the economy that breaks your original thesis?

    Having a set schedule for this takes the emotion out of it and keeps you from making impulsive moves.

    Investing is a process of continuous learning and adaptation. A disciplined review isn't about finding reasons to sell; it's about confirming your reasons to continue holding. It replaces anxiety with a structured, repeatable process.

    Rebalancing to Stay on Course

    Over time, your portfolio is going to drift. That’s just a fact. If stocks have a killer year, that part of your portfolio might swell from 60% to 70% of your total holdings. Suddenly, you’re way more exposed to a stock market downturn than you originally intended. This is where rebalancing comes in.

    Rebalancing is the simple act of selling some of the assets that have done well and using the proceeds to buy more of the ones that have lagged. It brings your portfolio back to its original target mix. It feels completely counterintuitive, but it's an incredibly powerful strategy.

    It forces you to systematically sell high and buy low, which imposes a discipline that most investors lack. This one methodical move helps manage your risk and, more often than not, actually improves your long-term returns by keeping you aligned with your own goals.

    Got A Few Lingering Questions?

    Even with the best-laid plans, it’s completely normal to have some questions pop up. I’ve been doing this for years, and I still double-check my assumptions. The world of investing is nuanced, and asking questions is what smart, thoughtful investors do. Getting these things straight in your head builds the confidence you need to pull the trigger and stick with your strategy.

    Let’s run through some of the most common questions I hear. Nailing down the answers to these will help you move forward without that nagging second-guessing that can completely derail a solid plan.

    How Much Money Do I Really Need to Start?

    This is probably the single biggest myth that keeps people on the sidelines. The honest-to-goodness answer is you can start with whatever you’ve got. Seriously.

    Thanks to the explosion of fractional shares and zero-commission trading apps, you can get in the game with as little as $5 or $10.

    The secret isn’t how much you start with; it’s the consistency of your investing. The habit of regularly putting money to work—even tiny amounts—is way more powerful over the long haul than waiting around to save up a huge chunk of cash. The real goal is to get started now and let time and compounding do the heavy lifting for you.

    Should I Bother Trying to Time the Market?

    Let me save you a ton of stress. In a word: no.

    Trying to perfectly time the market—catching the absolute bottom and selling at the very peak—is a fool's errand. Even the pros on Wall Street fail at it consistently. A much better approach, and one that will let you sleep at night, is focusing on "time in the market, not timing the market."

    Research has shown time and again that the vast majority of an investment's returns come from just being invested. Missing just a handful of the market's best days can absolutely wreck your long-term results.

    Instead of gambling on short-term price swings, focus on a strategy that can withstand the ups and downs. A great way to build this mindset is by understanding the principles of building wealth over years, not days. If that sounds like your speed, our guide on what is long-term investing is a fantastic place to start.

    How Do I Know When It's Time to Sell?

    This is often way harder than figuring out when to buy. There isn’t one magic answer, but you can—and should—create clear rules for yourself before you ever need them.

    Here are a few solid, non-emotional reasons to consider selling an investment:

    • Your original thesis is broken. The fundamental reason you bought the stock or fund is no longer true. Maybe a competitor launched a killer product, or the brilliant CEO you bet on just left.
    • You need to rebalance. The position has grown so much that it's completely thrown your portfolio out of whack, leaving you way too exposed to a single company or sector.
    • You’ve found a much better opportunity. You've done the homework and identified a new investment with a significantly better risk-reward profile, and you need to free up the cash to make the move.

    Notice what’s not on that list? Panicking because the stock dropped a few percentage points or because of some scary headline on the news. Your selling decisions should be tied to your strategy, not to the market's daily mood swings.


    Frequently Asked Questions on Investment Decisions

    To wrap things up, let's hit a few more common questions in a quick Q&A format. My goal is to give you clear, direct answers so you can build a strong foundation for making your own investment choices.

    Question Answer
    What's the difference between investing and trading? Investing is typically long-term, focusing on a company's fundamental value with the goal of wealth appreciation over years. Trading is short-term, focused on profiting from price fluctuations over days, weeks, or months.
    How often should I check my portfolio? For long-term investors, checking once a quarter is plenty. Checking daily or weekly often leads to emotional decisions based on market noise rather than your strategy. Set it and try to forget it.
    Is it better to invest a lump sum or use dollar-cost averaging? Dollar-cost averaging (investing a fixed amount regularly) is often better. It reduces the risk of investing a large sum right before a market downturn and builds a disciplined habit.
    How many stocks should I own? For most people, owning 15-30 individual stocks provides good diversification without becoming unmanageable. If that's too much, a few low-cost index funds or ETFs can achieve the same goal much more easily.

    Hopefully, these answers clear up some of the fog. The more you learn, the less intimidating this all becomes.

    At Investogy, we believe that demystifying these common questions is key to building real conviction. We don't just share what we're buying; we share the why behind every part of our process. Subscribe to our free weekly newsletter to follow our real-money portfolio and learn how we navigate these decisions firsthand at https://investogy.com.

  • 7 Best Books on Value Investing for Serious Investors (2025)

    7 Best Books on Value Investing for Serious Investors (2025)

    True investing success isn't built on hot tips or chasing market trends; it's forged from a deep, principled framework. While the daily noise of the market can be deafening, the enduring wisdom of value investing offers a clear signal. This philosophy, championed by legends like Benjamin Graham and Warren Buffett, focuses on a simple but powerful idea: understand a business's intrinsic worth and buy its stock for less.

    But how do you build this foundational knowledge? By learning directly from the masters who first mapped the territory. In this article, we cut through the noise to explore the best books on value investing that provide more than just theory. They offer actionable blueprints for building conviction, identifying opportunities, and managing risk with discipline.

    We will connect their timeless principles to the modern, real-world approach we champion at Investogy, where every investment is part of a transparent, narrative-driven portfolio. This isn't just a reading list; it's a curriculum for becoming a more disciplined, patient, and successful investor. You'll gain specific insights from each essential text, learning how to apply their core lessons to construct a resilient financial future.

    1. The Intelligent Investor by Benjamin Graham

    No list of the best books on value investing would be complete without its foundational text. The Intelligent Investor, first published in 1949, is more than a book; it's the operating manual for rational, long-term wealth creation. Benjamin Graham, the "father of value investing," lays out a timeless framework for success that hinges on discipline, analysis, and a crucial psychological mindset.

    The book’s core philosophy is to treat investing as a business operation. This means conducting thorough research to determine a company's intrinsic value, the underlying worth of its assets and earning power, independent of its fluctuating stock price. Graham introduces the allegorical "Mr. Market," a manic-depressive business partner who offers to buy or sell you shares at wildly different prices each day. The intelligent investor learns to ignore Mr. Market's mood swings and instead uses his irrational offers to their advantage, buying when he is pessimistic (offering low prices) and considering selling when he is euphoric (offering high prices).

    Key Concepts for the Modern Investor

    Graham’s genius lies in creating simple, powerful mental models that protect investors from their own worst enemy: themselves. His principles are designed to build a robust portfolio narrative focused on resilience and predictable growth, rather than chasing speculative trends. The central tenets he established are as relevant today as they were over 70 years ago.

    For a quick reference, the infographic below highlights the three most essential concepts from the book.

    Infographic showing key data about The Intelligent Investor by Benjamin Graham, summarizing the concepts of Margin of Safety, Defensive vs. Enterprising Investor, and Investing vs. Speculation.

    These three pillars form a complete system for evaluating opportunities and managing risk effectively. By insisting on a margin of safety, you build a buffer against errors in judgment or unforeseen market downturns. For example, if you calculate a company's intrinsic value to be $50 per share, you might only purchase it at $35 or less, giving you a significant cushion. This disciplined approach directly reinforces a portfolio narrative built on durability, making it an indispensable read for anyone serious about value investing.

    2. Security Analysis by Benjamin Graham and David Dodd

    If The Intelligent Investor is the operating manual for the value investing mindset, then Security Analysis is the comprehensive, academic textbook that provides the deep analytical engine. First published in 1934, this seminal work by Benjamin Graham and David Dodd is the undisputed bible of fundamental analysis. It’s a dense, technical guide that teaches investors the rigorous process of dissecting financial statements and business operations to unearth true intrinsic value.

    The book’s core purpose is to equip the analyst with a systematic, evidence-based framework for evaluating securities. Graham and Dodd meticulously detail how to analyze balance sheets, income statements, and debt structures to move beyond market noise and focus on a company’s tangible worth. They championed the idea that a stock is not a speculative ticker symbol but a fractional ownership in a real business. This perspective forces the investor to ask critical questions about earning power, asset values, and long-term stability, creating a powerful narrative based on financial reality, not market sentiment.

    Key Concepts for the Modern Investor

    While written in a different era, the principles in Security Analysis are timeless. It provides the intellectual toolkit needed to perform true due diligence, protecting investors from overpaying for assets and making emotionally driven decisions. The book’s detailed approach to valuation gives you the confidence to act when others are fearful, a hallmark of successful value investing.

    The central tenets established by Graham and Dodd are essential for building a robust investment strategy. You can explore a detailed guide to these techniques and learn more about the specific stock valuation methods to apply these lessons practically.

    The book teaches you to think like a skeptical business owner, not a passive market participant. For instance, Warren Buffett’s early "cigar-butt" strategy, where he bought fair companies at wonderful prices, was a direct application of the deep value principles from Security Analysis. He would find businesses trading for less than their net working capital, offering a significant margin of safety. This disciplined, analytical approach is indispensable for anyone serious about mastering the craft of value investing, making it one of the best books on the topic ever written.

    3. Common Stocks and Uncommon Profits by Philip Fisher

    While Benjamin Graham laid the quantitative foundation for value investing, Philip Fisher built the qualitative framework. Common Stocks and Uncommon Profits, first published in 1958, complements Graham’s approach by shifting the focus from buying cheap, fair companies to buying outstanding companies at a reasonable price. Fisher champions a growth-oriented philosophy, arguing that the greatest returns come from identifying innovative businesses with sustainable competitive advantages and holding them for the long term.

    Fisher’s methodology is rooted in deep, investigative research that goes far beyond financial statements. He introduced the "scuttlebutt" or "grapevine" method, which involves gathering information by talking to a company's customers, competitors, former employees, and suppliers. This qualitative analysis helps an investor understand a company's internal culture, management quality, and industry reputation. A famous example of Fisher's influence is Warren Buffett, who stated his own approach is "85% Graham and 15% Fisher," acknowledging that Fisher's teachings pushed him to invest in great businesses like Coca-Cola rather than just statistically cheap "cigar-butt" stocks.

    Key Concepts for the Modern Investor

    Fisher’s genius was in formalizing a process to identify exceptional companies poised for decades of growth, a crucial element for building a portfolio narrative centered on innovation and dominance. His "Fifteen Points to Look for in a Common Stock" provide a detailed checklist for evaluating a business's long-term potential, from its research and development efforts to its profit margins and management integrity. These points are essential for today's investor navigating complex industries like technology and healthcare.

    For a quick reference, here are three of the most powerful concepts from the book.

    • The Scuttlebutt Method: Go beyond annual reports. True insight comes from speaking with people connected to the business to uncover its real strengths and weaknesses. For instance, before investing in a software company, talk to its users to gauge product loyalty and to its competitors to understand its market position.
    • Focus on Management Quality: Fisher insisted that a company is only as good as the people running it. Look for management teams with a long-term vision, a commitment to research and development, and a transparent relationship with investors.
    • Long-Term Holding Period: When you find a truly outstanding company, your holding period should be "forever." Fisher famously held shares in Motorola for decades. This approach allows the power of compounding to work its magic and avoids trading costs and taxes associated with frequent buying and selling.

    By applying these principles, you shift your portfolio's narrative from simply buying undervalued assets to owning pieces of the world's most innovative and durable businesses.

    4. The Essays of Warren Buffett: Lessons for Corporate America

    While other books teach value investing theory, this one shows it in action through the mind of its most successful practitioner. The Essays of Warren Buffett, masterfully compiled by Lawrence Cunningham, collects and organizes decades of Buffett's annual shareholder letters. It provides a direct look into the principles that transformed Berkshire Hathaway from a failing textile mill into a global powerhouse, making it one of the best books on value investing for practical wisdom.
    This book's power lies in its structure, which arranges Buffett’s timeless writings by topic, such as corporate governance, acquisitions, valuation, and accounting. Instead of a chronological history, you get a cohesive masterclass on how to think about businesses, management, and markets. Buffett's clear, folksy prose demystifies complex financial concepts, explaining his rationale behind landmark investments like Coca-Cola and GEICO. He illustrates how a durable competitive advantage, or "moat," and rational capital allocation are the true drivers of long-term value.

    Key Concepts for the Modern Investor

    Buffett's essays are a masterclass in building a portfolio narrative grounded in business ownership rather than stock speculation. He urges investors to focus on a company’s fundamental economic characteristics and the integrity of its management. These lessons are not just about picking stocks; they are about adopting a business owner’s mindset, a crucial shift for anyone serious about long-term success.

    The principles outlined in his letters are foundational to developing a patient, disciplined approach. The central tenets include:

    • Circle of Competence: Only invest in businesses you can thoroughly understand. This focus minimizes errors and allows for more accurate valuation. For example, Buffett’s deep understanding of the insurance business allowed him to effectively use insurance "float" as a cheap source of long-term capital.
    • Business Moats: Prioritize companies with a durable competitive advantage, like a strong brand (Coca-Cola) or low-cost operations (GEICO). These moats protect profitability and ensure long-term staying power.
    • Management & Capital Allocation: The quality of management is paramount, specifically their skill in allocating capital. Great managers reinvest earnings into high-return opportunities, creating immense value for shareholders over time.
    • Thinking Like an Owner: View a stock purchase as buying a piece of a business, not a blip on a screen. This perspective aligns your interests with the company's long-term performance, a core component of a successful long-term investing strategy.

    By internalizing these concepts, you shift your focus from short-term market noise to the underlying economic engine of a company. This book is an invaluable resource for learning to evaluate businesses and building a resilient, high-quality portfolio.

    5. Value Investing: From Graham to Buffett and Beyond by Bruce Greenwald

    While Graham provided the foundation, Bruce Greenwald and his co-authors constructed the modern academic skyscraper upon it. Value Investing: From Graham to Buffett and Beyond is an essential read that bridges the gap between classic principles and their application in today’s complex markets. As a renowned professor at Columbia Business School, the very institution where value investing was born, Greenwald brings a rigorous, systematic approach to the discipline.

    The book’s core contribution is its structured methodology for valuation. Greenwald argues that true value is often obscured by accounting conventions and market noise. He demystifies the process by breaking down valuation into three distinct components: asset value, earnings power value (EPV), and the value of growth. This layered approach allows an investor to first establish a baseline, conservative valuation based on a company's current, sustainable earnings, before even considering the more speculative element of future growth. This is a powerful framework for building a portfolio narrative grounded in reality, not hope.

    Key Concepts for the Modern Investor

    Greenwald’s genius is in providing a clear, repeatable process for finding undervalued securities, especially by focusing on a company’s strategic position within its industry. He introduces the concept of "franchise value," which arises from a company's durable competitive advantages, or "moats." This focus on competitive dynamics is a critical evolution from Graham’s earlier work and is central to how modern value investors like Warren Buffett operate.

    His method guides you to systematically search for value in specific places, such as spin-offs or companies within a defined "circle of competence." The process is meticulous and analytical, designed to build a portfolio based on quantifiable advantages rather than broad market bets. For example, when analyzing a retailer, Greenwald’s framework would compel you to assess not just its assets, but the strength of its local monopolies or brand loyalty, which are the true sources of its long-term earnings power. This makes it one of the best books on value investing for those who want a structured, academic, and practical guide.

    6. Margin of Safety by Seth Klarman

    If The Intelligent Investor is the bible of value investing, Seth Klarman’s Margin of Safety is its revered and sought-after modern testament. Published in 1991 and long out of print, this book has achieved legendary status for its disciplined, risk-averse approach. Klarman, founder of the Baupost Group, builds upon Graham's principles but places an uncompromising emphasis on capital preservation and absolute returns, making it one of the best books on value investing for turbulent times.

    Klarman's philosophy is rooted in a simple yet powerful idea: the primary goal of an investor is not to make money, but to avoid losing it. He champions a contrarian, bottom-up approach that involves painstaking research to find undervalued assets where others aren't looking. This often means delving into complex situations like distressed debt, corporate spinoffs, or misunderstood securities. The core of his strategy is to buy these assets at a significant discount to their underlying worth, creating a buffer that protects capital even if the investment thesis doesn't play out perfectly.

    Margin of Safety by Seth Klarman

    Key Concepts for the Modern Investor

    Klarman’s teachings provide a masterclass in risk management, discipline, and contrarian thinking. His framework is designed to help investors thrive during market dislocations, such as the savings and loan crisis or other recessions, by maintaining liquidity and acting decisively when fear is rampant. This institutional-grade wisdom is directly applicable to individual investors looking to build a resilient, opportunity-driven portfolio.

    A deep dive into a company's financial health is critical to applying Klarman's principles, and you can get started by understanding the core components of what cash flow analysis is. The three core tenets from his book are:

    • Prioritize Absolute Returns: Instead of measuring success against a market index (relative performance), focus on generating positive returns regardless of market direction. This mindset forces discipline and prevents you from being swept up in speculative bubbles.
    • Embrace Contrarianism: Actively search for investments that are unpopular, neglected, or feared by the majority of market participants. For instance, the Baupost Group has historically found great success by investing in distressed debt when other investors are fleeing, buying assets for pennies on the dollar.
    • Maintain Cash Reserves: Klarman views cash not as a non-earning asset but as a strategic call option on future opportunities. Holding significant cash allows you to deploy capital when bargains appear during market downturns, turning crises into profitable ventures.

    By adopting this risk-first methodology, you shift your portfolio's narrative from one of chasing gains to one of patiently capitalizing on proven, undervalued opportunities. This disciplined strategy protects your downside while creating the potential for significant long-term growth.

    7. You Can Be a Stock Market Genius by Joel Greenblatt

    Despite its sensationalist title, this 1997 classic from hedge fund manager Joel Greenblatt is a serious, advanced guide to finding value in unconventional places. You Can Be a Stock Market Genius moves beyond standard company analysis and dives into the lucrative world of special situation investing. It reveals how corporate events like spin-offs, mergers, bankruptcies, and restructurings can create massive, temporary mispricings that astute investors can exploit.

    Greenblatt’s core argument is that these complex situations are often misunderstood or ignored by institutional investors, creating pockets of inefficiency. For example, when a large company spins off a smaller subsidiary, the shares of the new, smaller entity are often sold indiscriminately by large funds that are unable or unwilling to hold them. This creates a supply-demand imbalance, temporarily depressing the price far below its intrinsic value. The individual investor who does the work can often acquire these high-quality assets at bargain prices.
    Key Concepts for the Modern Investor

    This book is essentially a playbook for hunting where others aren't looking. Greenblatt provides a framework for identifying these opportunities and systematically analyzing them to find a "heads I win, tails I don't lose much" scenario. This approach is one of the more specialized methods on our list of the best books on value investing, perfect for those ready to expand beyond traditional stock-picking.

    For the investor looking to build a portfolio narrative around specialized knowledge, Greenblatt’s strategies are invaluable. He provides a roadmap to uncover value by carefully studying corporate filings and understanding the catalysts behind specific events. The key is to find situations with a clear, predictable path to value realization, such as the spin-off of Marriott International’s lodging and contract services businesses, which unlocked tremendous shareholder value. By focusing on these special situations, you can build a portfolio that isn't solely dependent on the whims of Mr. Market, but rather on the predictable outcome of corporate actions.

    Top 7 Value Investing Books Comparison

    Title Implementation Complexity 🔄 Resource Requirements ⚡ Expected Outcomes 📊 Ideal Use Cases 💡 Key Advantages ⭐
    The Intelligent Investor by Benjamin Graham Moderate – foundational, not overly technical Low to moderate – suitable for beginners Long-term capital preservation and steady growth Beginners to intermediate investors seeking value investing principles Timeless risk management, margin of safety focus
    Security Analysis by Benjamin Graham & Dodd High – dense, technical, detailed High – requires strong analytical skills and time Deep fundamental understanding and intrinsic value calculation Serious students and professional analysts requiring rigorous analysis Most comprehensive framework for security analysis
    Common Stocks and Uncommon Profits by Philip Fisher Moderate – qualitative and quantitative mix Moderate – requires qualitative research Long-term growth via superior companies Investors focused on growth within a value framework Strong qualitative insights, management focus
    The Essays of Warren Buffett Low to moderate – accessible and practical Low – mainly conceptual and reflective Business-savvy investing and capital allocation insights Investors and business students wanting real-world wisdom Direct Buffett insights, broad investment/business lessons
    Value Investing: From Graham to Buffett by Greenwald High – technical and academic focus High – quantitative and systematic analysis Modernized valuation and analytical skills Advanced students and professional investors seeking contemporary methods Bridges classic and modern value investing theories
    Margin of Safety by Seth Klarman Moderate to high – risk-focused and contrarian Moderate – requires disciplined thinking Capital preservation and contrarian returns Sophisticated investors emphasizing risk management Strong focus on risk control and contrarian edge
    You Can Be a Stock Market Genius by Joel Greenblatt High – involves specialized event-driven strategies High – active management and monitoring needed Opportunistic gains from special situations Intermediate to advanced investors targeting corporate events Specific special situation strategies, less competitive niches

    From Reading to Action: Building Your Portfolio with Conviction

    Navigating the world of value investing can feel like piecing together a complex puzzle. The seven seminal books we've explored each provide a critical piece, forming a comprehensive roadmap from foundational theory to advanced, real-world application. Moving from theory to practice is the essential next step in your journey.

    We started with Benjamin Graham's bedrock principles in The Intelligent Investor and Security Analysis, establishing the non-negotiable concept of margin of safety. This is your defensive line, the intellectual buffer that protects your capital from emotional decisions and market volatility. Graham taught us to be business analysts first and market participants second, a theme that echoes through every subsequent work.

    Philip Fisher’s Common Stocks and Uncommon Profits then shifted our focus from purely quantitative measures to the qualitative aspects of a great business. His "scuttlebutt" method is a powerful reminder that true insight often lies beyond the balance sheet, in conversations with customers, suppliers, and former employees. It’s about understanding the narrative and competitive moat of a company, not just its price-to-earnings ratio.

    Synthesizing the Masters for Modern Markets

    Warren Buffett’s essays and Bruce Greenwald's Value Investing bridge the gap between Graham’s deep value and Fisher’s growth-oriented approach. They teach us that value and growth are two sides of the same coin; the goal is to buy wonderful companies at fair prices. This synthesis is crucial for the modern investor, allowing for flexibility in a market that rarely offers classic "cigar-butt" opportunities.

    Finally, Seth Klarman’s Margin of Safety and Joel Greenblatt’s You Can Be a Stock Market Genius arm us with the discipline and opportunistic mindset needed to act when others are paralyzed by fear. Klarman reinforces the importance of a bottom-up, risk-averse process, while Greenblatt illuminates the lucrative, often overlooked corners of the market, like spin-offs and merger arbitrage.

    Your Actionable Path Forward

    The common thread weaving through all these masterpieces is clear: successful investing is not about predicting the market's next move. It is about developing a rigorous, repeatable process for valuing businesses and having the conviction to act on your analysis.

    Your task now is to build that process.

    • Step 1: Define Your Circle of Competence. Which industries and business models do you genuinely understand? Start there.
    • Step 2: Create a Research Checklist. Combine Graham’s quantitative criteria, Fisher’s qualitative questions, and Greenblatt’s special situation triggers into a single, personalized checklist.
    • Step 3: Practice Valuation. Take a company you know well and attempt to value it using the methods described by Greenwald. Determine its intrinsic value and identify a price that offers a sufficient margin of safety.

    These are not just the best books on value investing; they are a complete curriculum for developing a resilient and profitable investment philosophy. The journey from reader to practitioner begins now, with the first company you analyze, the first annual report you dissect, and the first investment decision you make based on logic and evidence, not hype.


    Ready to put these principles into practice? Investogy provides the tools to screen for companies, analyze financial data, and manage your portfolio based on the very value investing strategies discussed in these books. Bridge the gap between theory and execution by visiting Investogy to start building your portfolio with conviction today.

  • What Is Cash Flow Analysis? Learn How It Reveals Financial Health

    What Is Cash Flow Analysis? Learn How It Reveals Financial Health

    At its heart, cash flow analysis is the process of examining how real money moves into and out of a business over a specific period. It's less about abstract accounting rules and more about the tangible, hard cash a company has to pay its bills, invest in growth, and reward its owners.

    Think of it as the most honest story your company’s bank account can tell.

    The Real Story Your Bank Account Tells

    Image

    While profit and income statements are important, they don't always show the full picture. They can even be a bit misleading because they include non-cash items like depreciation and are shaped by various accounting methods.

    Cash flow, on the other hand, is undeniable. It’s the lifeblood of any business, from a local coffee shop to a global corporation.

    A business can be profitable on paper but still go under if it runs out of cash. This is the fundamental truth that makes cash flow analysis so critical for both managers and investors.

    Getting a grip on this flow reveals a company's true operational health. It answers the questions that really matter:

    • Can the business generate enough cash from its core operations to keep the lights on?
    • Is the company putting its cash to work wisely to fuel future growth?
    • How is the business funding itself—through debt, new investors, or its own earnings?

    Why Cash Flow Matters More Than Ever

    Effectively managing this flow isn't just good practice; it's a core survival skill. There's a reason the global market for cash flow management tools was valued at USD 3.53 billion in 2023 and is projected to skyrocket to over USD 15 billion by 2032.

    This explosive growth, detailed in a report from Zion Market Research, underscores a growing awareness in the business world: poor cash management is one of the top reasons businesses fail.

    Ultimately, performing a cash flow analysis takes you far beyond surface-level metrics. It gives you the clarity to see a company’s financial story for what it really is, pinpointing its strengths, weaknesses, and strategic direction.

    Before we dive deeper, it helps to understand the three core activities that make up this analysis. This table gives you a quick snapshot of what we'll be exploring.

    The Three Pillars of Cash Flow Analysis

    Activity Type What It Reveals Example
    Operating Cash generated from core business activities. Sales revenue minus supplier costs.
    Investing Cash used for or gained from long-term assets. Buying new equipment or property.
    Financing Cash exchanged with owners and lenders. Issuing stock or repaying a loan.

    Think of these three pillars—Operating, Investing, and Financing—as the building blocks of a company's financial health. Understanding how they work together is the key to unlocking the full story behind the numbers.

    Breaking Down the Cash Flow Statement

    To really get your head around cash flow analysis, you need to understand that the statement of cash flows tells a story in three distinct parts. Each part reveals a completely different angle of a company's financial life.

    I like to think of it like being a detective. Each section of the report is a clue, and you can only solve the mystery of a company's true health by looking at all three together. These three pillars are cash flow from operations, investing, and financing.

    The infographic below lays out how these three activities flow from the core concept of cash flow.

    Image

    This structure makes it pretty clear that a solid analysis means digging into each of these separate, but deeply connected, financial streams.

    Cash Flow from Operations (CFO)

    This is the engine room of the business. Cash Flow from Operations (CFO) is all the cash a company generates from its main, day-to-day business. It’s the money rolling in from customers and the money going out to pay for things like inventory, salaries, and rent.

    A consistently positive CFO is a huge sign of financial strength. It shows the core business is self-sufficient and can churn out enough cash to keep the lights on and grow without constantly needing outside money.

    For instance, when a software company collects subscription fees, that’s an operating cash inflow. When it cuts checks for its developers' salaries, that’s an operating cash outflow. Simple as that.

    Cash Flow from Investing (CFI)

    Next up, we look at the company's long-term game plan. Cash Flow from Investing (CFI) tracks cash spent on or brought in from investments in assets. This isn't about the daily grind; it's about the big strategic moves designed to fuel future growth.

    This category covers things like:

    • Purchasing assets: Buying new machinery, property, or technology. This is a cash outflow, often called capital expenditure (CapEx).
    • Selling assets: Getting rid of old equipment or real estate, which brings cash in.
    • Acquisitions: Buying another company, which is a major cash outflow.

    Here's a twist: a negative CFI is often a great sign for a healthy company. It means the business is plowing its earnings back into itself to get bigger and better—a classic move for a growth-focused company.

    Key Insight: The relationship between CFO and CFI tells a powerful story. A company with a strong positive CFO and a big negative CFI is often a healthy, growing business that’s funding its own expansion.

    Cash Flow from Financing (CFF)

    Finally, Cash Flow from Financing (CFF) shows how a company raises money and pays it back to shareholders and lenders. This section is all about the movement of cash between a company, its owners, and its creditors.

    Common financing activities include:

    • Issuing stock: Bringing in cash from new investors.
    • Repurchasing stock: Using cash to buy back its own shares from the market.
    • Taking out loans: Getting cash from a bank or other lender.
    • Repaying debt: Making loan payments, which is a cash outflow.
    • Paying dividends: Distributing cash to shareholders as a return on their investment.

    Looking at these three components together is the only way to get the full picture. This detailed view is the bedrock of more advanced analysis and a cornerstone of many different stock valuation methods that smart investors rely on.

    Choosing Your Calculation Method: Direct vs. Indirect

    Image

    When you start digging into a cash flow analysis, one of the first things you'll tackle is calculating cash flow from operations (CFO). To get to that number, analysts use two different but equally valid paths: the Direct Method and the Indirect Method. Both roads lead to the same destination—the net cash from operating activities—but they tell the story in very different ways.

    Think of it like figuring out your total travel time on a road trip. The Direct Method is like keeping a detailed log of every minute spent driving, stopping for gas, and grabbing food. The Indirect Method is more like starting with the GPS’s estimated travel time and then adding or subtracting the time you spent on unscheduled stops. Both get you the correct total, but they offer completely different perspectives on the journey.

    The Straightforward Direct Method

    The Direct Method is about as intuitive as it gets. It creates a simple, straightforward ledger of all the actual cash that came into and went out of the business from its day-to-day operations. You’re essentially listing all cash receipts from customers and then subtracting all the cash paid out to suppliers, employees, and for other operating expenses.

    It answers the question, "Where did the cash come from, and where did it go?" in the clearest way possible. You see the actual cash changing hands. For example, a direct calculation would look something like this:

    • Cash received from customers
    • Minus Cash paid to suppliers
    • Minus Cash paid for salaries and wages
    • Minus Cash paid for taxes

    The result is a granular, easy-to-understand breakdown of cash movements. But here's the catch: despite its simplicity, this method is almost never used by public companies. It requires tracking a ton of data that isn't always readily available from standard financial statements.

    The Standard: The Indirect Method

    The Indirect Method is the one you’ll see almost everywhere—in fact, it's the approach used by over 98% of public companies. Instead of tracking every single cash transaction, it starts with a familiar figure from the income statement: net income (or profit).

    From there, it works backward to reconcile that net income figure to the actual cash flow. This means adding back non-cash expenses (like depreciation, which is an accounting expense but not a cash outlay) and adjusting for changes in working capital accounts (like accounts receivable and inventory).

    The Indirect Method is so dominant because it builds a crucial bridge between the income statement and the cash flow statement. It shows investors why a company's reported profit is different from the actual cash it generated, offering deeper insight into its accounting practices and operational efficiency.

    Because it links directly to the widely published income statement, this method is far more practical for outside analysts to use. This convenience has cemented its place as the undisputed industry standard.

    A cash flow statement is much more than just a list of numbers—it’s the story of a company’s health, its strategy, and its real potential. Learning to read the different combinations of positive and negative flows is a powerful skill. It’s like a doctor learning to read a patient's chart to diagnose their condition.

    This is where the rubber meets the road in cash flow analysis. The numbers from operations, investing, and financing come together to create distinct patterns. Spotting these patterns is the key to seeing past the surface-level data and understanding what's really going on inside a business.

    Decoding the Financial Fingerprints of a Business

    Think about a company's lifecycle. A brand-new, scrappy startup operates completely differently than a mature, established giant. It only makes sense that their cash flow statements would reflect these different stages, creating unique "financial fingerprints."

    By learning to recognize these fingerprints, you can get a quick read on a company’s strategic position. We can break them down into a few common scenarios, and each one tells a different, but equally important, story.

    • The Healthy Grower: This company has positive cash from operations (CFO) and negative cash from investing (CFI). This is often the gold standard for a healthy, expanding business. It shows the core business is profitable and generating cash, and management is confidently plowing that money back into new equipment, technology, or acquisitions to fuel even more growth.
    • The Cash-Burning Startup: You'll see negative CFO and negative CFI here. This is classic for an early-stage company that isn't profitable yet but is spending heavily on assets to scale up. These companies absolutely depend on positive cash from financing (CFF) from investors to survive this cash-hungry phase.
    • The Mature Giant: Look for strong positive CFO and often negative CFF. This profile usually belongs to a well-established company that generates more cash than it knows what to do with. Instead of massive reinvestment, it might be paying down debt or returning cash to shareholders through dividends and stock buybacks (both of which are CFF outflows). This signals stability and a focus on shareholder returns.

    When you look at these combinations, you start to realize that cash flow analysis is less about accounting and more about strategic interpretation. You’re not just adding numbers; you’re piecing together a narrative about ambition, risk, and stability.

    This interpretive skill is what separates casual observers from serious investors. It’s also why businesses are increasingly turning to better tools to get this analysis right.

    Technology's Role in Modern Analysis

    The need for spot-on interpretation has pushed companies to adopt more powerful tools. For a long time, North America has dominated the cash flow market, largely due to its early adoption of advanced tech like AI and data analytics. Between 2018 and 2023, the region saw a massive deployment of cash flow management software, which helped shift corporate finance from just looking backward to actively predicting the future.

    You can discover more about the global market evolution and see how this technology is changing the game for everyone. The trend is clear: companies everywhere are realizing the importance of moving from simple reporting to an active, forward-looking financial strategy.

    Of course, not every company fits neatly into one of those three boxes. Let's look at a few more nuanced scenarios you're likely to run into.

    Interpreting More Complex Scenarios

    Sometimes the story is a bit more complicated, and you have to dig a little deeper.

    Scenario A: The Struggling Business
    A company showing negative CFO but positive CFI could be in real trouble. This means it isn’t generating cash from its main business and is selling off assets (the positive investing flow) just to keep the lights on. This is a huge red flag that often signals a business in desperate need of a turnaround.

    Scenario B: The Big Strategic Bet
    What if a mature company suddenly shows a large negative CFI? This could signal a major strategic shift. Maybe they’re acquiring a competitor or making a massive investment in a new product line. This isn't necessarily bad, but it tells you the company is pivoting from a stable, maintenance phase to a new, aggressive growth phase.

    Learning to read these signals is what allows you to move from being a passive observer to an informed analyst, one who can understand the real story behind the numbers.

    How Technology Is Changing the Cash Flow Game

    Image

    Cash flow analysis isn't about dusty ledgers and clunky spreadsheets anymore. The whole discipline has been turned on its head by technology, transforming it from a backward-looking chore into a powerful, forward-looking strategic weapon. What used to be a reactive exercise is now a proactive tool for shaping a company’s future.

    Modern software is the engine driving this change. These platforms automate the mind-numbing work of collecting and reconciling data, which frees up managers to actually think about what the numbers mean. But the real game-changer is the layer of intelligence now being baked right in.

    The Rise of Predictive Forecasting

    This is where things get really interesting. Artificial intelligence (AI) and machine learning (ML) are taking cash flow analysis to a whole new level. Instead of just telling you what happened last quarter, these systems can now spit out scarily accurate cash flow forecasts. By chewing through historical data, market trends, and even macroeconomic signals, AI algorithms can predict future liquidity with incredible confidence.

    This isn't just a "nice to have"—it's invaluable. It allows a business to:

    • Spot cash shortfalls long before they become a crisis, giving them time to line up financing or cut back on spending.
    • Identify upcoming cash surpluses and figure out the best way to deploy that capital for growth or new investments.
    • Fine-tune payment and collection cycles to keep cash flowing smoothly and consistently through the business.

    This technological leap is why the financial tech sector is exploding. The global cash flow market, which is all about these modern tools, was valued at USD 0.93 billion in 2024. It's projected to rocket to an incredible USD 7.39 billion by 2033. That’s a massive 25.9% compound annual growth rate, all fueled by businesses scrambling to get a competitive edge with AI, ML, and data analytics.

    Smart business leaders aren't just looking in the rearview mirror anymore; they're using tech-driven insights to make better, data-backed decisions in real time.

    Making Smarter Decisions When It Counts

    This shift toward predictive analysis is especially critical when the economy gets rocky. During volatile times, the ability to accurately forecast your cash position becomes a core survival skill. It gives leaders the confidence to navigate unpredictable markets without flying blind.

    When you have a clear picture of future cash flow, you can act decisively. For us as investors, understanding a company’s tech stack in this area gives us another layer of insight. It speaks volumes about their operational maturity and how resilient they'll be in a downturn. It’s a key factor to look at, especially if you’re trying to figure out how to invest during a recession and want to put your money behind companies built on a solid financial foundation.

    Ultimately, technology has pushed cash flow analysis far beyond a simple accounting task. It’s now a cornerstone of modern strategic management.

    Common Questions About Cash Flow Analysis

    Once you start digging into cash flow analysis, a few questions always seem to pop up. It's a powerful way to look at a company, but some of the core ideas can feel a little slippery at first. Let's tackle the most common ones head-on.

    My goal here is to cut through the jargon and give you straight answers. Once these concepts click, you'll be able to use cash flow analysis to make much smarter decisions, whether you're sizing up a stock or just trying to get your own finances in order.

    Cash Flow Vs Profit What Is The Difference

    This is the big one, and the answer gets right to the heart of why we even bother with cash flow analysis. Profit, or net income, is what a company reports on its income statement. It’s an accounting number, meaning it includes all sorts of non-cash items (like depreciation) and can be shaped by different accounting rules.

    Cash flow, on the other hand, is the real, physical cash moving in and out of a company’s bank account. Think of it like this: a company can book a massive profit from a huge sale, but if the customer is paying on a 90-day invoice, there’s zero actual cash in the bank from that deal yet.

    Profit is an opinion, but cash is a fact. A company can look incredibly profitable on paper and still go bankrupt because it ran out of cash to pay its bills. Cash flow tells you the truth about a company's ability to survive and grow.

    Why Is Negative Cash Flow Not Always Bad

    You have to look at the full picture here. While negative cash flow from operations is almost always a huge red flag, seeing a big negative number in the investing section can actually be a fantastic sign.

    When you see a large cash outflow from investing activities, it often means the company is aggressively reinvesting in its future. This could be:

    • Buying new factories or machinery to ramp up production.
    • Acquiring a competitor to grab more market share.
    • Pouring cash into R&D to create the next blockbuster product.

    These aren't signs of weakness; they’re signs of confidence. A company is taking its hard-earned cash and putting it to work for future growth. Young, high-growth startups, for instance, are almost always deeply negative on investing cash flow because they're building the foundation for an empire.

    Can This Analysis Apply To Personal Finances

    Absolutely. In fact, it’s one of the best ways to get a real handle on your own financial health. Your personal finances have the exact same three parts as a major corporation's:

    1. Operating Cash Flow: This is your paycheck after taxes, minus all your regular living costs—rent, groceries, utilities, you name it. If this number is positive, you’re living within your means. Simple as that.
    2. Investing Cash Flow: This is all about buying or selling assets. Putting money into stocks or buying a rental property is a cash outflow. Selling those assets brings cash in.
    3. Financing Cash Flow: This tracks how you use debt. Taking out a mortgage or a car loan is a cash inflow. Making the monthly payments on those loans is a cash outflow.

    Looking at your money this way is incredibly clarifying. It shows you exactly where your cash is going and helps you spot the leaks and opportunities.

    What Is Free Cash Flow

    Now we get to the metric that serious investors obsess over: Free Cash Flow (FCF). It’s a pretty simple calculation—you just take the company's cash from operations and subtract its capital expenditures (the money it has to spend just to maintain its current assets, like buildings and equipment).

    FCF is the pot of gold at the end of the rainbow. It's the surplus cash a company generates after it has paid for everything it needs to run and maintain the business. This is the "free" money left over to actually create value for shareholders.

    A company with strong FCF can pay down debt, buy back its own stock, or hand out juicy dividends. That's why FCF is such a pure measure of financial strength and a key piece of many investment strategies, especially for anyone interested in what is long-term investing.


    Want to see how these concepts apply to a real-money portfolio? The Investogy newsletter breaks down our investment decisions, including deep dives into company cash flows, to show you the "why" behind every move. Subscribe for free at https://investogy.com.