
To really get a handle on a company's financial health, you need to look at three core reports: the balance sheet, the income statement, and the cash flow statement. I like to think of it like checking a car before a long road trip. You'd check the engine, the fuel, and the electrical systems, right? Each one tells you something different, but you need all three pieces of information to know if the car is road-worthy. It's the same with a company's financials.
Why Financial Statements Are Your Investment Roadmap
Think of these statements as a company's official report card. They’re the real story, cutting through the daily noise of stock price swings and analyst hype to show you how the business is actually performing.
Learning to read them is a non-negotiable skill for any serious investor. It's the bedrock of an approach called fundamental analysis, which is all about making decisions based on a business's actual performance, not just its stock price.
These documents aren't just for Wall Street quants. They're a transparent look under the hood, answering critical questions for investors, managers, and lenders alike. The magic is that they all work together.
To put it simply:
- The Income Statement tells you if the company made money over a certain period.
- The Balance Sheet gives you a snapshot of what the company owns and what it owes at a specific point in time.
- The Cash Flow Statement tracks the actual cash moving in and out of the business.
Let’s take a quick look at how these three reports work together to give you a complete financial picture.
The Three Core Financial Statements at a Glance
This table breaks down what each statement tells you and the main question it helps you, as an investor, answer.
| Statement Type | What It Shows | Key Question Answered |
|---|---|---|
| Income Statement | Profitability over a specific period (e.g., a quarter or a year). | Is the company profitable? |
| Balance Sheet | A snapshot of assets, liabilities, and equity at a single point in time. | What does the company own and owe? |
| Cash Flow Statement | The movement of cash from operating, investing, and financing activities. | Where is the cash coming from and where is it going? |
Getting comfortable with these documents has never been more crucial. Companies are facing tougher regulations, which means they're disclosing more detailed information than ever before. In fact, the global market for Financial Statement Services was valued at around $50 billion and is expected to keep growing. This just shows how complex and important this data has become. You can dig into more stats about this growing market on archivemarketresearch.com.
The real skill isn't just reading the numbers; it's using them to develop insights into what's actually happening with the business. In isolation, each report only tells you part of the story.
Ultimately, mastering these reports is what separates informed investing from pure speculation. You'll start spotting opportunities that others miss and—just as important—recognizing red flags before they turn into full-blown disasters. This guide will walk you through each statement, breaking down the jargon and showing you exactly what to look for, so you can analyze any company with confidence.
Decoding the Balance Sheet: What a Company Owns vs. Owes
If you only look at one financial statement, make it the balance sheet. Think of it as a financial snapshot, capturing a company's health at a single moment in time. It’s all built on one simple, foundational truth of accounting: Assets = Liabilities + Shareholder Equity.
What does that really mean? It just means that everything a company owns (its assets) had to be paid for somehow. It either borrowed the money (creating liabilities) or it was funded by its owners and the profits it has saved up over the years (equity). That's it. This simple formula is the framework for understanding a company’s entire financial structure.
But let's get past the textbook definitions. The real skill is knowing what these categories tell you about a business's stability and where the hidden risks might be lurking.
Assets: What a Company Owns
Assets are simply the economic resources a company controls. On the balance sheet, you'll see them listed in order of liquidity—basically, how fast they can be turned into cold, hard cash.
- Current Assets: These are the resources expected to be used up or converted to cash within a year. We're talking about things like cash and cash equivalents, accounts receivable (money that customers owe them), and inventory sitting in a warehouse.
- Non-Current Assets: This is the long-term stuff that isn't easily sold off. This includes property, plant, and equipment (PP&E)—think factories, machinery, and office buildings—as well as intangible assets like patents and brand trademarks.
A healthy company needs a good mix of both. You want enough current assets to cover the day-to-day bills, but you also need those long-term assets to fuel future growth.
Liabilities and Equity: What a Company Owes
Now for the other side of the equation. Liabilities and equity show you where the money came from to buy all those assets.
Liabilities are the company’s debts and financial obligations. Just like assets, they are split up based on when they're due.
- Current Liabilities: These are the bills due within one year. This includes accounts payable (money owed to suppliers) and any short-term debt.
- Non-Current Liabilities: These are obligations that don't have to be paid back for more than a year, like long-term debt from bank loans and pension liabilities.
Shareholder Equity is what's left over for the owners. It’s the residual value after you subtract all the liabilities from all the assets. Its main components are the initial investment from stockholders (common stock) and retained earnings—all the net income the company has piled up over its lifetime.
A rising retained earnings balance is one of my favorite green flags. It shows the company is not only profitable but is choosing to reinvest those profits back into the business to grow even more, instead of just handing it all out to shareholders.
Putting It All Together with Key Ratios
Just looking at the raw numbers doesn't tell you much. The real magic happens when you start comparing them to each other. One of the first and most useful metrics you can pull from the balance sheet is the Current Ratio.
Current Ratio = Current Assets / Current Liabilities
This simple calculation instantly tells you if a company has enough short-term cash and assets to cover its short-term bills. A ratio above 1.0 is a good sign, suggesting it can meet its obligations. A ratio below 1.0 can be a major red flag, pointing to potential cash flow problems down the road.
For example, if a company has $500,000 in current assets and $250,000 in current liabilities, its current ratio is a healthy 2.0. This means it has $2 in liquid assets for every $1 of debt coming due in the next year. It's a crucial first check for financial stability.
Gauging Profitability With The Income Statement

If the balance sheet is a snapshot in time, think of the income statement as the highlight reel of a company's performance. It tells you the story of how much money a company made (or lost) over a specific period, like a quarter or a full year.
This is why it's often called the Profit and Loss (P&L) statement. Its whole job is to show you whether a business is actually making money, from its very first sale all the way down to the final profit.
It all kicks off with Revenue—sometimes called Sales. This is the top-line number, representing every dollar the company brought in from selling its products or services. But what a company makes is rarely what it keeps. From here, we start peeling back the layers by subtracting costs.
From Gross Profit to Operating Income
The first big chunk to come out is the Cost of Goods Sold (COGS). These are the direct expenses tied to producing whatever the company sells—think raw materials for a car manufacturer or the ingredients for a restaurant. Getting a handle on understanding business expense categories is key to seeing what gets counted here versus what comes later.
When you subtract COGS from Revenue, you get Gross Profit. This is a powerful metric. It tells you exactly how efficient a company is at its core function of creating and selling its products, before any administrative or marketing costs muddy the waters. A healthy, consistent Gross Profit Margin (Gross Profit / Revenue) is always a great sign.
Next up, we deduct the Operating Expenses. These are the costs of keeping the lights on and the business running, even if they aren't directly part of the product itself. This bucket usually includes:
- Selling, General & Administrative (SG&A): This covers everything from the sales team's salaries and marketing campaigns to the rent for the corporate headquarters.
- Research & Development (R&D): For many companies, especially in tech and pharma, this is a huge expense that fuels future growth and innovation.
Once those are subtracted, we land on Operating Income. I pay close attention to this number because it shows the profit a company generates purely from its main business activities. It’s a clean look at performance, free from the noise of financing decisions or tax strategies.
The All-Important Bottom Line
We're almost there. After accounting for any non-operating items, like interest paid on debt, and finally, income taxes, we arrive at the famous "bottom line": Net Income.
This is it—the company's total profit after every single expense has been paid. Seeing this number grow consistently year after year is the classic sign of a well-oiled, successful business.
To really put this number into perspective, we calculate the Net Profit Margin.
Net Profit Margin = (Net Income / Revenue) x 100
This simple ratio is incredibly insightful. It tells you what percentage of every single dollar in sales the company actually pockets as pure profit. For instance, a company with a 20% net profit margin is banking $0.20 for every $1.00 in revenue.
Comparing a company's net profit margin to its own history and, more importantly, to its direct competitors, gives you an instant read on its operational efficiency and standing in the market. Is it a lean operator, or is it struggling to keep costs in check? The bottom line always tells the truth.
Following the Money with the Cash Flow Statement

Profit on paper is one thing, but actual cash in the bank is what keeps the lights on. That's where the cash flow statement comes in. I think of it as the ultimate reality check, showing you exactly where a company's money came from and where it went.
This statement is the crucial bridge connecting the income statement and the balance sheet. It cuts through the accounting noise and shows how a company's day-to-day operations and big-picture decisions actually affect its cash balance.
It’s surprisingly common for a business to post a huge profit on its income statement but be teetering on the edge of bankruptcy. How? Because accounting rules include all sorts of non-cash revenues and expenses. The cash flow statement ignores all that and focuses only on what matters for survival: cold, hard cash.
The Three Core Activities
This statement is neatly organized into three sections, and each tells a critical part of the company's story. To do a proper cash flow analysis, you really need to understand what each one is telling you.
-
Cash Flow from Operating Activities (CFO): This is the engine room of the business. It shows the cash generated from a company’s main gigs, like selling products or services. A consistently strong, positive CFO is a fantastic sign of a healthy, self-sustaining business.
-
Cash Flow from Investing Activities (CFI): This section tracks the cash a company spends to maintain and grow its operations. Think of it as investing in the future—buying or selling assets like new machinery, buildings, or even acquiring other companies.
-
Cash Flow from Financing Activities (CFF): This part details how a company raises money and pays it back to investors. You’ll see things like issuing or buying back stock, taking on new loans, paying down debt, and, of course, paying out dividends to shareholders.
Interpreting the Flow of Cash
When you look at these three sections together, you start to see the full picture. For example, a young, high-growth company might show a big negative number for its investing cash flow. That’s because it’s pouring money into new equipment and facilities to expand. That’s not a red flag; it’s a sign of ambition.
But here's the catch. If that same company has a negative operating cash flow, it means its core business isn't actually making any money. It's likely relying on loans (financing activities) just to stay afloat. That's a business model that rarely ends well.
A classic mistake I see investors make is freaking out over any negative number. Context is everything. A huge negative CFI could signal smart, long-term investments, while a huge positive CFF might just mean the company is drowning itself in debt.
Discovering Free Cash Flow
One of the most powerful metrics you can pull from this statement is Free Cash Flow (FCF). It’s not always explicitly listed, but it’s simple to calculate yourself:
FCF = Cash Flow from Operations – Capital Expenditures
You'll find Capital Expenditures (or CapEx) in the investing activities section—it's the money spent on physical assets. FCF shows you how much cash a company has left over after paying for everything it needs to run and grow. This is the good stuff, the surplus cash it can use to pay dividends, buy back shares, or pay down debt.
For me, a company that consistently grows its Free Cash Flow is one of the strongest signs of a high-quality, durable business.
Weaving the Statements into a Single Story
Looking at a single financial statement is like trying to understand a movie by watching only one scene. You get a snapshot, but you miss the entire plot. The real magic happens when you see how the income statement, balance sheet, and cash flow statement all talk to each other. They're not just separate reports; they're three acts of the same financial drama.
These connections aren't abstract—they're direct and logical. For instance, the Net Income you see at the bottom of the income statement doesn't just disappear into thin air. It flows straight into the Shareholder Equity section of the balance sheet, usually as an increase in Retained Earnings. This shows you exactly how much profit is being plowed back into the business to fund future growth.
At the same time, that very same Net Income is the starting line for the cash flow statement. It's the first number you see in the Cash Flow from Operations section, which then adjusts for non-cash expenses (like depreciation) to show you how much actual cash the company generated.
Seeing the Ripple Effect in Action
Let’s walk through a simple, everyday business transaction to see how this works. Imagine a company decides to upgrade its equipment and buys a new machine for $100,000, paying in cash.
Here’s how that one purchase sends ripples across all three statements:
- On the Cash Flow Statement: You'll see a $100,000 reduction under Cash Flow from Investing. It’s a cash outflow, plain and simple.
- On the Balance Sheet: The company's cash balance (a current asset) drops by $100,000. But, its property, plant, and equipment (a non-current asset) increases by the same $100,000. The company’s total assets don’t change—the value just shifted from cash to machinery.
- On the Income Statement: Nothing happens immediately. The cost of the machine will be recognized gradually over its useful life through depreciation, not all at once.
This single purchase demonstrates the dynamic link between the statements. Grasping these relationships is what allows you to build a complete narrative and, more importantly, spot red flags or inconsistencies that others might miss.
The infographic below gives a great high-level view of how to put these pieces together to judge a company's financial strength.
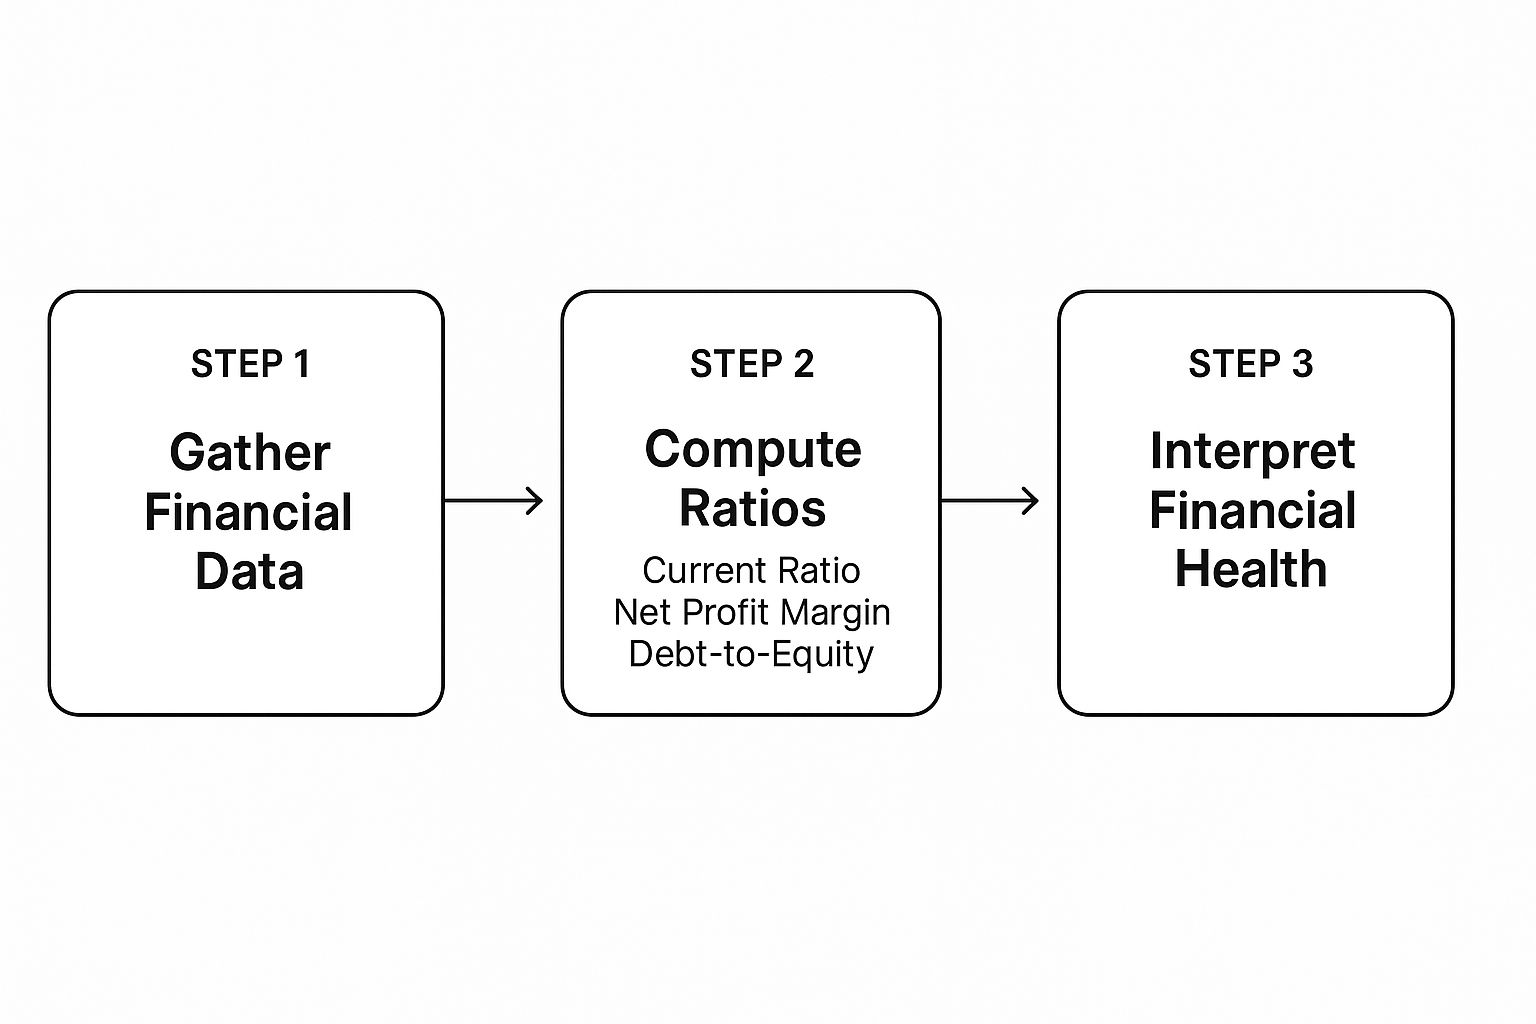
As the graphic shows, just gathering the data is step one. The real insight comes from calculating the key ratios and figuring out what they mean in the real world.
The goal is to get past just reading the numbers. You want to weave them into a coherent story about where the business has been and where it's likely heading. This deeper level of understanding is non-negotiable before you can even begin to think about what the business is truly worth.
Key Ratios from Each Financial Statement
To help you get started, here's a quick-reference table that pulls together some of the most critical ratios from each statement. Think of it as your cheat sheet for quickly diagnosing a company's health.
| Financial Ratio | Source Statement(s) | What It Measures | Formula |
|---|---|---|---|
| Current Ratio | Balance Sheet | A company's ability to pay its short-term debts. | Current Assets / Current Liabilities |
| Debt-to-Equity Ratio | Balance Sheet | How much debt a company uses to finance its assets. | Total Liabilities / Shareholder Equity |
| Gross Profit Margin | Income Statement | The profitability of a company's core business activities. | (Revenue – COGS) / Revenue |
| Net Profit Margin | Income Statement | The percentage of revenue left after all expenses are paid. | Net Income / Revenue |
| Return on Equity (ROE) | Balance Sheet & Income Statement | How effectively management is using equity to generate profits. | Net Income / Shareholder Equity |
| Operating Cash Flow Ratio | Cash Flow Statement & Balance Sheet | How well current liabilities are covered by cash flow. | Operating Cash Flow / Current Liabilities |
This table isn't exhaustive, of course, but it's a solid foundation. Mastering these ratios will put you well on your way to making more informed investment decisions.
The skills you build by analyzing these statements are universal. They are just as crucial for analyzing real estate investment deals as they are for picking stocks.
Once you’re comfortable connecting these dots, you’ll be ready for the next step. To truly elevate your analysis, you can learn to master stock valuation methods and pinpoint a company’s intrinsic worth.
Got Questions? Let's Clear a Few Things Up.
As you start digging into real-world financial statements, you're bound to run into a few questions. I know I did. These are the sticking points that trip up a lot of people when they're first starting out.
Let's tackle some of the most common ones head-on. Getting these sorted will make the whole process feel much less intimidating.
"Great, But Where Do I Actually Find These Statements?"
Good question. For any public company in the U.S., your official source is the SEC’s EDGAR database. Think of it as the government's massive filing cabinet for all corporate reports. It’s the definitive place to go.
- The 10-K Report: This is the big one. It's the annual, audited, deep-dive report that gives you the most comprehensive picture of a company's financial year. If you only read one document, make it this one.
- The 10-Q Report: This is a quarterly update. It's unaudited and less detailed than the 10-K, but it keeps you up to speed on the company's progress throughout the year.
Pro tip: While EDGAR is the official source, I usually start on the company's own website. Look for an "Investor Relations" section. Most companies post their 10-Ks and 10-Qs there, and the sites are often much easier to navigate.
"If I Only Look at One Thing, What Should It Be?"
Tough question, because no single number tells the whole story. But if you put me on the spot, I’d say a consistent history of positive and growing free cash flow (FCF).
Why? Because cash is king. It's the ultimate sign of a healthy, self-sufficient business. A company with strong FCF is a money-making machine, generating more than enough cash to run its operations. It can then use that extra cash to pay down debt, hand out dividends, or pour it back into growing the business—all without needing outside help. That, right there, is the engine of long-term shareholder value.
"How in the World Do I Analyze a Company That's Losing Money?"
This is a great one, especially when you're looking at young tech or biotech companies that are burning through cash to fuel growth. When a business isn't profitable yet, the game changes. You're not buying current earnings; you're betting on future potential.
Instead of focusing on net income, you have to analyze the company's growth trajectory and its ability to survive until it reaches profitability. The key is understanding their 'cash runway'—how long they can operate before needing more funding.
Forget net income for a moment. Instead, you need to become a bit of a financial detective and look for these clues:
- Strong revenue growth on the income statement. Is the top line growing at a healthy clip?
- A healthy cash balance on the balance sheet. Do they have a war chest to weather the storm?
- A manageable operational cash burn rate on the cash flow statement. How fast are they spending money, and is it sustainable?
"What Are the Biggest Red Flags I Should Watch Out For?"
Spotting trouble early is just as crucial as finding a winner. As you get comfortable reading financial statements, your spidey-senses will start to tingle when something's off. Here are a few major warning signs I always keep an eye on:
- Consistently negative cash flow from operations: This is a huge one. It means the core business itself is bleeding money, year after year.
- Rapidly increasing debt: A company piling on debt can be a sign of desperation, especially if profits and assets aren't growing alongside it.
- Declining revenue or shrinking profit margins: These can be early indicators that a company is losing its competitive edge or facing pricing pressure.
- Frequent changes in accounting methods: This is a sneaky one. If a company keeps changing how it counts things, it might be trying to paper over poor performance. Be very wary of this.
Ready to see how all this theory gets put into practice? The Investogy newsletter gives you a transparent, real-money portfolio where I share the research and logic behind every single investment decision. It's a great way to see these principles in action. Join our community of smart investors by subscribing for free at https://investogy.com.
Leave a Reply