Calculating your return on investment is actually pretty straightforward. At its core, you're just dividing the net profit you made by what the investment originally cost you.
The classic formula is ROI = (Net Profit / Cost of Investment) x 100. This spits out a percentage that tells you, in simple terms, how profitable your investment was. It’s a single number that reveals how hard your money is working for you.
What Return on Investment Really Means
Before we start plugging in numbers, it's crucial to get what you're really measuring. Think of Return on Investment (ROI) as a universal yardstick for performance. I’ve seen it used to evaluate everything from a massive corporate acquisition down to a single stock in a personal portfolio.
Its main job is to cut through gut feelings and give you a clear, standardized measure of financial gain (or loss) compared to the cash you put on the line. A positive ROI means you came out ahead. A negative one, well, that means you lost money.
Breaking Down the Core Components
To get a number you can trust, you have to be honest about the two main parts of the formula: Net Profit and Cost of Investment. Getting these right is the difference between a useful metric and a misleading one.
To make sure we're on the same page, let's break down exactly what goes into a proper ROI calculation.
Key Components of the ROI Formula
A breakdown of the essential elements needed to calculate ROI accurately.
| Component | What It Includes | Quick Example |
|---|---|---|
| Net Profit | The final value of the investment minus its initial cost. It’s your total take-home gain. | Buy a stock for $1,000, sell it for $1,500. Your net profit is $500. |
| Cost of Investment | The initial purchase price plus all associated costs (commissions, fees, taxes, maintenance). | That $1,000 stock purchase included a $10 brokerage fee. Your true cost is $1,010. |
| Final Calculation | (Net Profit / Cost of Investment) x 100 | ($500 / $1,010) x 100 = 49.5% ROI. |
Getting these components right is absolutely critical for an accurate picture of your investment's performance.
A common mistake I see all the time is people only looking at the purchase price for the "cost." A true ROI analysis demands you account for every single penny spent to acquire and maintain the investment—from brokerage fees to renovation costs on a rental property.
This metric is essential for both quick trades and for understanding the health of your portfolio over many years. For those focused on building wealth over the long haul, understanding the fundamentals of what is long-term investing is key to seeing how ROI fits into the bigger picture.
Ultimately, once you master how to calculate return on investment, you're empowered to make smarter, data-driven financial decisions instead of just guessing.
Calculating ROI With Real-World Numbers
Alright, let's move beyond the textbook formula and get our hands dirty with some real-world numbers. This is where the rubber meets the road. The basic idea is simple: figure out your Net Profit and divide it by your true Cost of Investment.
But here's where so many people mess up: the true cost. It's not just the sticker price. If you forget to include every single related expense, you're just fooling yourself. I've seen it happen countless times—a seemingly profitable venture turns out to be a money pit once all the hidden fees, taxes, and maintenance costs are tallied up.
This is the entire game. Nailing down your total costs is the difference between an accurate ROI and a fantasy number.
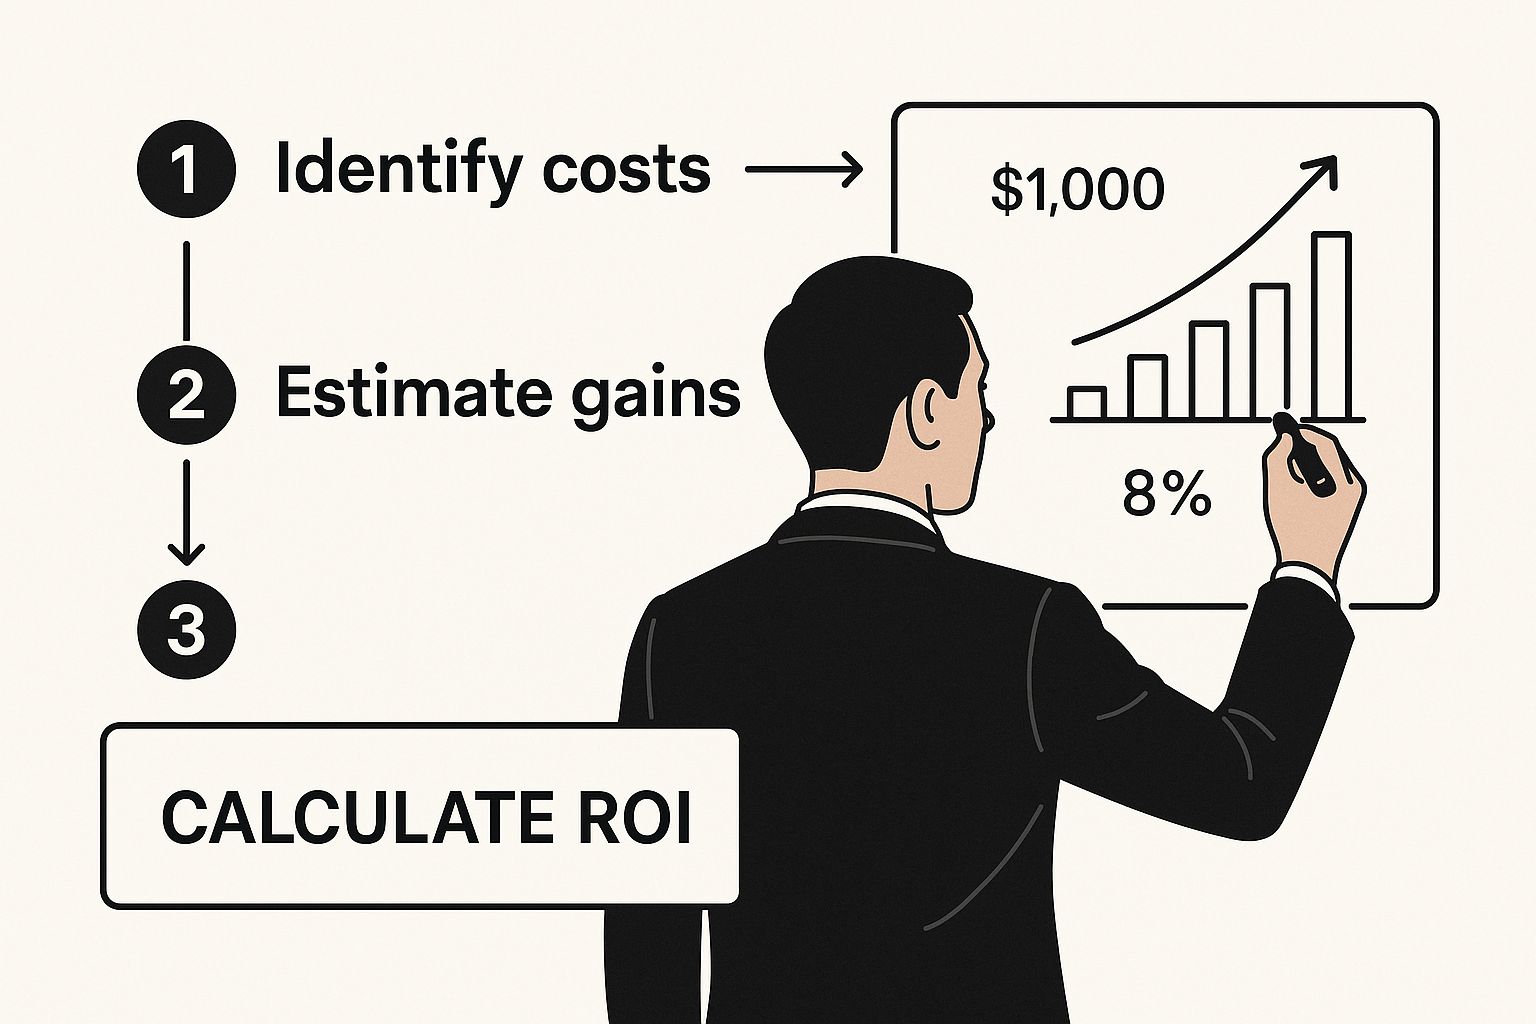
As you can see, getting that final ROI percentage requires you to be a bit of a detective, uncovering every single cost before you can see the real profit.
Let's walk through a few scenarios I've seen play out.
Digital Marketing Campaign Example
Imagine a local business decides to run a Google Ads campaign and puts $5,000 into it. That's their initial investment. The campaign is a hit, bringing in $15,000 in new sales over the quarter.
Looks great, right? But hold on. The cost of producing the goods they sold was $4,000. So, the gross profit from those sales is actually $11,000 ($15,000 – $4,000). To get the net profit, we have to subtract the ad spend: $6,000 ($11,000 – $5,000).
Now we can calculate the real ROI:
($6,000 Net Profit / $5,000 Cost of Investment) x 100 = a 120% ROI.
Real Estate Flip Example
This is a classic. Let's say you buy a fixer-upper for $200,000. You pour $30,000 into renovations and spend another $10,000 on closing costs, realtor commissions, and property taxes. Your actual, total Cost of Investment isn't $200k—it’s $240,000.
You sell the spruced-up house for $300,000. Your Net Profit is the sale price minus your total investment: $300,000 – $240,000 = $60,000.
This is a crucial point: failing to include renovations, fees, and taxes in your 'Cost of Investment' would have artificially inflated your ROI from a realistic 25% to a misleading 50%. This is how investors fool themselves.
The real ROI on this flip is:
($60,000 Net Profit / $240,000 Cost of Investment) x 100 = 25% ROI.
Stock Purchase Example
Calculating ROI for stocks follows the same logic, you just have to account for fees. You buy 100 shares of a company at $50 per share, an initial layout of $5,000. But you also paid a $10 brokerage fee. Your total cost is actually $5,010.
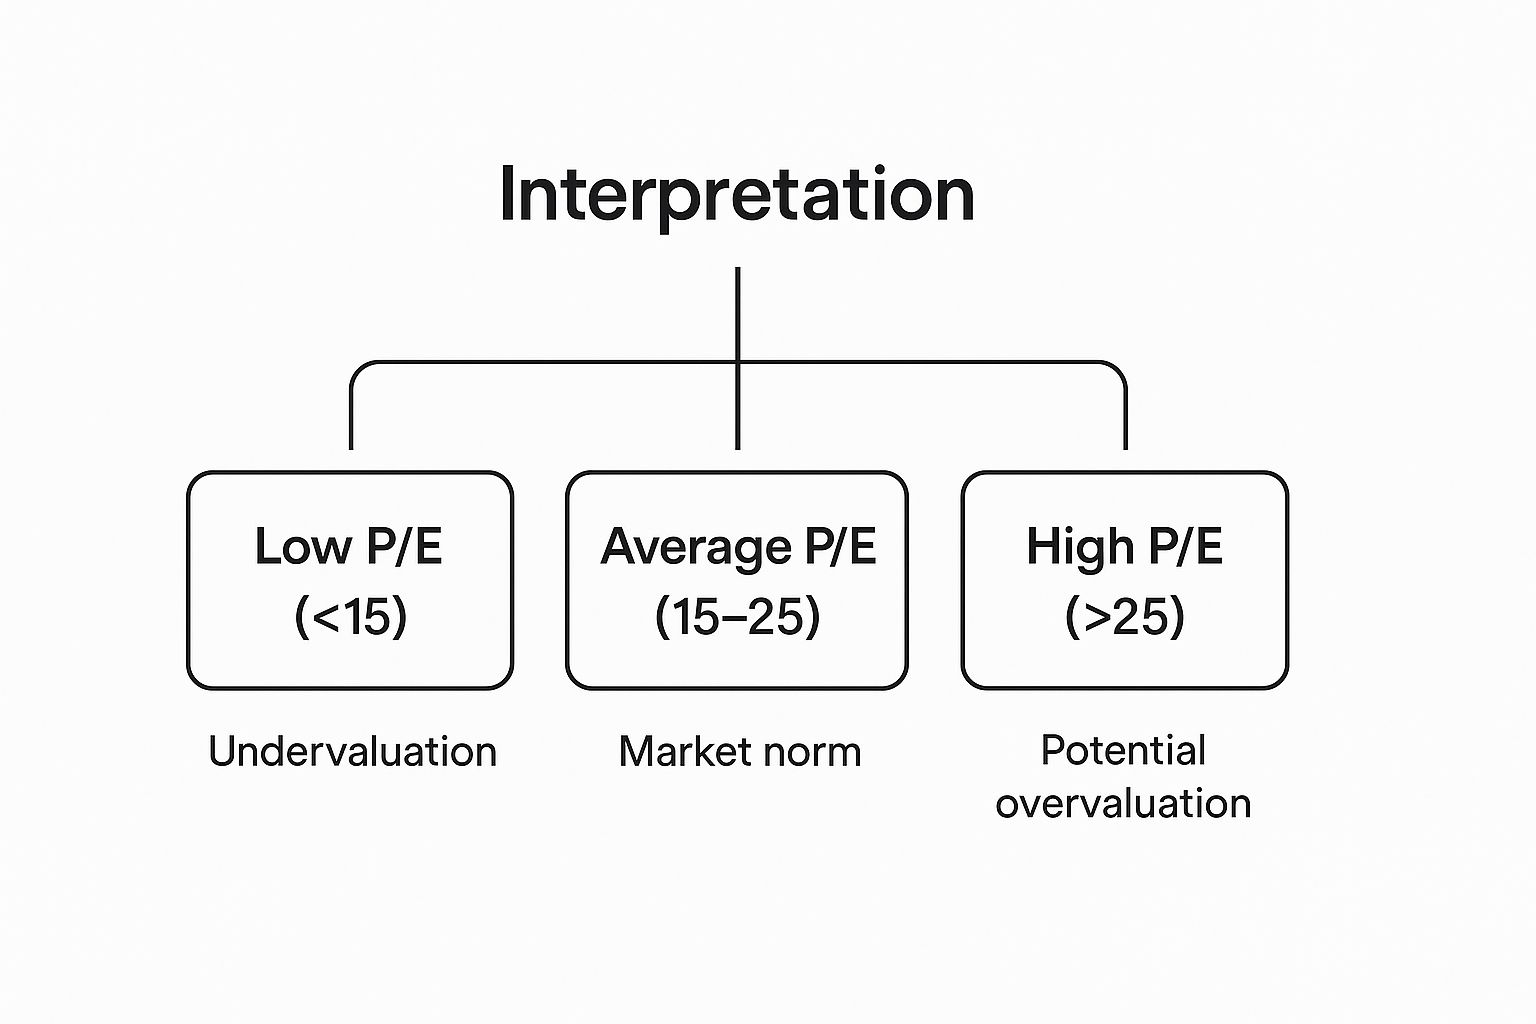
For investors who want to go deeper than just price and ROI, our guide on understanding the price-to-earnings ratio is a great place to start.
A year later, you sell all the shares for $60 each, pocketing $6,000. But again, there's a $10 commission on the sale. Your true net gain is $980 ($6,000 sale price – $5,010 initial cost – $10 sale fee).
So, the ROI on your stock trade is:
($980 Net Profit / $5,010 Cost of Investment) x 100 = 19.56% ROI.
As you can see, the core formula adapts to just about any scenario. If you want to see it applied to another common investment type, this guide on how to calculate CD returns breaks it down with clear examples and formulas. The principles are universal.
Putting Your ROI Into Meaningful Context

So you've run the numbers and calculated your return on investment. Great. But that number, all by itself, is almost meaningless. A 10% ROI might be a phenomenal success for one investment and a complete dud for another. To really figure out if you made a good move, you need to add context.
Context is what turns a simple percentage into an actionable insight. It helps you answer the real question: "Was this a good return?" This is where you graduate from the basic math of ROI and step into the art of financial analysis. It's a skill I've had to hone over years of wins and losses.
The first thing you need to do is benchmark your results. You have to compare your ROI against industry standards, your own historical performance, and what other investments could have given you. If your real estate flip brought back 8%, but similar properties in the same neighborhood averaged 15%, your result suddenly looks very different.
A common trap I see new investors fall into is celebrating any positive ROI without a second thought. They forget about opportunity cost. If you earned 5% on a low-risk bond while the broader stock market jumped 20%, you didn't necessarily make a "good" investment—you just made a profitable one. There's a big difference.
Comparing Against Asset Classes And Market Conditions
Different investments come with different expectations. It’s just the nature of the game. You wouldn't expect a sleepy government bond to deliver the same returns as a high-growth tech stock, so you shouldn't judge them with the same yardstick. The overall market environment is a huge piece of the puzzle, too.
Look at the historical numbers. In 2019, U.S. large-cap stocks, which you can track with the S&P 500, shot up an incredible 31.49%. That same year, international stocks (using the MSCI EAFE Index as a proxy) gained only 18.88%. The next year, even with a major downturn, the S&P 500 still pulled off an 18.40% gain, which shows just how resilient—and volatile—some markets can be. For more great data, you can check out the historical returns on different asset classes from Novel Investor.
These figures drive home why context is everything. Nailing a 15% return when the market is flying high at 30% feels a whole lot different than getting that same 15% when the market is completely flat. One feels like a missed opportunity, the other feels like a genius move.
Key Contextual Factors to Consider
When you’re looking at your ROI, you need to ask some critical questions to get the full picture. I always run through this mental checklist:
- What was the time horizon? A 20% return in one month is legendary. That same 20% over ten years? Not so much.
- What was the risk level? Did you have to sweat bullets for that return? High-risk ventures should come with the potential for much higher rewards to make them worthwhile.
- How did it stack up to a benchmark? If you bought a stock, measure its performance against an index like the S&P 500. For real estate, look at local market trends.
- What were the market conditions? Bagging any positive return during a recession is a massive win. Context matters.
By layering these factors over your initial calculation, you move from a flat number to a rich, three-dimensional view of your financial performance. That's how you really learn and get better.
Beyond the Basics with Advanced ROI Metrics
The standard return on investment formula is a fantastic starting point. It gives you a quick, clean percentage. But in the real world, things get messy.
What happens when you need to compare two investments with completely different lifespans? A 20% return over six months is a world away from a 20% return over five years. This is where the basic ROI formula falls short—and can actually be pretty misleading if you're not careful.
To make fair, apples-to-apples comparisons, you have to annualize your returns. This just means converting the total return into its equivalent yearly rate. It levels the playing field, regardless of how long you held the investment, and is an essential step for anyone trying to understand true performance.
Annualized ROI and CAGR
The two most common tools for this job are Annualized ROI and the Compound Annual Growth Rate (CAGR). They're similar, but they have slightly different jobs.
- Annualized ROI is simpler and works great for investments held for less than a year.
- CAGR is more precise for multi-year investments because it accounts for the magic of compounding.
Let's walk through a quick example. Say you invest $10,000 and it grows to $12,000 in just six months. The basic ROI is a solid 20%. But to compare it to a stock you've held for years, you need to annualize it. The Annualized ROI comes out to be roughly 40%, showing its impressive short-term performance.
The core idea here is that time is a critical, yet often overlooked, variable in the ROI equation. Without annualizing, you're comparing apples to oranges, which can lead you to favor a less profitable investment simply because its total return looks bigger on paper.
Understanding this concept is fundamental, especially for long-term investing. The historical average annual return of the U.S. stock market (S&P 500) has hovered around 8.0% since 1957. If an investment of yours doubled over 10 years, its basic ROI is 100%. That sounds great, but its annualized return (calculated with CAGR) is only about 7.18% per year. This shows how compounding works its magic over time, generating substantial growth from seemingly modest annual gains. You can dive deeper into these historical market returns on the NYU Stern website.
As you get more serious about evaluating your investments, you'll want to move beyond basic ROI. Getting a solid grasp of other financial metrics is essential. We cover many of these in our guide on Mastering Excel Financial Formulas. Using these advanced metrics gives you a far more accurate picture of how your portfolio is really performing over time.
Common Mistakes to Avoid When Calculating ROI
Knowing the ROI formula is one thing. Actually getting a number you can trust is another thing entirely.
It’s surprisingly easy to get the math right but the entire analysis wrong. I’ve seen it happen countless times—people end up making poor financial decisions based on a dangerously misleading ROI figure. Let's walk through the traps I see most often so you can sidestep them.
One of the biggest pitfalls is forgetting hidden costs. People get laser-focused on the initial purchase price and what they hope to sell for, but they completely gloss over all the expenses that pile up in between.
Think about it: maintenance on a rental property, annual subscription fees for a business tool, or the taxes you'll owe on capital gains. These aren't minor details; they can drastically slash your actual net profit. If you don't account for every single dollar spent, you're just looking at an inflated, fantasy ROI.
Another classic error is ignoring the time value of money. A 15% return you make in one year is a whole lot better than a 15% return that took you five years to get. The basic ROI formula doesn't care about the difference, which is a major flaw. For any serious comparison between two investments, you absolutely have to look at annualized returns. It’s the only way to see which one truly performed better on a year-by-year basis.
A critical mistake is using ROI as your only decision-making metric. It tells you about profitability but says nothing about risk or cash flow. An investment might show a high potential ROI but be so volatile it could wipe you out, or it might tie up all your money and leave you unable to pay bills.
Looking Beyond the Simple Percentage
Relying solely on ROI without peeking at other financial health indicators is a recipe for trouble. For example, a project can have a fantastic ROI on paper but be a total cash drain on the business.
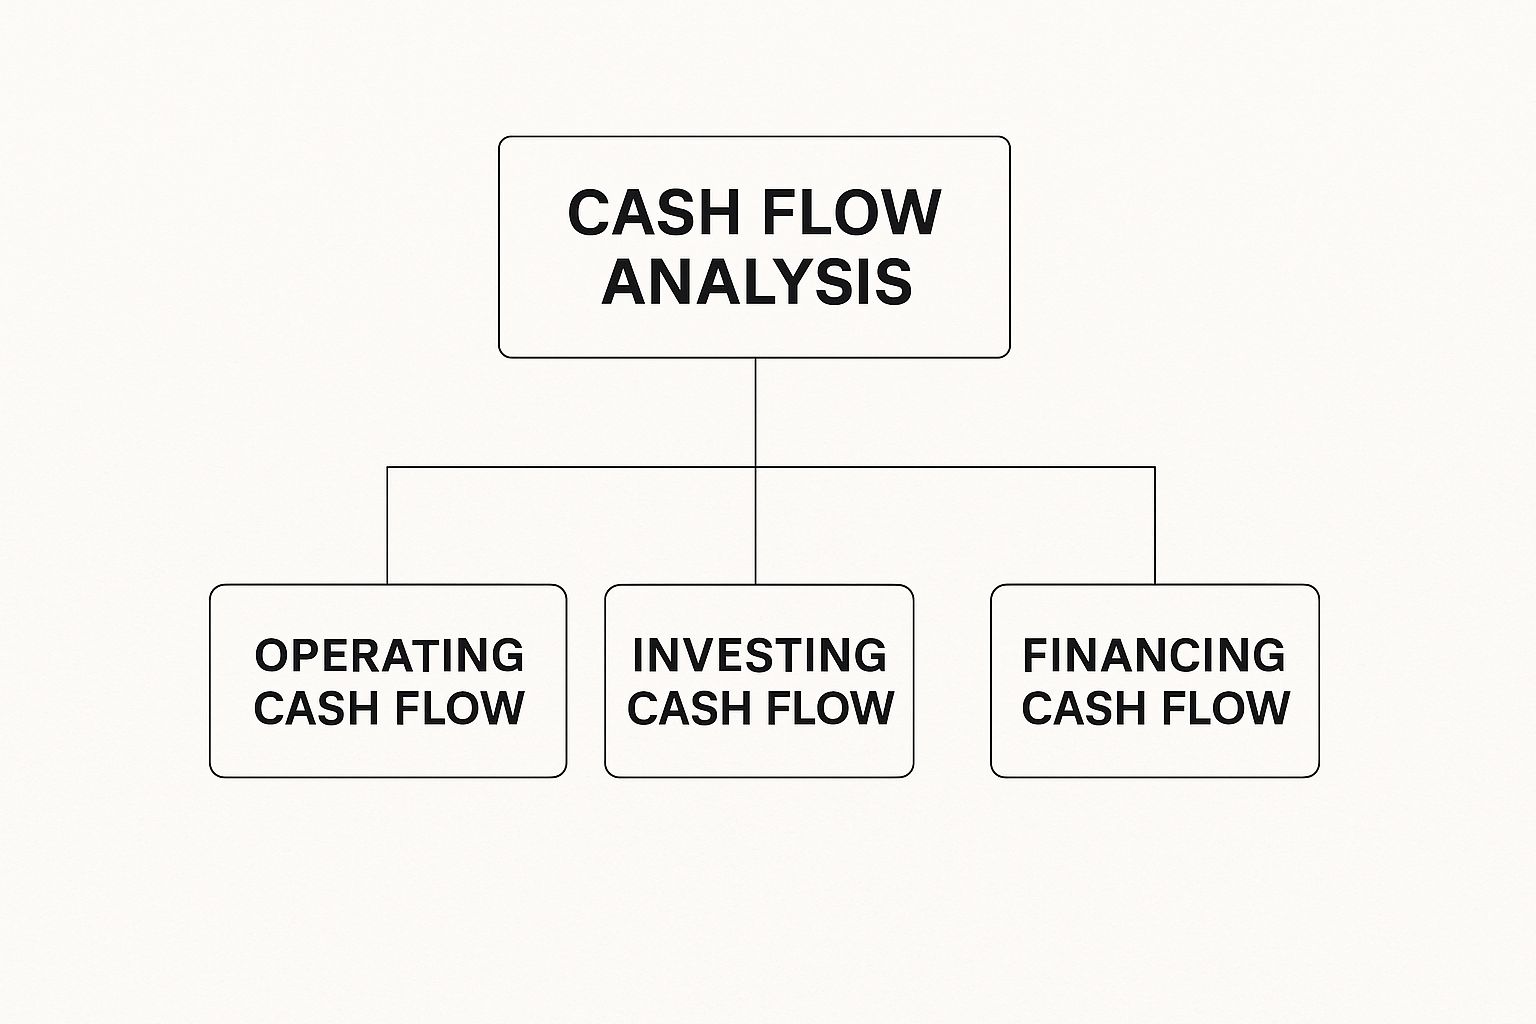
To get the full picture, you have to look at other metrics. For anyone managing a business or a complex asset, learning what is cash flow analysis is an essential next step. It provides a much-needed dose of reality.
To make sure your analysis is robust and honest, always double-check for these common traps:
- Incomplete Cost Accounting: Have you really included all the fees, taxes, maintenance, and operational costs? Be ruthless here.
- Ignoring Time Horizon: Are you comparing investments over similar timeframes? If not, have you annualized the returns for an apples-to-apples view?
- Risk Negligence: How much risk did you take on to get that return? A high return from a safe bet is worlds apart from a high return on a speculative gamble.
- Overlooking Benchmarks: How does your ROI stack up against the market? Compare it to a relevant index (like the S&P 500) or the industry average.
By consciously sidestepping these mistakes, you move beyond a simple, and often flawed, calculation. You empower yourself to conduct a truly insightful investment analysis that leads to smarter decisions.
Common Questions About ROI (And Straightforward Answers)
Once you get the hang of the ROI formula, the real questions start popping up. It's one thing to do the math, but it's another to actually apply it with confidence to your own investments.
Let's dig into some of the most common questions I hear.
What Is a Good ROI, Anyway?
This is the million-dollar question, and the honest-to-goodness answer is: it depends. There’s no magic number. A "good" ROI is completely relative to the investment's risk, the industry you're in, and what you're personally trying to achieve.
That said, we can look at some general benchmarks to get a sense of the landscape:
- Stocks: The S&P 500 has historically returned around 10% annually over the very long term. If you're beating that, you're generally doing quite well.
- Real Estate: This varies wildly by location, but a lot of rental property investors I know shoot for an 8-12% cash-on-cash return.
- Business Projects: Inside a company, an internal project often needs to clear a much higher bar. They're often looking for an ROI that blows their cost of capital out of the water, sometimes 15% or more.
How Is ROI Different from ROE or ROA?
Think of ROI as your trusty, all-purpose measuring stick. It’s a simple, direct way to see what you got back versus what you put in.
Return on Equity (ROE) and Return on Assets (ROA), on the other hand, are more specialized tools you'll find in a corporate finance analyst's toolkit. They’re used to dissect a company's performance by looking at its financial statements.
ROE tells you how effectively a company is using shareholder money to generate profits. ROA measures how much profit the company squeezes out of every dollar of its assets. They're powerful for analyzing big corporations but aren't really built for sizing up your personal investment portfolio.
Can ROI Be Negative?
Absolutely. And it happens more than you'd think. A negative ROI just means you lost money—the final value of your investment was less than what it cost you to get in.
Let's walk through a painful, but realistic, example. You buy a stock for $1,000 and pay a $10 commission. Your total cost is $1,010. The stock then takes a nosedive, and you decide to cut your losses and sell it for $700, paying another $10 commission on the way out. Your net proceeds from the sale are only $690.
Your net profit is actually a net loss of $320 ($690 – $1,010).
Plugging that into the formula, it looks like this:
(-$320 Loss / $1,010 Cost) x 100 = -31.7% ROI
Seeing that negative number isn't fun, but it’s a crystal-clear sign that the investment didn't pan out.
Ready to build your investing knowledge with real-world examples and transparent analysis? Subscribe to the free Investogy newsletter and follow a real-money portfolio in a quick 3-minute read. Join us at https://investogy.com.