Category: Articles

  • What is Intrinsic Value? Clear Explanation & Examples

    What is Intrinsic Value? Clear Explanation & Examples

    If you've ever felt like the stock market is just one big casino, you're not alone. Prices fly up and down based on headlines, tweets, and whatever the mood is that day. But what if there was a way to figure out what a company is actually worth, completely separate from all that noise?

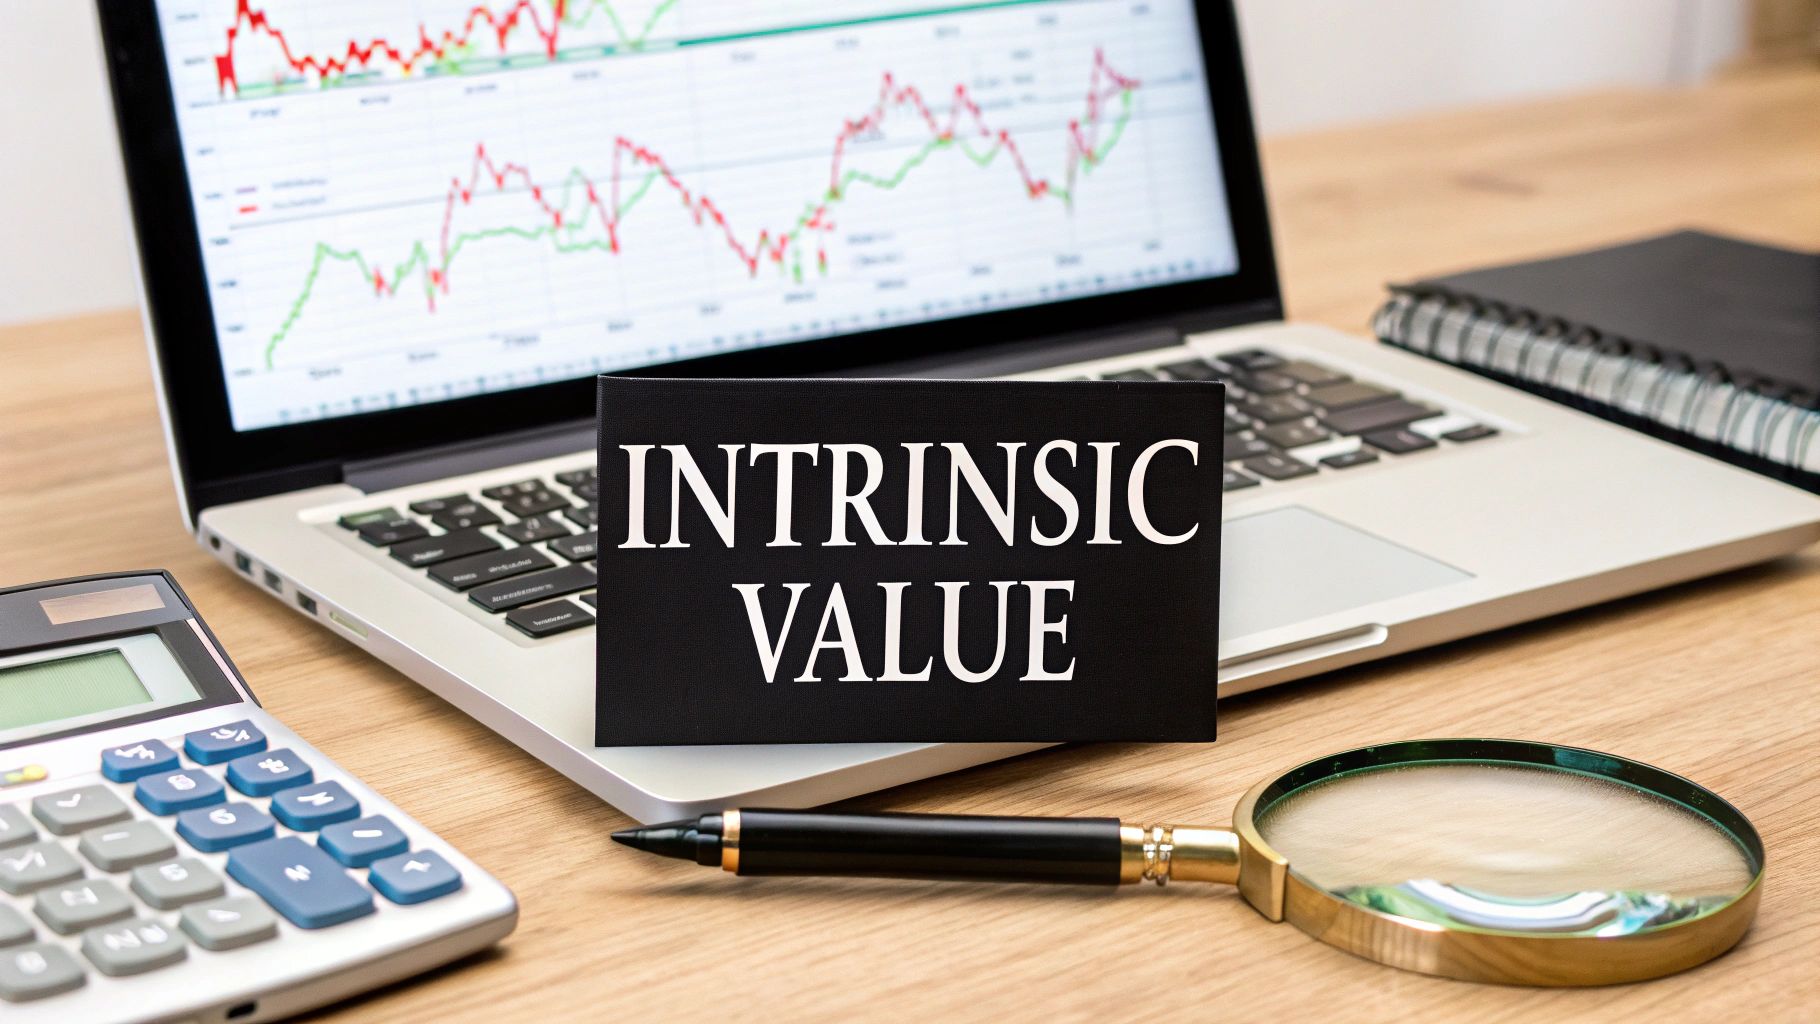
    That’s where intrinsic value comes in.

    Think of it as the price a perfectly logical, unemotional investor would pay for a business after doing all their homework. It’s an estimate of a company's true underlying worth, based on its financial health and ability to make money in the future.

    Understanding Intrinsic Value in Simple Terms

    Image

    Let’s use a real-world example. Imagine you’re shopping for a house. The seller has it listed for $500,000—that’s its market price. It’s what they’re asking for right now.

    But you're a savvy buyer. You look at the leaky roof, the outdated kitchen, the recent sales in the neighborhood, and what you could realistically rent it for. After running the numbers, you figure the house is really only worth $450,000. That calculated number? That's its intrinsic value.

    It's the exact same game in investing. A stock's market price is just what it's trading for at this very second. Intrinsic value, on the other hand, is a carefully calculated estimate of its real, fundamental worth.

    This whole idea is the foundation of value investing, a philosophy pioneered back in the 1920s by the legendary Benjamin Graham and David Dodd. They taught that smart investors should ignore the market’s mood swings and focus on the business itself. You can get a great overview of their work from Columbia Business School, where it all started.

    The core idea is simple: A stock has a price, and it has a value. The goal is to buy when the price is significantly below the value.

    Grasping this concept helps you answer the most important question an investor can ask: "Is this stock a genuine bargain, or is it just cheap for a very good reason?" Making that distinction is what separates disciplined, long-term investing from pure speculation.

    Why Intrinsic Value Is Your Investing North Star

    Image

    If you get a handle on intrinsic value, you unlock the single most powerful tool in long-term investing: the margin of safety. This is the core idea Benjamin Graham built his philosophy on, and it's what made his student Warren Buffett a household name. At its heart, it’s a defense mechanism against emotional decisions and the market's craziness.

    Think about it like building a bridge. If a bridge is engineered to hold 10,000 pounds, you wouldn't drive a 9,999-pound truck across it, would you? Of course not. You need a buffer for unexpected stress, and that buffer is your margin of safety.

    Investing is no different. If you do your homework and calculate a stock’s intrinsic value is about $100 per share, you don't jump in and buy it at $99. Instead, you wait. You patiently watch until the market, in one of its irrational moods, offers it to you for something far lower—maybe $70 or even $60.

    That gap between the true value ($100) and your purchase price ($60) is your margin of safety. It's your cushion. It protects you if your initial calculations were a bit optimistic or if the company hits a rough patch you didn't see coming.

    Making Rational Decisions in an Irrational Market

    This disciplined approach forces you to be patient and rely on data, not hype. It shifts your entire focus from a stock’s wild price swings to the actual health of the underlying business. Is it consistently profitable? Does it have a real, durable competitive advantage? These are the questions that truly matter.

    By anchoring every decision to your own calculation of intrinsic value, you can tune out the market’s daily noise and avoid getting swept up in the latest hot stock. This isn't just theory; recent research confirms that intrinsic value is a much better predictor of stock returns than most of the common metrics people follow.

    In fact, one study showed that a portfolio strategy built around this very principle delivered an annualized outperformance of about 6.7% over two decades. You can explore the full findings on intrinsic value investing here.

    "The three most important words in investing are 'margin of safety.' It's the cornerstone of investment success." – Benjamin Graham

    This principle is the bedrock of value investing, but honestly, it’s a lesson that serves every single investor well. You can learn more about different investing strategies in our guide. When all is said and done, intrinsic value is the compass that will help you confidently navigate the inevitable storms of the market.

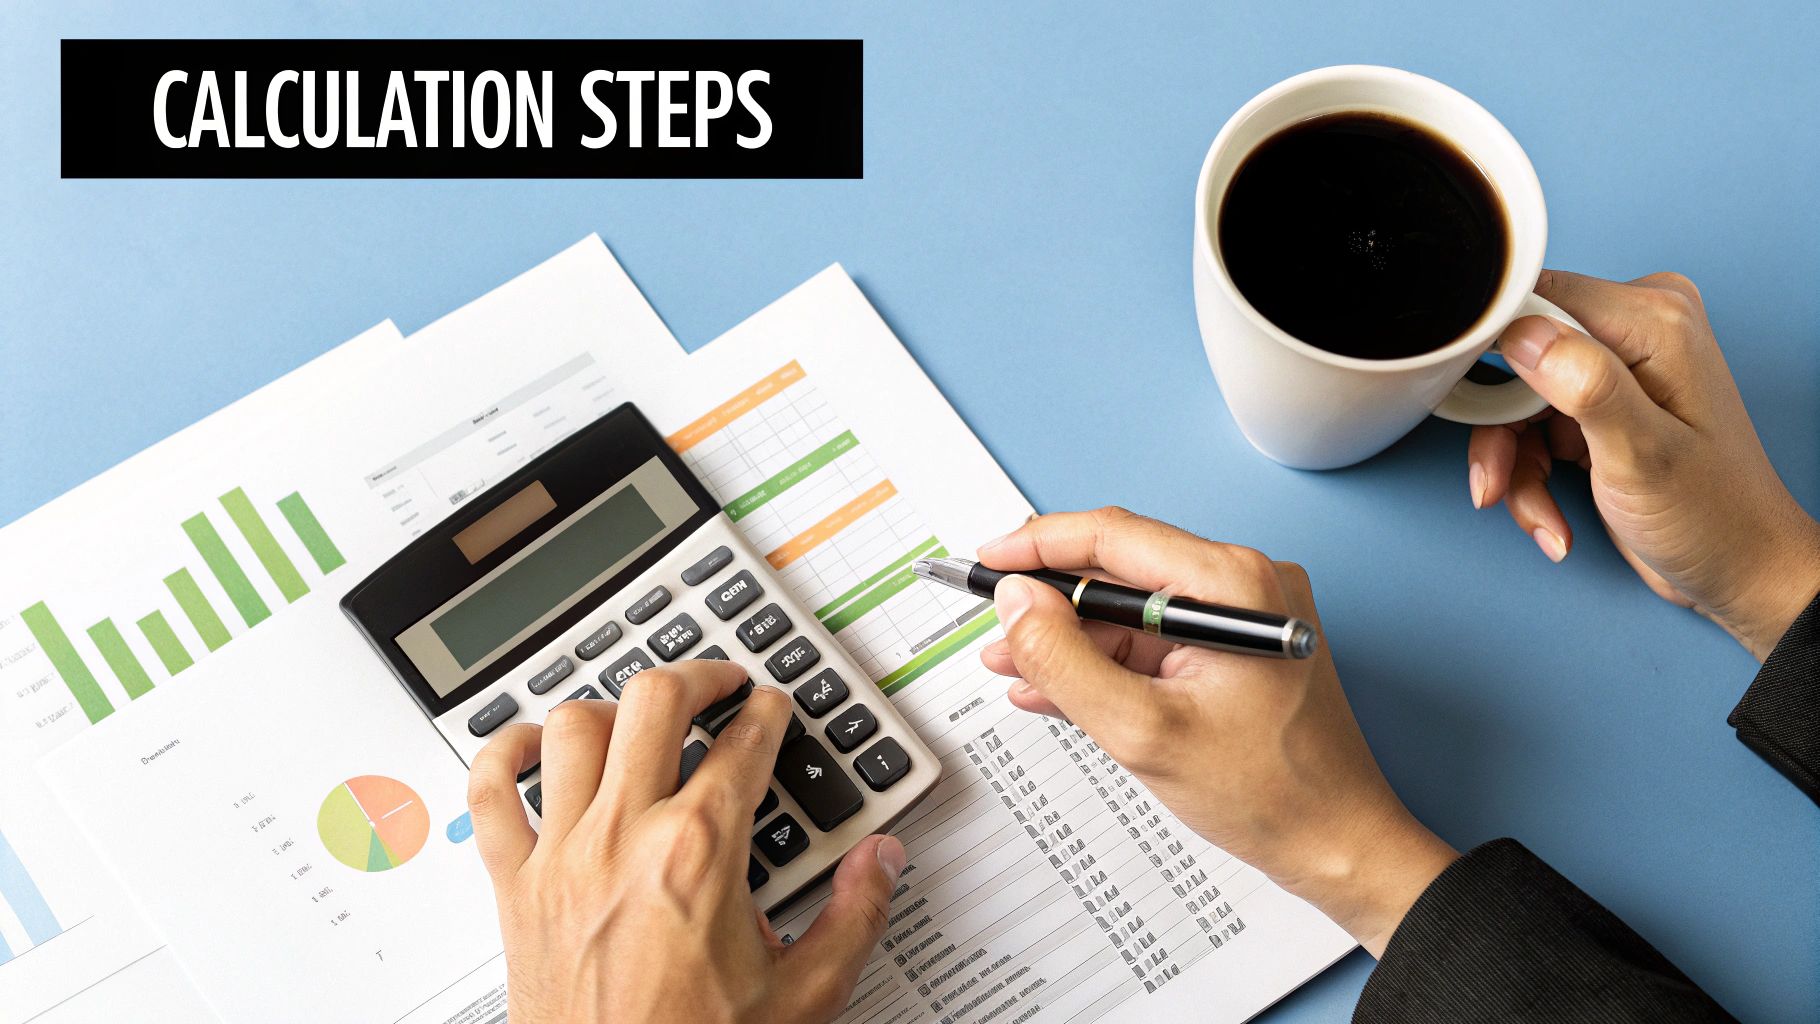
    Calculating Intrinsic Value with DCF Analysis

    Alright, let's move from theory to action. Of all the tools in an investor's toolkit, the Discounted Cash Flow (DCF) model is the gold standard for figuring out what a company is really worth. It might sound a little intimidating, but the idea behind it is actually pretty simple—and incredibly powerful.

    Think of it like this: if you wanted to buy a local coffee shop, how would you value it? You wouldn't just look at last month's sales. You'd try to guess how much cash it will spit out over its entire lifetime, then figure out what all that future money is worth to you today. That's DCF analysis in a nutshell.

    The Core Components of DCF

    At its heart, the DCF model does two things: it predicts the future and then brings that future value back to the present.

    • Forecasting Free Cash Flow (FCF): This is the lifeblood of a company. It’s the actual cash left over after a business pays for everything it needs to run and grow. Think of it as the money that could, in theory, be handed directly to shareholders. The first big step is to project this FCF number for the next five or ten years.
    • Determining the Discount Rate: A dollar today is worth more than a dollar next year. That's because of inflation and the risk that you might not get that future dollar at all. The discount rate is simply the interest rate we use to translate those future cash flows into today's dollars. Riskier companies get a higher discount rate, which results in a lower intrinsic value.

    This graphic really helps visualize how the pieces fit together.

    Image

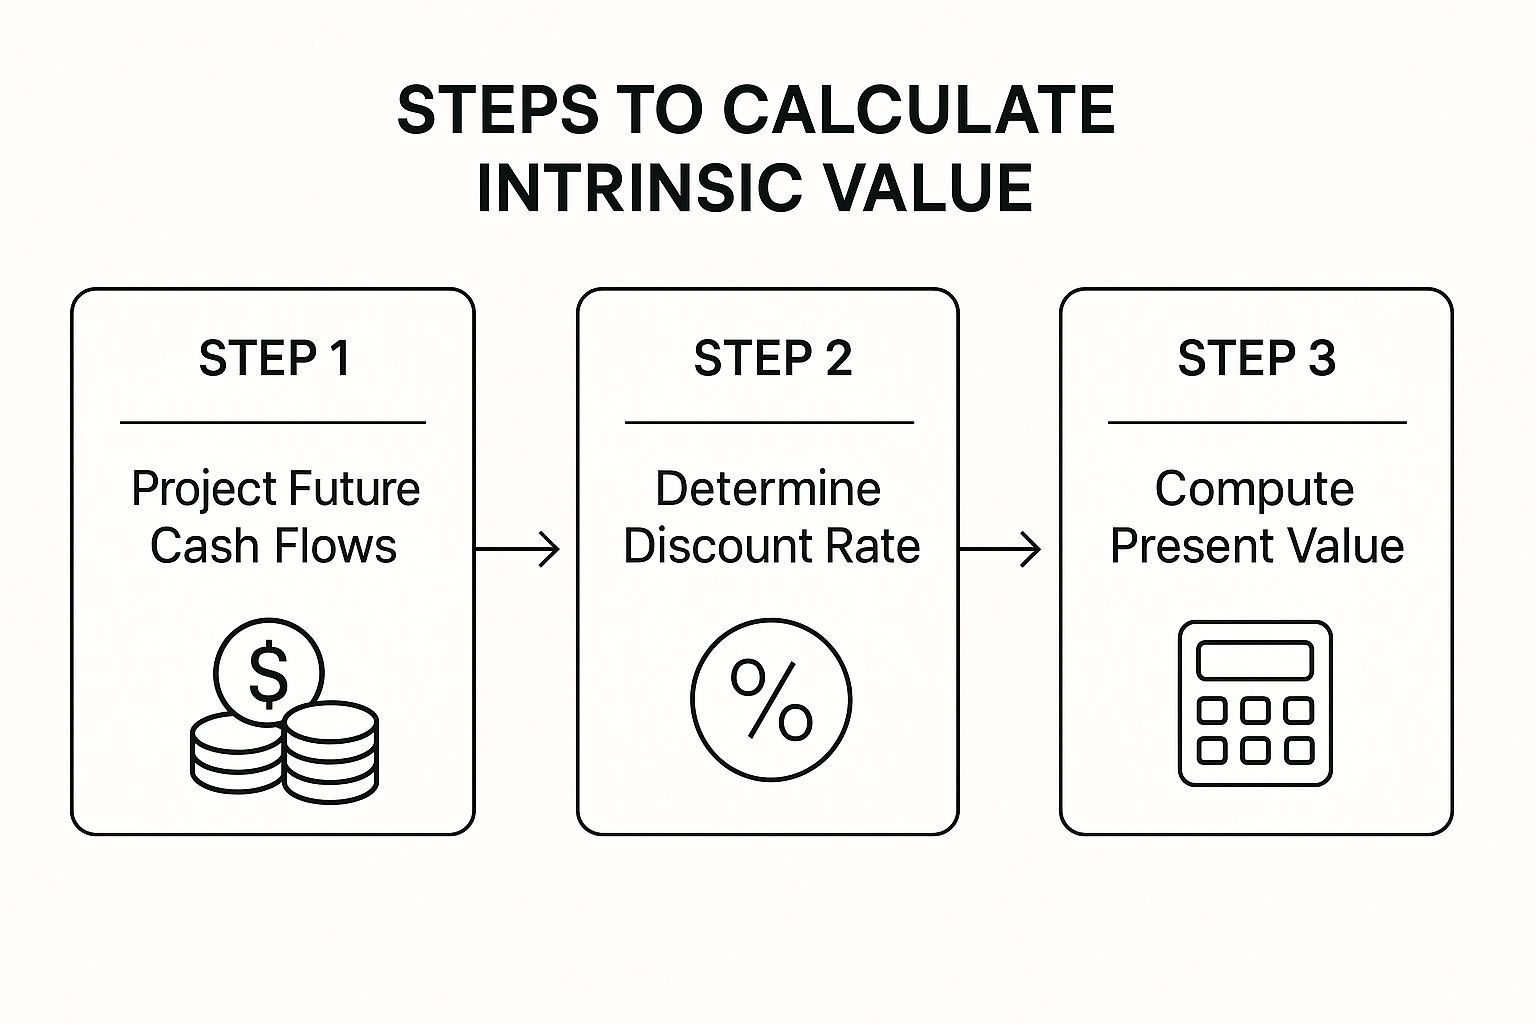
    As you can see, it's a logical flow—from predicting what's to come, to figuring out what it's worth right now.

    Putting It All Together

    Once you've got your cash flow forecasts and you've settled on a discount rate, the rest is just math. You take each year's projected cash flow and "discount" it back to what it's worth today.

    Add up all those present values, and voilà—you have an estimate of the company's intrinsic value. It’s a quantitative way to anchor your valuation in the company's ability to generate cold, hard cash.

    Key Takeaway: DCF isn’t about finding one perfect, magic number. It's an exercise in disciplined thinking. It forces you to get real about a company’s long-term prospects, its competitive moat, and all the things that could go wrong.

    The final number is extremely sensitive to your assumptions. Tweak the growth rate or the discount rate just a little, and the valuation can swing wildly. This is why it’s often called more of an art than a science.

    For a deeper dive into the mechanics, you can check out our detailed guide on what discounted cash flow is. Ultimately, DCF gives you a rational framework to base your decisions on, moving you away from market hype and toward financial reality.

    Exploring Other Company Valuation Methods

    Image

    While the DCF model is a beast for digging into a company's intrinsic value, it's definitely not the only tool in the shed. Relying on just one valuation method is a rookie mistake. Smart investors know that the real magic happens when you cross-reference your numbers using a few different techniques.

    Think of it like getting a second opinion from a doctor before a big procedure. You might trust the first one, but getting confirmation from another expert gives you the confidence to move forward. Combining valuation methods helps you catch your own biases and avoid the tunnel vision that comes from staring at a single spreadsheet for too long.

    Comparable Company Analysis

    One of the most common-sense approaches is Comparable Company Analysis (CCA), often just called "comps." The logic is beautifully simple: a company should be worth roughly the same as other, similar companies. It’s the same way you’d price your house—you’d look at what similar homes on your street sold for recently.

    With comps, you're looking at metrics like the Price-to-Earnings (P/E) ratio or Enterprise Value-to-EBITDA (EV/EBITDA) for a group of the company's direct competitors. You then take the average of those multiples and apply it to the company you're analyzing. It's a fantastic reality check that tells you what the market is willing to pay for a similar business right now.

    Asset-Based Valuation

    Another angle is the Asset-Based Valuation method. This one is as straightforward as it gets. You simply add up everything the company owns—cash, buildings, equipment, inventory—and then subtract everything it owes.

    The core question here is: "If we had to sell off this entire company piece by piece tomorrow, what would we have left after paying all the bills?"

    This approach gives you a rock-solid "floor" value for a business. It’s especially useful for heavy industrial companies, banks, or any business that’s potentially facing hard times. It strips away all the hype about future growth and focuses purely on tangible, here-and-now worth.

    To get the most complete view, it's best to look at all three of these approaches—DCF, comps, and asset-based—together. Each one tells a different part of the story, and using them in tandem helps you triangulate a much more reliable estimate of what a company is truly worth.

    To help you keep these straight, here’s a quick breakdown of how these three core methods stack up against each other.

    Comparison of Key Valuation Methods

    Valuation Method Best For Pros Cons
    Discounted Cash Flow (DCF) Stable, mature companies with predictable cash flows. Focuses on fundamentals and long-term potential; less swayed by market moods. Highly sensitive to assumptions about future growth and discount rates.
    Comparable Company Analysis Businesses in established industries with plenty of public competitors. Grounded in current market reality; relatively quick and easy to apply. Can be misleading if the market is overvalued or undervalued as a whole.
    Asset-Based Valuation Asset-heavy industries (e.g., manufacturing, real estate) or companies in distress. Provides a conservative "floor" value; based on tangible assets. Ignores intangible assets like brand value and future growth potential.

    As you can see, there’s no single "best" method—the right tool depends on the company you’re looking at. By combining their insights, you can build a much more nuanced and dependable valuation.

    Common Mistakes to Avoid When Estimating Value

    Figuring out a company's intrinsic value is definitely more art than science, and it’s shockingly easy to stumble into a few common traps. The biggest one? The classic "garbage in, garbage out" problem. Your final valuation is only as solid as the assumptions you plug into your model.

    Overly optimistic growth projections are probably the most frequent offender. It’s tempting to draw a straight line up and to the right, assuming a company will keep growing at a breakneck pace forever. But the reality is, very few businesses can sustain that kind of momentum for long. Always ground your forecasts in what’s actually happened historically and what’s going on in the broader industry.

    Ignoring Qualitative Factors

    Another major pitfall is getting completely lost in the numbers. It's easy to do. You get so focused on the spreadsheet that you forget about the crucial elements that don't fit neatly into a cell. These are often the real drivers of long-term success.

    What am I talking about? Things like:

    • Management Quality: Is the leadership team experienced, honest, and smart about where they put the company's money?
    • Competitive Moat: Does the company have a durable advantage—like a monster brand or a network that’s impossible to replicate—that keeps competitors at bay?
    • Industry Headwinds: Are there big technological shifts or regulatory changes on the horizon that could kneecap the business model?

    A purely quantitative approach misses half the story. To make sure your estimates are solid and you're not overlooking huge risks, using an essential due diligence checklist that covers financial, legal, and market factors is a must. It keeps you honest.

    A great company at a fair price is superior to a fair company at a great price. A deep understanding of the business itself is non-negotiable.

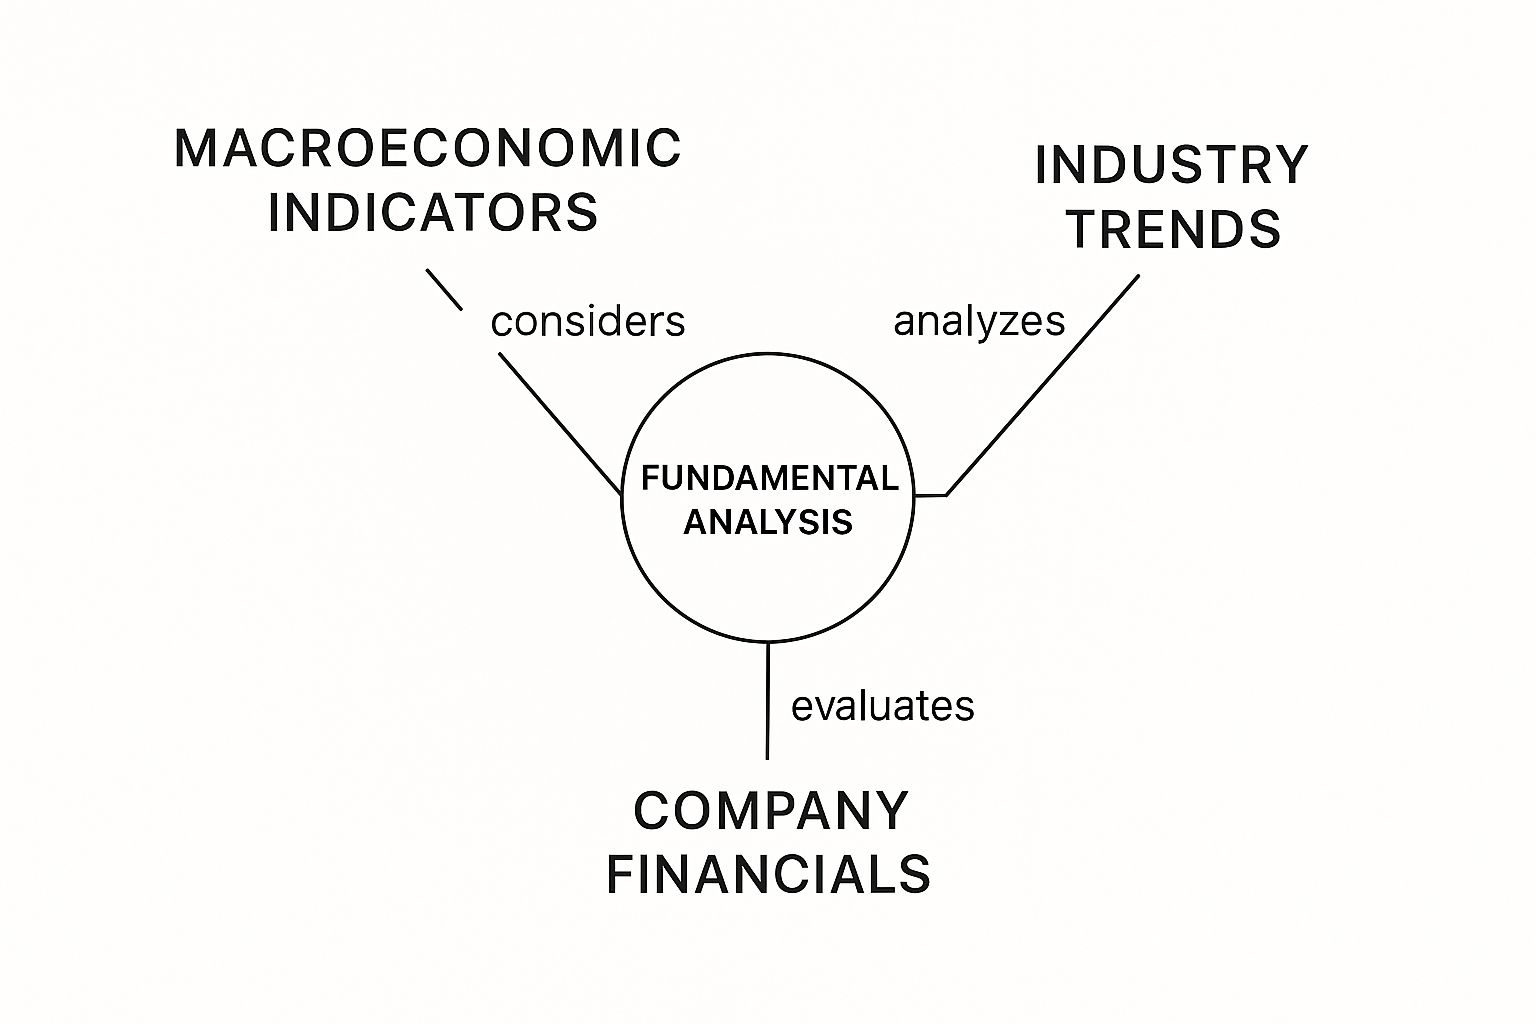
    Ultimately, these qualitative insights are at the heart of good valuation. The entire process is just a practical application of the ideas behind what fundamental analysis is—it’s about getting to know the whole business, not just its financial reports. By blending rigorous number-crunching with a clear-eyed view of these "softer" factors, you can sidestep the common errors and land on a much more reliable estimate of a company's true worth.

    Still Have Questions About Intrinsic Value?

    Even after getting the hang of the main ideas, it’s totally normal to have some questions about how all this plays out in the real world. Let's dig into some of the most common ones I hear. Getting these sorted helps bridge that gap between just knowing the theory and actually using it to make smarter investment decisions.

    Can a Company Actually Have a Negative Intrinsic Value?

    Believe it or not, yes. It's rare, but it's theoretically possible. If a company is just bleeding cash year after year with no end in sight, and its debts dwarf its assets, the math could absolutely spit out a negative number.

    Think of it this way: a business like that isn't just unprofitable, it's actively destroying value. For an investor, seeing a negative intrinsic value is a massive red flag. It's often a sign of a company circling the drain, and it’s a stock you’d want to avoid like the plague.

    How Often Should I Recalculate This Stuff?

    There's no single magic number here. A good starting point is to revisit your calculations quarterly, right after a company drops its latest earnings report. That's when you get a fresh flood of data on sales, profits, and cash flow to work with.

    But don't just stick to a schedule. You absolutely need to run the numbers again anytime something major happens. This could be a huge acquisition, a scary new competitor popping up, a big pivot in company strategy, or even a macro-level shift like the Fed suddenly jacking up interest rates.

    Is Intrinsic Value Only for "Value Stocks"?

    It’s the bread and butter of value investing, for sure, but it’s just as critical when you're looking at high-flying growth stocks. The mindset is just a little different.

    • With value stocks, you're hunting for a big gap—a market price that's way cheaper than your calculated intrinsic value.
    • With growth stocks, the story is all about the future. A DCF analysis is your reality check to see if that sky-high stock price is even remotely justified by plausible growth down the road.

    At the end of the day, it's about not overpaying. Estimating intrinsic value keeps your feet on the ground and your decisions rooted in financial reality, not just market hype. That discipline is what separates serious long-term investors from the crowd.


    At Investogy, we use these same principles to analyze every stock in our real-money portfolio. Subscribe to our free weekly newsletter to see how we apply intrinsic value to make real investment decisions. Join Investogy for free.

  • What Is Beta in Stocks An Investor’s Guide

    What Is Beta in Stocks An Investor’s Guide

    If you’ve spent any time at all around the stock market, you’ve probably heard people throw around the term "beta." It’s one of those fundamental ideas in investing, and understanding it is key to making smarter decisions.

    So, what is it? In simple terms, beta is a number that tells you how volatile a stock is compared to the overall market. Think of the market as the ocean on an average day. Some boats (stocks) will rock gently with the waves, while others will lurch dramatically. Beta is the measure of how much a particular boat tends to rock.

    What Is Beta and Why Does It Matter?

    Image

    At its core, beta is a risk metric. It quantifies how a stock's price moves in relation to a benchmark index, which is usually the S&P 500 for the U.S. market. By getting a handle on a stock's beta, you can get a pretty good idea of how it might react when the entire market goes on a bull run or hits a rough patch.

    This single number gives you a quick snapshot of a stock’s personality. Is it a high-flying growth stock that rides market waves for all they're worth? Or is it a steady, defensive player that stays relatively calm when things get chaotic? The answer is right there in its beta.

    The Three Core Beta Scenarios

    Interpreting beta is actually pretty simple once you know the magic number: 1.0. Everything revolves around it.

    • Beta Greater Than 1.0: This means the stock is more volatile than the market. A stock with a beta of 1.5, for example, is expected to move 50% more than the market. If the S&P 500 climbs 10%, you might see this stock jump 15%. Of course, the same is true on the way down.
    • Beta Equal to 1.0: The stock's price tends to move right in line with the market. It essentially mirrors the market's ups and downs with the same intensity. Think of a big S&P 500 ETF—its beta will be very close to 1.0.
    • Beta Less Than 1.0: This stock is less volatile than the overall market. A company with a beta of 0.7 would be expected to move 30% less than the market. Big, stable utility companies or consumer staples often fall into this camp.

    Understanding a stock's beta is crucial because it helps you align your investments with your personal risk tolerance. It’s a key piece of data, much like when you learn about what is market capitalization to gauge a company's size.

    Quick Guide to Interpreting Beta Values

    To make it even clearer, here’s a simple table breaking down what these beta values really mean for you and your portfolio.

    Beta Value Volatility vs. Market What It Means for Investors
    > 1.0 Higher Volatility Higher risk, but also the potential for higher returns. Often favored by aggressive, growth-focused investors.
    = 1.0 Same Volatility Moves in lockstep with the market. Perfect for investors who want market-like risk and return.
    < 1.0 Lower Volatility Lower risk and, generally, more modest returns. A great way to add stability to a portfolio, especially during downturns.

    Think of beta as a tool in your investor toolkit. It helps you build a portfolio that doesn’t just chase returns but also lets you sleep at night, no matter what the market is doing.

    How Stock Beta Is Actually Calculated

    Knowing what beta means is one thing, but understanding where the number actually comes from gives you a whole other level of confidence in your analysis. This isn't just some arbitrary figure plucked from thin air; it’s the result of a solid statistical process designed to measure a stock's relationship with the broader market.

    At its heart, the calculation is a classic case of quantitative analysis in finance, where we use math to make sense of market risk. The main tool for the job is regression analysis. This sounds complex, but the idea is simple: you compare a stock's historical price movements to the movements of a market index, like the S&P 500, over the same period.

    The whole point is to find the "line of best fit" that describes how the two move together. The slope of that line is the stock's beta. A steep slope (greater than 1) means the stock tends to be more volatile than the market. A flatter slope (less than 1) tells you the stock is less sensitive to the market's ups and downs.

    This infographic neatly sums up the steps.

    Image

    As you can see, it’s a systematic way of turning a pile of historical data into a practical, forward-looking risk metric.

    Standard Industry Practices

    To keep everyone on the same page, financial data providers generally stick to a standard formula. The common practice is to look at five years of monthly returns for both the stock and the chosen index. Using a five-year window helps smooth out any short-term market weirdness and gives a more stable, reliable picture of the relationship.

    But here’s the thing: a beta calculated purely from past data isn't always the best predictor of the future. And that’s where a pretty smart adjustment comes into play.

    The Blume Adjustment for a More Realistic Beta

    Over the years, statisticians noticed something interesting. Extreme betas—both the really high and the really low ones—tend to drift back toward the market average of 1.0 over time. It’s a classic example of "regression to the mean." Think about it: a high-flying, volatile growth stock might eventually mature into a more stable company, causing its beta to drop. On the flip side, a sleepy utility stock might take on new projects and become a bit riskier, pushing its beta up.

    To account for this tendency, many analysts use the Blume adjustment, a formula developed by Marshall Blume back in 1971.

    Adjusted Beta = (0.67 × Raw Beta) + 0.33

    This formula simply nudges the raw, historical beta closer to 1.0, which often results in a more realistic guess at a stock’s future volatility. For instance, if a stock has a raw beta of 1.50, its adjusted beta would come out to roughly 1.34. This little tweak helps turn beta from a simple historical snapshot into a much more practical tool for investors.

    Putting Beta Into Practice With Real Companies

    Image

    Alright, the theory behind "what is beta in stocks" is one thing, but the concept really clicks when you see how it plays out with companies you actually know. Tying beta values to household names turns these abstract numbers into tangible investment personalities.

    It's the best way to see how a company's entire business model—what they sell and how they make money—directly shapes how volatile their stock is.

    Let's dig into some real-world examples by looking at stocks with high, low, and market-average betas.

    High-Beta Stocks: The Growth Story

    A high-beta stock is any stock with a beta over 1.0, meaning it's more volatile than the market. These are often the exciting, growth-focused companies in sectors like technology or consumer discretionary. Their success is tightly wound to the health of the broader economy.

    When times are good and the economy is humming, people feel comfortable spending more. That's when these companies can see their profits—and their stock prices—absolutely take off.

    The Walt Disney Company (NYSE: DIS) is a classic example. Think about their business: theme parks, cruises, movies. It all depends on people having extra cash to spend. When the market is strong, Disney shines. But when a recession hits, a trip to Disney World is one of the first things a family cuts from the budget, making its stock extra sensitive to big market swings.

    As of mid-2022, Disney's beta was 1.24. This suggests it was expected to be 24% more volatile than the S&P 500. For growth-oriented investors, this is the classic trade-off: higher risk for the potential of higher returns. You can learn more about the relationship between beta and stock volatility on MarketBeat.com.

    Low-Beta Stocks: The Stability Play

    On the complete opposite end of the spectrum, you have low-beta stocks, which have a beta of less than 1.0. These are the market's steady eddies, usually found in "defensive" sectors like utilities and consumer staples. It makes perfect sense when you think about it. People need to pay their electricity bills and buy toothpaste whether the stock market is soaring or crashing.

    This built-in, consistent demand creates a stable revenue stream that insulates these companies from the wider market chaos. A utility company, for example, typically operates in a regulated environment with predictable profits. That stability means its stock price doesn't need to swing wildly to reflect the economy, giving it a lower beta. Investors often use these stocks to anchor their portfolios and add a layer of defense.

    Stocks With a Beta Around 1.0

    When a stock's beta is hovering right around 1.0, it basically moves in lockstep with the market. These are usually massive, mature, and well-diversified companies that are so integral to the economy they almost act as a stand-in for the market itself.

    Microsoft (NASDAQ: MSFT) fits this description perfectly. As a titan in software, cloud computing, and business services, its performance is deeply connected to the health of the global economy. As a result, its stock tends to ride the market's general tide, rising and falling right along with it. It’s no surprise its beta often sits just a hair under 1.0, reflecting this market-like behavior.

    Key Takeaway: Beta isn't just a random number; it's a direct reflection of a company's business model. A high-flying entertainment giant is going to have a completely different risk profile—and beta—than a slow-and-steady utility provider.

    Finally, while they're less common, some assets can have a negative beta. This is a special case where the asset tends to move in the opposite direction of the market. Gold is the classic example here. When the stock market tanks, investors often pile into gold as a "safe haven," pushing its price up.

    Using Beta to Build a Smarter Portfolio

    Once you get a handle on beta, you've unlocked a powerful way to build a portfolio that actually lines up with your financial goals and how much risk you can stomach. It’s the difference between randomly picking stocks and deliberately engineering your portfolio’s volatility. This simple number can help you shift from being a passive investor to an active architect of your financial future.

    It all starts with one simple question: what’s your personal risk tolerance? Your honest answer is the compass that guides every decision from here. Are you shooting for aggressive growth and comfortable with some wild market swings, or is your main goal to protect what you have and keep things stable?

    Aligning Beta with Your Investment Style

    If you’ve got a higher appetite for risk and a long time horizon, high-beta stocks can be the engine that drives your growth. We're talking about stocks with a beta greater than 1.0, which means they tend to exaggerate the market's ups and downs. Sprinkling these into your portfolio can lead to some seriously impressive returns when the market is roaring.

    Think about companies in fast-paced sectors like tech or consumer discretionary. Their fortunes are often tied to the broader economy, which makes them more volatile but also packed with potential. When the market is on a tear, these are the stocks that can give your portfolio a major boost.

    On the flip side, if you're a more conservative investor, low-beta stocks (beta less than 1.0) are your best friends. These are the stabilizers in your lineup, providing a much-needed cushion when the market takes a nosedive.

    By blending assets with different risk profiles, you can aim for a smoother investment journey. A well-constructed portfolio uses both high- and low-beta stocks to balance the potential for growth with the need for stability, much like a professional fund manager would.

    Creating a Balanced Portfolio

    The real magic happens when you start combining different beta values to create a truly diversified portfolio. It’s a common myth that diversification just means owning a bunch of different stocks. Real diversification is about owning assets that zig when others zag, performing differently under all sorts of market conditions.

    Here’s a practical way to think about it:

    • Anchor with Stability: Start with a solid core of low-beta stocks. These are typically your utilities or consumer staples companies—the steady players that provide a reliable foundation.
    • Add Growth Potential: Next, layer in a selection of high-beta stocks to make sure you’re capturing that upside potential when the market rallies.
    • Include Market Movers: Finally, stocks with a beta right around 1.0, like big, established industry leaders, can help your portfolio move in line with the market's general performance.

    This kind of blended approach is what helps smooth out your returns over the long haul. But while beta is a fantastic tool for managing market risk, just remember it doesn't see everything. It won’t tell you about company-specific problems brewing under the surface.

    That’s exactly why it’s so important to pair beta analysis with a good, hard look at a company’s financial health. You can dive deeper into this by checking out our guide on what is fundamental analysis, which will walk you through how to evaluate a business's true, underlying value.

    Don't Fall for the Beta Trap

    So, now you know what beta is and how to use it. That's a huge step forward, and you're already ahead of most investors. But here's where people get into trouble: they stop there. They treat beta like a crystal ball, and that's one of the costliest mistakes you can make.

    Think of beta as an incredibly useful tool, like a high-powered lens for your camera. It gives you a fantastic, sharp view of one specific thing—market risk. But it’s not the whole picture.

    The biggest thing to remember is that beta is fundamentally backward-looking. It’s calculated using historical price data, usually from the past five years. It tells you a great story about how a stock has behaved, but that’s absolutely no guarantee of how it will perform tomorrow.

    Beta Is a One-Trick Pony

    A massive limitation of beta is that it only measures one flavor of risk: systematic risk. This is the big-picture stuff that can rock the entire market—think interest rate hikes, recessions, or major geopolitical events. It’s the tide that lifts or sinks all boats.

    But it completely ignores the other, equally important half of the story.

    Beta tells you zilch about unsystematic risk. This is the danger that's unique to a single company, the internal Gremlins that can torpedo a stock even when the broader market is soaring. We're talking about things like:

    • Lousy Management: A CEO makes a string of terrible decisions that craters the company's value.
    • Product Disasters: A flagship product gets recalled, or a biotech company's promising drug fails its clinical trial.
    • A New Sheriff in Town: A disruptive competitor comes out of nowhere and starts eating their lunch.
    • Legal Headaches: An unexpected lawsuit drops, creating a mountain of financial uncertainty.

    Because beta is blind to these company-specific landmines, relying on it alone leaves a gaping hole in your risk assessment. A stock with a low beta might look as safe as a savings account on the surface, but it could be hiding some serious skeletons in the closet.

    A Stock’s Beta Isn’t Set in Stone

    Here's another critical point: a company's beta isn't a permanent tattoo. It can, and often does, change over time. A business isn't static. It grows, it matures, and its risk profile evolves right along with it.

    A scrappy, high-beta startup that successfully disrupts an industry might eventually become a stable, cash-generating giant. As its business model solidifies and its revenue becomes more predictable, its beta will naturally drift down toward 1.0.

    The beta you see today might not be the beta you get a few years from now. That’s why you can't just "set it and forget it."

    Ultimately, you have to see beta as one piece of a much larger puzzle. It gives you invaluable context about a stock's sensitivity to the market, but it's just a starting point. To build a truly solid investment thesis, you have to pair it with old-fashioned homework on the company's leadership, its competitive moat, and its financial health.

    Of course. Here is the rewritten section, crafted to sound like it was written by an experienced human expert.


    Where to Find Beta and How to Use It

    Alright, so now you know what beta is. But where do you actually find this number?

    Thankfully, you don’t need a fancy terminal or expensive subscription. Finding a stock's beta is pretty straightforward once you know where to look. Most of the big financial sites you already use—like Yahoo Finance, Bloomberg, and Reuters—provide this for free.

    This easy access is what makes beta such a practical tool. You don't have to calculate it yourself; you just need to know how to find it and, more importantly, how to interpret it.

    Locating Beta on Financial Websites

    Let's walk through it. When you pull up a stock quote on one of these sites, you're looking for the summary or statistics section. It's usually listed right there with other key metrics like the P/E ratio and market cap.

    For example, here's a typical stock summary page on Yahoo Finance.

    See it there? The beta value is listed prominently, but there's a crucial detail you can't afford to miss next to it.

    Notice how it often specifies the time frame used for the calculation. The industry standard, and the one you'll see most often, is Beta (5Y Monthly). This means the beta was calculated using 5 years of monthly price data. This is the benchmark you want to use because it ensures you're comparing different stocks on a level playing field.

    A word of caution: Always check the time frame. If you're comparing one stock's 5-year beta to another's 3-year beta, you're not getting an accurate picture. It's like comparing a marathon runner's pace over 26 miles to a sprinter's pace over 100 meters—the context is completely different and can lead you to some seriously flawed conclusions.

    Once you know where to find this number and what to look for, you're ready. You can start confidently using beta to get a quick read on the market risk for any stock you're considering.

    Got Questions About Beta? We've Got Answers.

    Even after you get the hang of beta, a few specific questions always seem to pop up. That’s totally normal. Let's walk through the most common ones I hear to iron out any wrinkles and help you start using this stuff with confidence.

    These aren't textbook definitions. They’re answers based on real-world scenarios that actually matter when you're looking at where to put your money.

    Can a Stock Have a Negative Beta?

    Absolutely, though you won't see it every day. A stock with a negative beta is one that tends to zig when the market zags. If the S&P 500 rallies hard, a negative-beta stock is likely to drop, and vice-versa.

    Historically, some gold mining stocks have fit this bill. When the market gets shaky, investors often pile into gold as a “safe haven,” which can boost the shares of companies that pull it out of the ground. That makes negative-beta assets a fascinating, if rare, tool for potentially hedging your portfolio against a broad market downturn.

    Is a High-Beta Stock a Bad Investment?

    Not in the slightest. A high beta (anything over 1.0) just tells you the stock is more volatile than the overall market. While that definitely means more risk, it also opens the door to potentially higher returns. Think of it as turning up the volume on market movements.

    A high-beta stock can be a powerful engine for growth in a well-balanced portfolio, especially if you have a higher tolerance for risk. The trick is making sure that kind of volatility fits with your personal financial goals and your philosophy on what is long-term investing.

    How Often Should I Check a Stock's Beta?

    Beta isn’t a set-it-and-forget-it number. It’s constantly being recalculated with new price data, so it will change over time. You don't need to obsess over it daily, but checking in on your holdings' betas quarterly or even semi-annually is a solid habit.

    You'll sometimes see significant shifts, especially if a company's business fundamentals change—like a fast-growing tech darling maturing into a slower, more stable industry giant. A quick, regular check-in makes sure your portfolio's risk level hasn't silently drifted away from what you originally intended.


    At Investogy, we don't just track these numbers; we explain the "why" behind every move in our own portfolio. Subscribe to our free newsletter to see how we manage real money and build conviction in the stocks we own.

  • What Is Discounted Cash Flow Explained

    What Is Discounted Cash Flow Explained

    If you've spent any time researching stocks, you've probably run into the acronym DCF. It stands for Discounted Cash Flow, and it's one of the most powerful tools professional investors use to figure out what a company is really worth.

    Forget the jargon for a second. At its core, DCF is just a structured way of thinking about an investment based on the cold, hard cash it's expected to produce down the road.

    So, What Is Discounted Cash Flow, Really?

    Image

    The whole idea behind DCF is built on one simple, timeless truth: a dollar today is worth more than a dollar tomorrow. This isn't just a saying; it's a fundamental principle of finance called the time value of money.

    Why? Because you can invest that dollar today and earn a return on it. A dollar you get next year is a dollar that missed out on twelve months of potential growth.

    Think of it like buying a small rental property. You wouldn't value it based on the rent you collected last month. You'd think about all the future rent checks you expect to receive over the next 10, 20, or 30 years. A DCF analysis applies that exact same logic to a business, making it a cornerstone of modern financial analytics.

    Turning Future Dollars Into Today's Value

    Instead of getting caught up in the daily noise of the stock market, DCF tries to pin down a company's intrinsic value—what it's fundamentally worth based on its ability to generate cash. Getting a solid grip on /blog/what-is-cash-flow-analysis/ is a huge first step to mastering this.

    The process boils down to two main jobs:

    • Looking into the future: You have to project how much free cash flow the company will generate over a set period, usually the next 5 or 10 years. This is the art part of the science.
    • Bringing it back to today: Then, you "discount" those future cash flows back to what they're worth in the present day. This step uses a discount rate to account for risk and the opportunity cost of tying your money up.

    The whole point of a DCF is to look past the market's mood swings and focus on a company's long-term, cash-generating engine. It’s an attempt to find a true, objective value.

    Once you’ve done the math, you add up all those discounted future cash flows. The final number gives you an estimate of what the entire business is worth right now. It's a foundational technique that helps you separate a company's true value from its often-fickle stock price.

    The Three Core Ingredients of a DCF Model

    Every single discounted cash flow model, no matter how intimidating it looks on a spreadsheet, boils down to just three core ingredients. Think of it like a recipe for finding a stock's true worth. If you get a handle on each component and see how they fit together, you can start valuing a business with real confidence.

    These three pieces are the engine of the whole analysis. Getting them right is what separates a genuinely useful estimate from a number that will lead you astray.

    This image lays out how these building blocks stack up to give you a final valuation.

    Image

    As you can see, it's a logical flow: you forecast the cash, figure out what that cash is worth today, and then account for the company's long-term future. Let's break down each step.

    1. Forecasting Free Cash Flow

    The first, and arguably most important, ingredient is Free Cash Flow (FCF). Now, this isn't the same as revenue or profit. FCF is the actual, spendable cash a company has left over after paying for everything it needs to run and grow its business—think operating expenses and investments in new buildings or equipment.

    It's the pile of cash that could, in theory, be handed back to all its investors.

    To kick off a DCF, you have to project this FCF out over a specific timeframe, usually five to ten years. This means rolling up your sleeves, digging into the company's financial statements, and making some educated guesses about future growth, profitability, and how much they'll need to reinvest. Getting a feel for how to improve cash flow can give you a much better sense of whether your projections are realistic.

    This forecasting part is where the "art" of valuation really comes into play. A solid analysis is built on reasonable, well-researched assumptions—a core skill you develop in fundamental analysis.

    2. Determining the Discount Rate

    Okay, so you've got a stream of projected cash flows for the next decade. The problem is, a dollar ten years from now isn't worth a dollar today. That's where the discount rate comes in. It’s a percentage that helps us translate all that future cash into today's value, accounting for both risk and the time value of money.

    Think of it as an interest rate, but in reverse. A higher discount rate means future cash is seen as riskier, or that you have better, safer places to put your money right now.

    A higher discount rate leads to a lower present value. This is a built-in safety mechanism; it makes sure that riskier companies with less predictable cash flows get a more conservative, lower valuation.

    There are a few ways to land on a discount rate, but a very common method is using the Weighted Average Cost of Capital (WACC). This calculation essentially blends the cost of a company's debt with the return that its equity investors demand for taking on the risk of ownership.

    3. Calculating the Terminal Value

    Forecasting cash flows year by year is great, but you can't do it forever. At some point, usually after that five- or ten-year window, the detailed predictions stop. But of course, a healthy company doesn't just shut its doors in year 11.

    To capture the value of all the cash flows the business will generate beyond your forecast period, you calculate a Terminal Value. This is a single, massive number representing the company's worth from that point into perpetuity. Don't underestimate its importance—it often makes up a huge slice of the final valuation, sometimes 70% or even more.

    Analysts typically use one of two methods here:

    • Perpetuity Growth Model: This assumes the company’s cash flows will grow at a slow and steady rate forever. This rate is usually something conservative, like the long-term rate of economic growth or inflation.
    • Exit Multiple Model: This approach assumes the company gets sold at the end of the forecast period. Its value is estimated using a multiple of its earnings or revenue, based on what similar companies in the industry are trading for.

    To pull all this together, let's look at the essential data points you'll need for your DCF model.

    Key Inputs for DCF Analysis and Their Purpose

    Component What It Represents Common Data Sources
    Free Cash Flow (FCF) The actual cash a company generates after all expenses and investments. Company 10-K/10-Q reports, investor presentations, analyst estimates.
    Growth Rate The assumed annual growth of the company's FCF during the forecast period. Historical growth, management guidance, industry reports, analyst consensus.
    Discount Rate (WACC) The rate used to calculate the present value of future cash flows, reflecting risk. Calculated using market data for interest rates, beta, and company's capital structure.
    Terminal Growth Rate The constant, long-term growth rate of FCF assumed beyond the forecast period. Often tied to long-term inflation or GDP growth rates (e.g., 2-3%).
    Exit Multiple A valuation multiple (e.g., EV/EBITDA) used to calculate terminal value. Based on comparable public companies or recent M&A transaction data.

    As you can see, each piece of the puzzle requires you to look at real-world data and make some thoughtful assumptions about the future. Once you have these three core ingredients—the cash flow forecast, the discount rate, and the terminal value—you're ready to put them together and calculate the intrinsic value of the business.

    Calculating DCF With a Step-by-Step Example

    Image

    Theory is one thing, but the best way to really get a feel for a discounted cash flow analysis is to roll up your sleeves and build one. Let's walk through a simplified example with a business we can all picture: "Steady Grounds," our make-believe local coffee shop.

    This hands-on approach will show you exactly how we translate future potential into a concrete value today. We'll use a straightforward, five-step process to figure out what Steady Grounds is actually worth.

    Step 1: Project Future Free Cash Flows

    First things first, we need to guess how much free cash flow (FCF) Steady Grounds will generate over the next five years. This isn't just a random guess. After looking at its past performance, considering the local market, and maybe a new condo building going up nearby, we come up with some educated projections:

    • Year 1: $50,000
    • Year 2: $55,000
    • Year 3: $60,000
    • Year 4: $64,000
    • Year 5: $68,000

    This is the cash we believe the business will have left over after paying all its bills and putting money back into the business for things like new espresso machines. This is the raw material for our entire valuation.

    Step 2: Determine a Discount Rate

    Next up, we need a discount rate. Think of this as a "risk penalty" we apply to future earnings. For a small, established business like a coffee shop, a discount rate of 12% is a pretty reasonable assumption.

    Why 12%? It reflects the risks inherent in a small business—local competition, rising coffee bean prices, you name it. It's the kind of return an investor would demand for putting their money into this venture instead of something safer. A shakier, high-risk startup would need a much higher discount rate.

    This whole idea of discounting future money is central to finance. For example, understanding how to calculate mortgage payments uses the same core logic to figure out the present value of all those future house payments.

    Step 3: Discount Each Year's Cash Flow

    Now for the fun part: the math. We're going to take our 12% discount rate and apply it to each year's projected cash flow. The formula to get the Present Value (PV) of each chunk of cash is:

    PV = FCF / (1 + r)^n
    Where:

    • FCF is the Free Cash Flow for that year.
    • r is our discount rate (0.12).
    • n is the year number (1, 2, 3, etc.).

    Let's plug in the numbers for Steady Grounds:

    • Year 1: $50,000 / (1.12)^1 = $44,643
    • Year 2: $55,000 / (1.12)^2 = $43,848
    • Year 3: $60,000 / (1.12)^3 = $42,707
    • Year 4: $64,000 / (1.12)^4 = $40,672
    • Year 5: $68,000 / (1.12)^5 = $38,586

    Add all those up, and the total present value of the first five years of cash flow is $210,456.

    Step 4: Calculate the Terminal Value

    But wait, Steady Grounds isn't going to shut down after five years, right? We need to account for all the cash it's going to generate forever after our forecast period. This is called the Terminal Value.

    We'll use a common formula for this, assuming the coffee shop will grow at a slow and steady 2.5% for the long haul.

    The formula is: (FCF Year 5 * (1 + g)) / (r – g)

    • ($68,000 * 1.025) / (0.12 – 0.025) = $69,700 / 0.095 = $733,684

    That $733,684 represents the value of the business at the end of Year 5. But we need to know what that's worth today. So, we discount it back just like the others:

    • $733,684 / (1.12)^5 = $416,334

    Step 5: Find the Total Intrinsic Value

    We're at the home stretch. Now we just put the two pieces together.

    1. Sum of Discounted FCF (Years 1-5): $210,456
    2. Present Value of Terminal Value: $416,334

    Total Intrinsic Value of Steady Grounds = $210,456 + $416,334 = $626,790

    So, based on our projections and assumptions, our little coffee shop has an intrinsic value of about $627,000. This gives us a solid, fundamentals-based number to work with. If the owner wants to sell for $1 million, we know it's overpriced. If they're asking $500,000, we might have a great deal on our hands. That’s the real power of DCF.

    Getting Your Hands Dirty: Applying DCF to a Real Company

    Alright, we’ve had our fun with the hypothetical coffee shop. Now it’s time to step into the big leagues. Applying DCF to a real public company—think Microsoft or Coca-Cola—is a whole different ballgame, but the core playbook is exactly the same. The main difference? The sheer amount of data you have to wade through.

    Instead of relying on local market knowledge and some back-of-the-napkin math, you'll be diving headfirst into official financial filings. Specifically, you're going to get very familiar with 10-K and 10-Q reports. These are the documents public companies are required to file with the U.S. Securities and Exchange Commission, and they're the bedrock of any serious analysis. This is where you find the hard numbers—revenue, operating margins, capital expenditures, and debt—that you'll need to start projecting future cash flow.

    Sourcing Your Data from Public Filings

    Your first challenge is playing detective. You need to translate dense, jargon-filled financial statements into the clean inputs your model needs. It feels a bit like piecing together clues to build a complete picture of a company's financial health and, more importantly, its future potential.

    Here's where you'll be digging in those reports:

    • The Income Statement: This is ground zero for revenue, operating income, and net income. These figures are the starting point for forecasting what the company will earn.
    • The Cash Flow Statement: This is the most critical piece of the puzzle. It strips away accounting fluff and shows you the actual cash the company generated and spent, including the all-important capital expenditures (CapEx), a key ingredient for FCF.
    • The Balance Sheet: This statement gives you a snapshot of the company’s debt and equity, which you'll need to figure out your discount rate.

    But remember, this isn’t just a numbers game. It's about understanding the story behind the numbers. Why are profit margins shrinking? Is the company pouring cash into new factories? Answering these questions is what separates a mechanical exercise from true, insightful investment analysis.

    The Art of Making Defensible Assumptions

    Once you’ve gathered the historical data, the real work begins. Valuing a public company forces you to confront the single biggest challenge in any DCF analysis: making reasonable, defensible assumptions about the future.

    This is where so many investors trip up. It's easy to get excited about a company and plug in overly optimistic growth rates, which naturally leads to a wildly inflated valuation. A professional analyst, on the other hand, will spend hours—sometimes days—justifying every single assumption. For a publicly traded company, it's common practice to project cash flows for a full ten years before calculating a terminal value. You can discover more insights about building a professional DCF model and see why the weighted average cost of capital (WACC) is almost always used as the discount rate.

    A DCF model is only as good as its inputs. The goal isn't to be perfectly right—which is impossible—but to be thoughtfully conservative and understand how sensitive your valuation is to your assumptions.

    This process is all about asking the tough questions:

    • Can this company realistically keep growing at its historical rate for another decade?
    • What industry headwinds or tailwinds could derail (or boost) future profits?
    • How much will the company need to reinvest back into the business just to sustain its growth?

    From Valuation to an Investment Decision

    The final step is where the rubber meets the road. You connect all your detailed analysis to a clear, actionable investment decision. After projecting and discounting all those future cash flows, you'll arrive at the company’s total intrinsic value. From there, you just divide that massive number by the total number of shares outstanding to get an intrinsic value per share.

    This is your moment of truth. You finally have a number you can compare to the current stock price you see on the screen.

    • If your intrinsic value is significantly higher than the market price, you may have found an undervalued stock.
    • If your intrinsic value is significantly lower, the stock might be overvalued.
    • If the numbers are pretty close, the stock is likely fairly priced.

    This final comparison is the entire point of doing a DCF. It gives you a logical, fundamentals-based reason to buy, sell, or avoid a stock. It’s what transforms you from a passive speculator into an informed investor.

    The Strengths and Weaknesses of DCF Valuation

    No valuation tool is a crystal ball, and a discounted cash flow analysis is certainly no exception. While it's a cornerstone of serious investing, its power comes with some significant limitations. Knowing both sides of the coin is key to understanding when to trust a DCF model and when to take it with a huge grain of salt.

    The biggest plus for DCF is its laser focus on intrinsic value. It forces you to completely ignore the market's daily mood swings and concentrate on what really matters: the underlying cash-generating ability of the business itself. This disciplined approach anchors your investment thesis in fundamentals, not fleeting sentiment.

    It's also incredibly flexible. You can model out all sorts of scenarios—a best-case, worst-case, and a more realistic middle ground—to see the full range of potential valuations. This gives you a much better feel for how sensitive your investment is to different assumptions about growth or profitability down the road.

    The Garbage In, Garbage Out Problem

    For all its strengths, DCF has a famous and critical weakness, often summed up as "Garbage In, Garbage Out." The reality is, a DCF model is only as good as the assumptions you feed it. Even tiny tweaks to your growth rate or discount rate can dramatically swing the final valuation.

    This extreme sensitivity is the method's Achilles' heel. An analyst who's a little too bullish on a company's future can easily cook up a DCF that justifies a high stock price, creating a dangerous illusion of precision.

    A DCF model gives you an answer that looks precise, but is actually very uncertain. Its value isn't in the final number, but in forcing you to think critically about the key drivers that will determine a company's future.

    Let's be honest, accurately forecasting the future is tough. For a stable, predictable company like a utility, projections might be fairly reliable. But for a high-growth tech startup or a business in a volatile industry, trying to forecast cash flows ten years out is more art than science.

    Strengths vs. Weaknesses of DCF Analysis

    So, where does that leave us? While DCF is a powerful framework for thinking about a business, it should never be the only tool you use. It works best when you combine it with other stock valuation methods to get a more complete picture. Think of it as one expert opinion in a room full of advisors.

    Here’s a side-by-side look at the key trade-offs to keep in mind.

    Advantages of DCF Disadvantages of DCF
    Focuses on Fundamentals: Based on a company's actual ability to generate cash, making it independent of market hype. Highly Sensitive to Assumptions: Small changes in inputs (growth rate, discount rate) can lead to vastly different valuations.
    Provides an Intrinsic Value: Aims to calculate what a business is truly worth, not just its current market price. "Garbage In, Garbage Out": The model's accuracy is entirely dependent on the quality and realism of your forecasts.
    Forces Disciplined Analysis: Requires a deep dive into a company's economics, strategy, and competitive landscape. Difficult for Unpredictable Companies: Less reliable for startups, cyclical businesses, or high-growth tech firms with uncertain futures.
    Flexible for Scenario Planning: Easily allows you to model different outcomes (best, worst, base case) to understand risk. Terminal Value Dominance: A highly speculative estimate, the terminal value can account for over 70% of the total value.

    At the end of the day, a DCF valuation is a powerful exercise in critical thinking. It forces you to justify every single assumption you make about a company's future. This process alone provides a robust, logical foundation for your investment decisions—as long as you never forget its inherent limitations.

    How a 19th-Century Idea Shapes Modern Finance

    You might think Discounted Cash Flow is some complex model dreamed up on a modern Wall Street trading floor, but its roots go way deeper than that. The basic idea—valuing something based on the money it’ll spit out in the future—is a classic principle born from pure necessity.

    Long before anyone had a spreadsheet, people were using this logic to solve very real valuation problems. The concept first popped up in the UK coal industry way back in 1801. Miners needed a way to figure out if a new mine was worth the effort, so they started projecting its future output and discounting it back. You can dig into the specifics by checking out the history of discounted cash flow analysis.

    From Crisis to Core Principle

    But DCF really came into its own after the stock market crash of 1929. With the financial world in ruins, investors were desperate for a disciplined, objective way to value companies. They needed something more solid than just speculation and market hype. The crash forced a huge shift toward rigorous, fundamentals-based thinking.

    Discounted cash flow emerged from this need for a logical anchor. It provided a framework for separating a company's durable, cash-generating power from its volatile stock price.

    Knowing this history shows you that DCF is much more than a formula. It's a powerful idea born from the simple need to bring some sanity and logic to investing—a principle that’s just as critical today as it was back then.

    Common Questions About DCF Analysis

    Once you start using the discounted cash flow model, a few practical questions almost always bubble up. Getting these sorted out will help you use the tool a lot more effectively and sidestep some of the most common traps. Let's get right to it.

    Is DCF a Reliable Way to Value Any Company?

    DCF analysis absolutely shines when you’re looking at stable, predictable companies. Think of businesses with a long, consistent history of churning out cash, like a big utility company or a household consumer brand. But its reliability takes a nosedive when the future is anyone's guess.

    It’s far less useful for:

    • Startups that have no real history of revenue or cash flow.
    • High-growth tech companies where future success is purely speculative.
    • Cyclical businesses (like mining or construction) whose cash flows swing wildly with the economic cycle.

    For these kinds of companies, trying to forecast cash flow is more like gazing into a crystal ball than performing a real analysis. That makes the final DCF number pretty shaky.

    What Is the Biggest Mistake in a DCF Analysis?

    The single biggest mistake you can make is plugging in overly optimistic assumptions, especially for the long-term growth rate. A DCF model is incredibly sensitive to its inputs, and even a slightly rosy projection can blow up the final valuation, giving you a false sense of security.

    The most common error isn’t a math mistake; it’s a judgment mistake. Always ground your assumptions in conservative, well-researched data, and run a sensitivity analysis to see how different inputs change the final number.

    Can I Use DCF If a Company Does Not Pay Dividends?

    Absolutely. In fact, this is one of the model's key strengths. DCF doesn't care about dividends; it focuses on Free Cash Flow—the actual cash the business generates—not the slice of it that management decides to hand out to shareholders.

    This makes it the perfect tool for valuing companies that reinvest every penny they earn back into the business to chase future growth.


    Ready to build your investing conviction with real-world examples? The Investogy newsletter offers a free 3-minute weekly read, showing you exactly how we manage and analyze stocks in our transparent, real-money portfolio. Subscribe for free at https://investogy.com.

  • What Is Market Capitalization Explained for Investors

    What Is Market Capitalization Explained for Investors

    When you hear investors throw around the term market capitalization, they're really just talking about one thing: the total market value of a company's stock. Think of it like this—if you wanted to buy every single share of a company and take it private, the market cap is roughly what it would cost you. It's the market's current "price tag" for the whole business.

    Unpacking the Concept of Market Capitalization

    Image

    The name might sound a little technical, but the idea behind "market cap" is actually pretty simple. It gives you a quick snapshot of a company's size from the perspective of the entire investment world. For me, and for most investors, it’s one of the first things we look at. It helps you instantly categorize a company and get a feel for its potential risks and opportunities for growth.

    Instead of getting bogged down in revenue, total assets, or the number of employees, market cap cuts straight to what the stock market thinks a company is worth. It’s a living, breathing number that’s constantly changing as the stock price ticks up and down throughout the day. This real-time valuation is a powerful reflection of everything from investor confidence and company performance to the mood of the broader economy.

    The Simple Formula Behind the Big Number

    Calculating a company's market cap is surprisingly easy. You only need two pieces of information, both of which are publicly available for any company on the stock market.

    Here’s the formula:
    Market Capitalization = Current Share Price × Total Number of Outstanding Shares

    Let's quickly break down those two parts:

    • Current Share Price: This one’s easy. It’s just the price of a single share on the open market right now.
    • Total Number of Outstanding Shares: This is the total number of shares a company has issued that are held by all investors, from big institutions to everyday people like you and me.

    Let’s run a quick example. Say Company XYZ has a stock price of $50 per share and there are 10 million shares out there. Its market cap would be $500 million ($50 x 10,000,000). It’s that simple.

    With this one number, you have a solid starting point for comparing the relative size of different companies. You can immediately see that a $100 billion company is ten times larger than a $10 billion one, no matter what their individual stock prices are. Getting a handle on this is really the first step toward building a smarter investment strategy.

    Understanding the Different Tiers of Market Cap

    Once you've got a handle on the basic formula, you can start using market capitalization to size up companies. Think of it like boxing's weight classes; investors group businesses into different tiers based on their total market value. This simple classification is a great starting point for setting expectations about risk, stability, and growth potential.

    These tiers aren't just arbitrary labels. They usually correspond to different stages in a company's life cycle. A company's size directly impacts how it behaves as an investment—from its daily stock price swings to its long-term prospects for expansion.

    The image below breaks down the simple but powerful calculation that determines a company's size.

    Image

    This math is the first step every investor takes. It helps place a company into one of the main tiers, which in turn frames the entire investment analysis.

    To make this crystal clear, here’s a quick overview of the main market cap tiers you'll encounter.

    Market Cap Tiers at a Glance

    Category Typical Market Cap Range Key Characteristics
    Large-Cap $10 billion or more Well-established, stable, often pay dividends. Lower risk, slower growth.
    Mid-Cap $2 billion to $10 billion Balanced growth and stability. Have proven business models but still have room to expand.
    Small-Cap $300 million to $2 billion High growth potential. Younger, more innovative, but also more volatile and risky.

    These ranges aren't set in stone, but they provide a solid framework for understanding what you're looking at. Let's dive a little deeper into each one.

    Large-Cap Companies: The Market Heavyweights

    Large-cap stocks are the giants of the market, typically valued at $10 billion or more. These are the blue-chip, household names you already know—think Apple, Microsoft, and Johnson & Johnson. They've earned their dominant positions in their respective industries.

    Because of their sheer size and consistent revenue, large-caps are generally seen as less risky investments. Sure, their growth might be slower, but they often bring stability to a portfolio and frequently pay out dividends. That's why they're a cornerstone for so many long-term investors.

    Mid-Cap Stocks: The Growth and Stability Sweet Spot

    Next up are the mid-cap companies, which sit comfortably between the titans and the upstarts. Their market caps usually fall somewhere between $2 billion and $10 billion. These are businesses that have successfully navigated their early growth spurts but still have plenty of runway left to expand.

    Mid-caps offer a compelling mix of what makes the other two groups appealing. They tend to have more growth potential than the large-caps but more stability than their smaller peers. This balance makes them a go-to for investors who want a middle ground between aggressive growth and proven security. This kind of analysis is a core part of building an investment thesis; you can learn more about this by exploring our guide on what is fundamental analysis.

    For many investors, mid-caps really do represent the best of both worlds. They're established enough to have proven themselves but are still nimble enough to chase growth opportunities that the bigger players might overlook.

    Small-Cap Stocks: High Risk and High Potential

    Finally, we have the small-cap companies. These are the agile, scrappy players in the market, generally valued between $300 million and $2 billion. They're often younger companies operating in innovative or niche markets where the potential for explosive growth is very real.

    But all that potential comes with a healthy dose of risk. Small-caps can be incredibly volatile and are much more vulnerable to things like economic downturns or a big competitor moving in on their turf. Investing here requires a higher tolerance for risk, but the payoff can be massive if you pick a company that grows into the next mid-cap or large-cap success story.

    Seeing the Bigger Picture with Global Market Cap

    Image

    It’s one thing to know a single company’s market cap, but seeing how it fits into the global economic puzzle gives you a whole new level of perspective. A company's size is always relative. A large-cap giant in one country might look surprisingly modest next to the titans of a much larger economy.

    When you zoom out and look at the world stage, you start to see where the real financial power is concentrated. This is a big deal because modern markets are all interconnected. An economic shift, a new policy, or a tech breakthrough in one region can send ripples across the entire globe. Understanding this helps you appreciate the true scale of the multinational corporations that operate across these different economic zones.

    Where the World’s Value Is Concentrated

    The distribution of market value isn't even close to being even. As of early 2025, the total global stock market capitalization is a mind-boggling $124 trillion. But this incredible wealth is heavily clustered in just a few key economic powerhouses.

    The United States is the undisputed leader, with its markets accounting for roughly $60 trillion, or a massive 48.6% of the world’s total. China is a distant second at $15.58 trillion (12.6%), with the European Union right on its heels at $14.99 trillion (12.1%).

    When you add it all up, these three dominant regions represent over 73% of the entire global market capitalization. That incredible concentration shows you just how much influence they have on worldwide financial trends.

    Other major players include Japan ($6.2 trillion), a rapidly growing India ($5.18 trillion), and the combined markets of Africa and the Middle East ($5.09 trillion). This data really hammers home the sheer scale of the U.S. market and explains why what happens there has such a profound impact everywhere else. If you want to dig deeper, you can see a full regional breakdown of the $124 trillion global stock market on Visual Capitalist.

    Why This Global View Matters to You

    So, what does this big-picture view mean for you, the individual investor? It’s simple: knowing where a company is listed and how its home market stacks up globally provides crucial context about its growth potential and the risks it carries.

    Think about it. A company based in a smaller, emerging market might have more room for explosive growth, but it could also be more vulnerable to regional instability. On the other hand, a large-cap company in the U.S. benefits from the deep liquidity and relative stability of the world's largest market. This global awareness is a key ingredient for making smarter, more well-rounded investment decisions.

    How Market Cap Tells a Company's Story

    Market cap isn't just a static number on a screen; it's a dynamic, living story of a company's journey. It reflects the company's triumphs, its struggles, and the market's ever-shifting feelings about its future. When you track a company's market cap over time, you're watching this story play out in real-time.

    A killer product launch can send its valuation skyrocketing. A dismal earnings report or a scrappy new competitor? You'll probably see the market cap fall. These swings are direct feedback from the collective voice of investors, showing exactly how they react to news, performance, and the economic winds.

    Learning to read this story—how a company's market cap reflects its growth stage and market perception—is a critical skill when you start to evaluate investment opportunities.

    Market Cap in Motion: A Real-World Example

    Let's look at a real company to see how this works. GlobalData (DATA.L), a UK-listed firm, gives us a great example of a market cap story filled with growth and contraction. As of early 2025, its market cap hovered around $1.35 billion.

    But its history is where the real story is. The company went through a massive growth spurt, with its market cap exploding by over 700% back in 2009 alone. More recently, between 2023 and 2025, it took a hit, dropping about 36% from $2.11 billion to its current $1.35 billion. You can dig into more of this historical data over on CompaniesMarketCap.com.

    This rise and fall isn't just abstract data. It's the numerical footprint of real-world events: periods of aggressive expansion and smart strategies, followed by market corrections, tough economic conditions, or a simple shift in investor confidence.

    This example is what turns market cap from a simple formula into a powerful analytical tool. The number itself is just one piece of the puzzle. The real gold is understanding why it's changing.

    When you see a company’s market cap move, it should trigger a few key questions:

    • Did they just report profits that blew past expectations?
    • Is there a new headwind hitting their entire industry?
    • Has something fundamentally changed about their long-term growth prospects?

    Answering these questions usually means digging into other key metrics. If you want to get a better handle on how profits drive these valuation changes, our guide on what is earnings per share is a great next step. By connecting the dots between market cap movements and the company's actual performance, you start learning to read the market’s story.

    Common Mistakes Investors Make with Market Cap

    Market cap is a foundational metric, no doubt about it. But relying on it alone is like trying to drive a car with only a speedometer—you know how fast you're going, but you have no idea if you're about to run out of gas or drive off a cliff.

    Understanding its limitations is what separates savvy investors from the crowd. If you can sidestep a few common traps, your investment analysis will be miles ahead of the game.

    One of the most frequent blunders is confusing a high stock price with a large company. A stock trading at $500 per share feels more significant than one at $50, right? But that price tag tells you absolutely nothing about the company's actual size. Always, always use market cap for a true size-to-size comparison.

    Mistaking Market Cap for True Value

    Another critical error is treating market cap like it's the company's final price tag. It's not. Market cap only shows you the value of a company’s equity. It completely ignores two massive pieces of the financial puzzle: debt and cash.

    Think about it this way: a company could have a $10 billion market cap but be drowning in $8 billion of debt. Suddenly, that $10 billion valuation looks a lot shakier, doesn't it? On the flip side, a company with a huge cash pile is far more resilient.

    This is exactly why seasoned investors often turn to enterprise value (market cap + debt – cash) to get a more complete picture of what a company is really worth.

    Using It as a Standalone Metric

    Ultimately, the biggest mistake is using market cap as your one and only data point. It’s a great starting point—it tells you about size and what the market thinks—but it says zero about profitability, revenue growth, or how well the business is actually run. Good analysis demands context.

    To really get under the hood of a business, you have to pair market cap with other fundamental metrics, such as:

    • Price-to-Earnings (P/E) Ratio: This helps you figure out if a stock is cheap or expensive compared to its actual earnings.
    • Revenue and Earnings Growth: Are sales and profits actually going up? This tells you if the business is expanding or stagnating.
    • Cash Flow: This is the lifeblood of a company. It shows if they have the cash to pay bills, invest, and grow.

    Using these metrics together helps you see the whole story. It lets you decide if you're looking at growth vs. value stocks and whether the market's current price tag is actually justified by the company's performance.

    Answering Your Market Cap Questions

    Alright, let's run through a few common questions that pop up when people start digging into market cap. Getting these concepts down is crucial, so think of this as a quick way to lock in what we've already covered.

    Is a High Share Price Better Than a Low One?

    Not at all. In fact, getting hung up on the share price is a classic rookie mistake that can lead you down the wrong path.

    Imagine a company with 10 million shares out there, each trading for $100. Its market cap is a cool $1 billion. Now, picture another business with 500 million shares, but each one only costs $3. That company's market cap is $1.5 billion. Even with a tiny share price, it's the bigger, more valuable company. Market cap is what tells you the company's true scale, not the stock price.

    How Does Market Cap Affect Index Funds?

    This is a big one. Most of the major indexes you hear about, like the S&P 500, are market-cap-weighted. What this means is that the companies with the biggest market caps pull the most weight and have the largest impact on the index's performance.

    When you buy into an S&P 500 index fund, your money is automatically more concentrated in giants like Apple and Microsoft than in the smaller players at the bottom of the list. If those behemoths have a great day, they can pull the whole index up with them. The opposite is also true.

    This weighting system is a crucial concept. It means that the performance of just a handful of mega-cap stocks can often dictate the direction of the entire market index, highlighting their immense influence.

    Can a Company's Market Cap Fall Below Its Cash Balance?

    Yes, it can happen, though it’s pretty rare and usually a five-alarm fire for the company. When a market cap dips below its net cash (meaning cash on hand minus all its debt), it's a sign that investors have an extremely bleak view of the business's future.

    The market is essentially saying the company's actual operations—its products, its strategy, its people—are worth less than zero. For some hardcore value investors, this might flash as a potential bargain, but it’s a situation that demands a ton of research to figure out why everyone else is running for the exits.


    At Investogy, we cut through the noise by focusing on in-depth analysis of a single, real-money portfolio. Subscribe to our free weekly newsletter to see the research behind every move we make. https://investogy.com

  • What is Market Volatility? Key Insights & Strategies

    What is Market Volatility? Key Insights & Strategies

    Talk to any seasoned investor, and they'll tell you the market has a personality. Some days it's calm and predictable; other days, it's a wild, bucking bronco. That erratic behavior is what we call market volatility.

    Think of it as the market's heartbeat. When things are quiet, you get a slow, steady pulse. But when uncertainty hits, that pulse becomes rapid and erratic. It’s the single best measure of the fear and greed swirling through the financial world at any given moment.

    Your Guide to Navigating Market Volatility

    Image

    If you've ever turned on the financial news, you know exactly what I'm talking about. One day, stocks are hitting all-time highs, and the next, they seem to be in a nosedive. Those dramatic swings are volatility in action.

    But here’s the thing: volatility isn't necessarily the enemy. It's easy to get spooked, but those big price swings are also where the biggest opportunities hide. An asset that’s moving all over the place has the potential for massive gains, just as it carries the risk of serious losses. The trick is to understand what's causing the commotion and how to handle it in your own portfolio.

    Market Volatility Key Concepts at a Glance

    Before we dive deep, this table gives you a quick snapshot of the core ideas we'll be breaking down. It’s a handy reference to keep the main points straight as we go.

    Concept Simple Explanation Why It Matters to You
    Market Volatility The speed and size of price changes in the market. High volatility means bigger potential gains and losses; it's a measure of risk.
    VIX (Fear Index) A real-time tracker of expected volatility in the S&P 500. It's the market's "fear gauge" – when it's high, investors are nervous.
    Beta How much an individual stock moves compared to the overall market. A stock with a Beta over 1 is more volatile than the market; under 1 is less volatile.
    Standard Deviation A statistical measure of how spread out an asset's returns are. Helps you understand an investment's historical price swings and potential risk.

    Think of this as our map. Now, let’s get into the details of what makes the market tick—and sometimes, what makes it go haywire.

    The Role of Volatility in Investing

    At its core, volatility is just the most visible part of investment risk. Every single investment you make, whether it’s stocks, bonds, or real estate, has some degree of uncertainty baked in. Volatility is just that uncertainty playing out in real-time through price changes.

    Getting a handle on the different types of investment risk gives you the complete picture of all the forces that can push your portfolio around.

    Think of this guide as your compass for navigating those choppy waters. We’re going to break down what causes these market storms, how the pros measure them, and most importantly, the practical steps you can take to steer your investments through it all.

    Grasping this concept is the first step toward becoming a more confident investor. Volatility is a feature of the market, not a bug, and learning to navigate it is essential for long-term success.

    My goal here is to give you the knowledge to make smart decisions, whether the market is sailing on smooth seas or weathering a hurricane. By the end, you'll have a toolkit to not only protect your portfolio but also find opportunities to grow it, no matter the forecast.

    What Causes the Market to Swing

    Image

    Market volatility doesn't just happen. It's born from uncertainty, and it's fueled by real-world events that dramatically shift what investors think the future holds.

    Imagine the market as a giant, collective brain trying to put a price tag on every asset based on all the information it has. When that information changes in the blink of an eye, so do the prices. That's a market swing in action.

    The most common triggers are usually big economic data releases. Reports on inflation, employment numbers, or consumer spending can send shockwaves through the markets, especially if they catch analysts by surprise.

    For instance, if inflation numbers come in hotter than anyone expected, investors might immediately start worrying that the Federal Reserve will raise interest rates. Higher rates can slow down the economy and squeeze corporate profits, forcing a rapid, widespread re-evaluation of what stocks are actually worth.

    The Impact of Broader World Events

    It’s not just about domestic economic reports. Global events play a massive role in sparking market volatility.

    Things like geopolitical tensions—think trade wars between major countries or sudden military conflicts—create a thick fog of uncertainty. And if there's one thing investors truly dislike, it's uncertainty. It makes forecasting future earnings and economic growth incredibly difficult.

    Central bank policies are another huge driver. When a central bank like the Federal Reserve announces it’s changing interest rates, it directly affects borrowing costs for businesses and regular people. A rate hike can make investors nervous about a potential recession, while a surprise rate cut might signal confidence and send markets soaring.

    The market is a forward-looking machine. Volatility arises when the picture of the future suddenly becomes blurry, forcing millions of investors to adjust their strategies all at once.

    Of course, this mass adjustment isn't always perfectly rational. In fact, a huge piece of the puzzle is simple human emotion. Collective investor psychology can amplify volatility like nothing else.

    Waves of fear can trigger panic-selling that sends prices spiraling far below their fundamental value. On the flip side, widespread greed can inflate massive asset bubbles. This emotional element is why market swings can sometimes feel totally illogical.

    Connecting News to Market Moves

    At the end of the day, almost any major headline has the potential to move the needle. It could be a breakthrough in artificial intelligence that sends tech stocks flying, or a natural disaster that cripples global supply chains.

    The market is constantly being bombarded with new information, and learning how to connect the dots is a critical skill for any investor.

    When you start to understand these drivers, you stop seeing volatility as just random noise. You see it for what it is: the market reacting, in real-time, to an ever-changing world. Building this foundation is one of the first steps in learning how to analyze stocks for beginners and making smarter decisions.

    By recognizing what triggers these swings, you can better prepare your portfolio to handle the turbulence and even learn to spot opportunities that others might miss. It turns volatility from something to fear into a puzzle you can learn to solve.

    How We Measure Market Turbulence

    So, how do we actually put a number on market volatility? Investors don’t just fly blind; they have specific tools to take the market's temperature, helping them figure out if the waters are calm or if a storm is brewing. It really boils down to two approaches: looking at the past and trying to predict the future.

    The first method is called historical volatility, which is a bit like driving while looking in the rearview mirror. It simply measures how much an asset's price has bounced around in the past. The go-to tool for this is standard deviation. If that sounds like something from a high school math class, don't worry—it’s just a way to see how spread out an asset's returns have been from its average. A high standard deviation means the price has taken some wild swings, signaling higher volatility.

    Reading the Market's Crystal Ball

    The second, and often more talked-about, method is implied volatility. This one is more like a weather forecast. It’s a forward-looking guess at how much turbulence the market expects in the near future. Instead of digging through old price data, it looks at the current prices of options contracts to get a feel for investor sentiment. When traders think big moves are coming, they'll pay more for options, which in turn pushes implied volatility higher.

    This image breaks down the key metrics we use to get a handle on these different sides of market risk.

    Image

    As you can see, standard deviation, the VIX, and Beta each offer a unique lens for viewing and measuring the market's mood.

    Meet the VIX: The Fear Gauge

    You’ve probably heard of the CBOE Volatility Index, better known as the VIX. It’s the most famous measure of implied volatility and for good reason—it’s often called the "fear gauge." The VIX reflects the market's expectation of volatility for the S&P 500 over the next 30 days.

    Since it was created in 1993, the VIX has become an indispensable barometer for how investors are feeling. For instance, during the 2008 financial crisis, it shot up past 80, a massive jump from the sub-20 levels you see in calmer times.

    A high VIX reading (typically over 30) signals a whole lot of fear and uncertainty. It means investors are strapping in for some major price swings. On the flip side, a low VIX (below 20) usually points to confidence and maybe even a little complacency in the market.

    Understanding these numbers isn't just for Wall Street pros. For everyday investors, knowing if volatility is high or low gives you critical context for your own decisions. It helps you decide if it’s a time to be cautious or if widespread fear might be creating some interesting opportunities.

    This kind of knowledge is a cornerstone as you learn to master stock valuation methods and build a portfolio that can weather any storm. By learning to read tools like the VIX, you get a much better feel for how the headlines connect to the real-time mood of the market.

    If you’ve only ever invested in U.S. stocks, you might think of volatility as a somewhat predictable beast. But it’s a whole different animal depending on where you are in the world. The relatively tame price movements in a developed market can feel worlds away from the wild, unpredictable swings you’ll often see in emerging markets across Asia or Latin America.

    Geography, it turns out, plays a massive role in an asset's risk profile.

    It’s not random, either. Established economies tend to have mature regulatory systems, stable political landscapes, and enormous, liquid markets. This foundation naturally creates a more predictable environment for investors, which usually translates to lower volatility. Sure, price swings still happen, but they’re often driven by things like economic data and corporate earnings—not sudden political chaos.

    The Dynamics of Emerging Markets

    Emerging markets, on the other hand, march to the beat of a much faster, more erratic drum. Their higher volatility is a direct result of a few key ingredients:

    • Political Instability: Developing nations can go through rapid political shifts, and that kind of uncertainty spooks businesses and investors alike.
    • Economic Transitions: These economies are often in the middle of super-charged growth and massive structural changes. This makes them much more vulnerable to shocks and quick reversals in investor sentiment.
    • Currency Fluctuations: An emerging market's currency can swing wildly against major players like the U.S. dollar. This adds a whole other layer of risk—and volatility—to your investments.

    When you mix these factors together, you get a much more turbulent investing landscape. It's plain to see when you look at the data. For instance, the stock market in Pakistan from 1999 to 2021 saw huge price swings directly tied to its economic and political journey. Japan's market, from 1984 to 2021, tells a different story of cycles and external shocks. You can dig into more of these global volatility trends over at the St. Louis Fed.

    Understanding this regional risk is non-negotiable for anyone investing internationally. The same strategy that works like a charm in Germany could be a complete disaster in Brazil.

    Ultimately, this global patchwork of volatility underscores one of the most fundamental principles of smart investing: diversification. Spreading your money across different geographic regions can help balance out your portfolio. While one market is taking a nosedive, another could be hitting new highs. This approach doesn't get rid of risk entirely, but it can help you build a much more resilient portfolio that’s ready to weather storms, no matter where they start brewing.

    Practical Strategies for Volatile Markets

    Image

    Knowing what market volatility is is one thing. Actually learning how to handle it is where the rubber meets the road for successful investors.

    Turbulent markets can be incredibly unsettling, no doubt about it. But with the right game plan, you can navigate them with confidence instead of fear. The trick is to stop reacting emotionally and start acting methodically.

    A well-thought-out plan, something you put together when things are calm, becomes your anchor in a storm. These are the proven techniques that help manage risk and keep your eyes on the prize—your long-term financial goals—even when the market feels like it’s going haywire.

    Build a Resilient Portfolio with Diversification

    The single most powerful weapon in your arsenal against volatility is diversification. There's a reason the old saying "don't put all your eggs in one basket" is the cornerstone of investing. Spreading your money across different types of assets helps cushion your portfolio when one area takes a nosedive.

    When one part of your portfolio is struggling, another might be doing just fine—or even thriving. This balance helps smooth out your overall returns. You’ll want a solid mix of assets like:

    • Stocks: They offer the highest potential for growth but also bring the most volatility to the table.
    • Bonds: These are generally more stable, provide income, and often move in the opposite direction of stocks.
    • Real Estate: Can be a great hedge against inflation and provide steady cash flow, moving independently of traditional financial markets.
    • Commodities: Assets like gold can act as a "safe haven" when the economy gets shaky and investors get nervous.

    The whole point is to own a collection of assets that don't all zig and zag in the same direction at the same time. That balance is what gets you through the unpredictable swings of the market.

    Asset allocation isn't just some generic strategy; it's your personalized blueprint. It aligns your investments directly with how much risk you're comfortable taking and what you're trying to achieve, making sure you stay on a path that lets you sleep at night.

    Embrace Consistency with Dollar-Cost Averaging

    Another killer strategy is dollar-cost averaging. This is a fancy term for a simple concept: you invest a fixed amount of money at regular intervals, no matter what the market is doing.

    Think of it as putting your investing on autopilot. By investing consistently, you naturally buy more shares when prices are low and fewer shares when they're high.

    This disciplined approach takes the emotion out of it and stops you from trying to "time the market"—a game that even the pros rarely win. Over time, this can lower your average cost per share and seriously reduce the impact of volatility on your portfolio. It makes for a much smoother ride.

    Master Your Mindset to Avoid Costly Mistakes

    At the end of the day, the biggest threat to your portfolio during a volatile period isn't the market itself. It’s you.

    Fear and greed are powerful emotions that can lead to terrible decisions, like panic-selling at the very bottom or piling into a hot stock just as the bubble is about to pop.

    The best way to fight this is to have a clear, long-term plan and the discipline to stick with it. You have to remind yourself that downturns are a completely normal, expected part of investing. For more on keeping a level head, check out these essential stock market investing tips that hammer home the long-term perspective.

    Your strategy is your best defense against making emotional, short-sighted moves you'll later regret.

    Finding Opportunity in Market Volatility

    For most people, the gut reaction during a market nosedive is to sell everything and protect what's left. But if you can make one crucial shift in your thinking, you'll start to see market volatility not just as a threat, but as a massive opportunity.

    When fear is running the show, asset prices can completely detach from their real, long-term value. Think of it like this: market downturns are basically a Black Friday sale for high-quality stocks. They give disciplined investors a chance to buy into fantastic companies at a huge discount. The trick is learning to ignore the panicked noise and focus on the solid business fundamentals underneath.

    Turning Fear into a Strategic Advantage

    Making this mindset shift isn't about being reckless; it's about having patience and a rock-solid plan. Instead of freaking out over scary headlines, you're actively hunting for chances to buy assets you already believe in, just at a much better price. Suddenly, widespread market panic becomes your personal strategic advantage.

    We can actually measure this panic. Market volatility is quantified by how wildly stock prices are swinging. For example, back in 2021, the U.S. stock price volatility index was 24.99, which was considered moderately turbulent at the time. Keeping an eye on these metrics gives you context, helping you tell the difference between normal market chop and a truly unusual event. You can learn more about how these figures reflect market conditions.

    The big takeaway here is that volatility is completely normal. Understanding it gives you power, and having a well-defined strategy is your best defense. A prepared investor doesn't fear downturns; they get ready for the opportunities that come with them.

    This isn't just about stocks, either. The same principles apply across different types of investments. While we're mostly talking about traditional markets, some people look for stability elsewhere. For a different perspective on building a portfolio, you might find it interesting to explore the world of investing in unique tangible assets like collectible coins.

    Ultimately, you want an investment approach that can do well no matter what the market is doing. By remembering that volatility is just part of the game and that a good strategy is everything, you can stay confident and prepared. This allows you to make calm, rational decisions, turning moments of chaos into calculated moves for long-term growth.

    Answering Your Questions About Market Volatility

    Even after you get the hang of what market volatility is, a few questions always seem to pop up. Let's tackle some of the most common ones head-on to clear things up.

    Does High Volatility Mean a Market Crash Is Coming?

    Not necessarily. It's easy to see why people make that connection, but it's a bit of a misconception.

    While big market downturns are almost always volatile, a spike in volatility is really just a sign of uncertainty. Think of it as the market getting jumpy. This could be due to anything from a surprising economic report to some geopolitical drama that has investors on edge.

    We often hear about the VIX, the so-called "fear gauge," spiking during these times. But it's crucial to remember what it's actually measuring: expected turbulence over the next 30 days. It’s a short-term sentiment snapshot, not a crystal ball predicting a long-term collapse.

    What Are the Safest Investments During Volatile Times?

    When the stock market starts swinging wildly, you'll see a lot of investors run for cover in what are known as "safe-haven" assets. These are investments that have a reputation for either holding their value or even going up when everything else is going down.

    The classic safe havens include:

    • Government Bonds: U.S. Treasuries are the big one here. They're backed by the full faith and credit of the U.S. government, which makes them the go-to choice for capital preservation.
    • Precious Metals: Gold is the king here. For centuries, it has been seen as a reliable store of value when economies get rocky.
    • Certain Currencies: The U.S. dollar, funny enough, often acts as a global safe harbor. When uncertainty hits the world stage, money tends to flow into the dollar.

    The key is that these assets usually don't move in lockstep with the stock market. That low correlation is what provides that crucial balancing act for a well-diversified portfolio.

    How Should I Use the VIX in My Investment Strategy?

    The best way to think of the VIX is as a mood ring for the market, not a direct trading signal. It tells you what the general feeling is out there.

    When the VIX reading is high (say, above 30), it's a pretty clear sign of fear and panic. Some disciplined, long-term investors actually see this as a potential buying opportunity. The logic is that when everyone is panicking, great companies might get thrown out with the bathwater and become undervalued.

    On the flip side, a super low VIX reading (maybe below 20) can signal that investors are getting a little too comfortable and complacent. That might be a cue to take a more cautious or defensive stance in your own portfolio. It’s a useful tool, but it should always be just one piece of a much larger puzzle.


    At Investogy, we cut through the noise by sharing the "why" behind every move in our real-money portfolio, helping you build conviction during volatile times. See our research and track our performance by subscribing to our free weekly newsletter. Learn more at Investogy.com.

  • What Is Fundamental Analysis and How Does It Work

    What Is Fundamental Analysis and How Does It Work

    Fundamental analysis is all about figuring out a company's intrinsic value. That’s a fancy term for what a business is actually worth, regardless of its day-to-day stock price swings. Think of it as the deep-dive investigation into a company’s overall financial health and business prospects.

    It’s the only way to truly understand if a stock is a bargain or just overpriced hype.

    What Is Fundamental Analysis in Simple Terms

    Image

    Let’s say you’re buying a used car. You wouldn't just glance at the odometer and the price tag before handing over your cash, right? Of course not.

    You’d pop the hood, check the engine, and maybe even take it to a trusted mechanic. You’d look up its history, see if it’s been in any accidents, and compare its price to similar models. This whole process is designed to uncover the car's real value so you can decide if the seller’s price is fair.

    Fundamental analysis is the exact same concept, just for stocks. It's about being a business inspector, not a gambler. You’re looking past the market noise to understand the true, underlying value of the company itself.

    Looking Under the Hood

    Instead of getting caught up in fleeting market trends or trying to decipher cryptic chart patterns, this method forces you to get your hands dirty and dig into the business itself. An investor using fundamental analysis pieces together a wide range of information to build a complete picture of a company’s health and where it's headed.

    This process involves rolling up your sleeves and evaluating several key areas:

    • Financial Health: You'll spend a lot of time poring over financial statements. The income statement, balance sheet, and cash flow statement are your best friends here. They tell you everything from profitability and debt levels to how efficiently the company operates.
    • Industry Position: It's not just about the company, but the world it lives in. You need to analyze its competitors, its market share, and the overall growth potential of its industry. Is it a big fish in a shrinking pond, or a small fish in a rapidly expanding ocean?
    • Management Quality: A company is only as good as the people running it. You need to assess the leadership team’s experience, their track record, and whether their strategic vision for the future actually makes sense.
    • Economic Conditions: You also have to zoom out and look at the big picture. Macroeconomic factors like interest rates, inflation, and GDP growth can have a huge impact on a business, for better or worse.

    To give you a clearer picture, let's break down these components into a simple table.

    Fundamental Analysis at a Glance

    This table maps out the core parts of fundamental analysis, showing you the goal, the tools of the trade, and the kind of data you'll be working with.

    Component Description Example
    Goal To determine a stock's intrinsic value—what it's truly worth. Calculating that Apple (AAPL) is worth $220 per share when it's trading at $190.
    Primary Tools Financial statements, industry reports, and economic forecasts. Analyzing a company’s 10-K report, reading a Gartner industry analysis.
    Data Types A mix of quantitative (the numbers) and qualitative (the story). Using P/E ratios (quantitative) and assessing brand strength (qualitative).

    Ultimately, this all boils down to one simple question: is the company’s stock trading for less than it’s truly worth? If your deep-dive research tells you the intrinsic value is higher than the current market price, you might have just found a great investment.

    Fundamental analysis is a disciplined approach that helps you make decisions based on business reality, not just market sentiment. By focusing on a company's genuine strengths and its long-term potential, you can invest with a whole lot more conviction.

    How Fundamental Analysis Evolved Over Time

    Image

    Fundamental analysis didn't just appear out of thin air. It grew from a simple, yet powerful idea: a company's stock price should, eventually, line up with its real-world business performance. Long before high-speed internet and endless data streams, the earliest investors were more like financial detectives, painstakingly piecing together clues to figure out what a company was truly worth.

    That investigative spirit has been the heart of the discipline for over a century. It all started with early economic theories, where pioneers focused on the big picture to estimate a security's intrinsic value. They looked at earnings, sure, but also at things you couldn't easily quantify, like the state of the industry and the quality of the people in charge. Back then, the approach was overwhelmingly top-down, relying on macroeconomic factors like GDP growth and interest rates to predict which way the market winds were blowing. You can learn more about these early days on QuantifiedStrategies.com.

    From Broad Strokes to Fine Details

    As markets got more complicated, and especially after seismic events like the Great Depression, investors started realizing that just looking at the economy wasn't enough. The discipline had to evolve. It needed to get more granular and zero in on the companies themselves. This crucial shift was championed by legends like Benjamin Graham, widely known as the "father of value investing."

    Graham and his peers brought a new level of rigor to the game, introducing a bottom-up approach. They built a framework for dissecting a company's financial statements, searching for hard evidence of its financial health. This was a game-changer, moving the focus from broad economic predictions to detailed corporate investigations.

    Key Takeaway: The history of fundamental analysis is a story of shifting focus—from a wide, economy-sized lens to a sharp, company-specific microscope. Today, a good analyst knows how to use both.

    Adapting to a Modern World

    The core principles of fundamental analysis haven't changed much, but the tools we use have been completely transformed. Technology now gives us instant access to a staggering amount of data, letting analysts run calculations and spot trends that would have been impossible just a few decades ago.

    But it’s not just about the tech. The scope of the analysis itself has broadened. Today’s analysts look beyond the balance sheet to consider things like investor psychology and corporate governance. The questions have become more nuanced:

    • Brand Strength: What's a company's reputation actually worth in dollars and cents?
    • Corporate Culture: Is the company a place that encourages innovation and ethical decisions?
    • Technological Disruption: How ready is the business for the next big industry shift?

    This constant adaptation is proof that fundamental analysis isn't some dusty, rigid set of rules. It’s a living, breathing discipline that has evolved to meet the challenges of modern markets, cementing its place as an essential tool for any serious investor.

    Decoding the Numbers in Financial Statements

    If you want to get a real feel for a company's health, you have to look past the headlines and get your hands dirty with its financial records. I like to think of a company’s financial statements as the dashboard of a car. Each gauge tells you something different but equally vital about the vehicle's performance and condition.

    These core documents are the heart of what’s called quantitative analysis, giving you the raw data needed to size up a business. For investors, the "Big Three" financial statements are the primary tools for the job.

    The infographic below shows how digging into a company's financials is a central pillar of the whole fundamental analysis process, sitting right alongside macroeconomic and industry trends.

    Image

    As you can see, a company's own financial data provides the direct, internal proof of its health. Your job is to then place that proof within the context of what’s happening in the broader economy and its specific industry.

    The Three Essential Gauges

    Each of the main financial statements offers a unique window into the business's operations and stability.

    • The Income Statement: This is like your car’s speedometer, showing performance over a specific period—usually a quarter or a year. It lays out a company’s revenues, subtracts all the expenses, and tells you what’s left over: its profitability.

    • The Balance Sheet: Think of this as a snapshot of the car at a single moment in time. It lists what the company owns (assets) and what it owes (liabilities), giving you a crystal-clear picture of its financial structure and net worth.

    • The Cash Flow Statement: This is the fuel gauge. It tracks the actual cash moving in and out of the company. It reveals how a business is generating and using its cash, which is absolutely critical for its day-to-day survival and ability to grow.

    Looking at these three documents together gives you a multi-dimensional view of a company’s financial reality. But just reading them is the first step. The real magic happens when you start connecting the dots with financial ratios.

    Using Ratios as Your Diagnostic Tools

    Financial ratios are powerful. They turn all those raw numbers into insights you can actually use. They let you compare a company's performance against its own past or, even better, against its direct competitors.

    These simple calculations are the backbone of fundamental analysis. Analysts use metrics like earnings, revenue, and profit margins to create these ratios, which help them figure out if a company is stable and if its stock is fairly priced. Daloopa has a great piece on where to efficiently get data for fundamental analysis.

    Financial ratios help transform abstract data into a clear story about a company’s strengths, weaknesses, and overall potential as an investment.

    To give you a better idea, here's a breakdown of some of the most common ratios you'll come across.

    Key Financial Ratios Explained

    Financial Ratio What It Measures Why It Matters
    Price-to-Earnings (P/E) Ratio The company's stock price relative to its earnings per share (EPS). It’s a quick way to gauge if a stock is overvalued or undervalued compared to its peers or the market. A high P/E might suggest high growth expectations.
    Return on Equity (ROE) How efficiently management is using shareholder money to generate profits. A consistently high ROE often signals a strong, well-managed company with a competitive edge. It's a key indicator of profitability.
    Debt-to-Equity (D/E) Ratio How much debt the company uses to finance its assets versus how much it uses from shareholder equity. This is a critical risk indicator. A high D/E ratio can mean a company is taking on too much debt, making it vulnerable during economic downturns.

    By calculating and tracking these ratios, you graduate from simply reading numbers to interpreting the story they’re telling you.

    For example, a company with a consistently high ROE and a low D/E ratio is often a sign of a very strong business. These are the kinds of insights that turn a good investor into a great one.

    And if you want to get a much deeper understanding of profitability metrics, you can learn more about what Earnings Per Share (EPS) is in our detailed guide.

    Analyzing What the Numbers Don't Show

    Image

    Financial statements tell a powerful story about where a company has been, but they don't always reveal where it's going. Real fundamental analysis means looking past the numbers on a spreadsheet to get a feel for the intangible factors that drive long-term success.

    This is what we call qualitative analysis, and it’s about understanding the business as if you were going to own it for the next 20 years.

    Think of it this way: two restaurants might have identical profits. One is a beloved local spot with a visionary chef and regulars who've been coming for a decade. The other is a generic chain with high employee turnover and so-so food. Which one would you rather own? The numbers alone don't give you the answer.

    The Power of an Economic Moat

    One of the most important things to look for is a company's competitive advantage, or what Warren Buffett famously calls its "economic moat." This is what protects a business from rivals trying to steal its profits. A wide moat makes a company incredibly tough to compete with.

    These advantages aren't line items on a balance sheet, but they are immensely valuable:

    • Brand Strength: Just think of Apple or Coca-Cola. Their brand loyalty is so powerful that customers will happily pay a premium, creating a durable shield against competitors.
    • Patents and Intellectual Property: A pharmaceutical company with a patent on a blockbuster drug has a government-granted monopoly for a set period. That's a guaranteed stream of revenue.
    • Network Effects: Platforms like Facebook or Amazon become more valuable as more people use them. This creates a virtuous cycle that makes it incredibly difficult for a new competitor to gain a foothold.

    A company with a strong moat can fend off the competition and sustain its profitability for years, which makes it a much more reliable long-term investment.

    Leadership and Corporate Culture

    Beyond its market position, the quality of a company's management team is crucial. Are the leaders experienced visionaries with a clear strategy, or are they just coasting? A great CEO can steer a company through tough times and spot growth opportunities that others completely miss.

    Great management can turn a good company into an exceptional one, while poor leadership can run even the strongest business into the ground. It’s a factor that requires judgment, not just calculation.

    And don't overlook corporate culture. A company that fosters innovation, treats its employees well, and operates ethically can be a huge asset. It attracts top talent and builds trust with both customers and partners.

    These qualitative insights are what give you the full picture. They add the "why" to the "what" you get from the financial statements. While quantitative data from a cash flow statement shows a company's financial health, understanding its qualitative strengths helps you feel out its resilience and future potential.

    For a deeper dive into the numbers side, check out our guide explaining what cash flow analysis is. By combining both the hard numbers and the softer, qualitative factors, you can build a three-dimensional view of a company’s true value.

    How to Do a Basic Fundamental Analysis

    Knowing the theory is one thing, but getting your hands dirty is how you really learn. Let's walk through a simplified fundamental analysis to see how these concepts actually click together in the real world.

    Imagine we're sizing up a fictional company, "InnovateTech," to decide if it's worth our hard-earned money. This example will give you a clear, repeatable framework you can use.

    For a deeper dive, our guide on how to analyze stocks for beginners is a great next step.

    Our process will follow three logical steps, blending the hard numbers with the softer, qualitative side to build a complete picture.

    Step 1: Start with the Numbers

    First things first, we pull up InnovateTech's financial statements. We’re not just staring at numbers; we're hunting for trends and calculating a few key ratios to check its pulse.

    • Profitability: A glance at the income statement shows revenue has been growing at a solid 15% a year for the last three years. Even better, its net profit margin is a healthy 20%. This tells us the company is pretty darn good at turning sales into actual cash profit.
    • Financial Stability: Next up, the balance sheet. Its debt-to-equity (D/E) ratio is just 0.4, which is quite low for the tech industry. That’s a great sign. It means the company isn't propped up by a mountain of debt and has a strong financial backbone.
    • Valuation: Finally, we run the Price-to-Earnings (P/E) ratio, and it comes out to 18. The average for its competitors is sitting around 25. At first glance, this suggests InnovateTech’s stock might be on sale—potentially undervalued compared to its peers.

    Step 2: Look Beyond the Spreadsheet

    The numbers look good, but they never tell the whole story. Now it's time to investigate the things that don't fit neatly into a spreadsheet cell.

    We discover that InnovateTech is led by a visionary CEO who has a history of hitting home runs with new products. The company also holds several key patents on a new battery technology, giving it a strong "economic moat" to keep competitors at bay.

    On top of that, customer reviews are glowing, pointing to a fiercely loyal brand following. These are the kinds of qualitative strengths that suggest a company has a real, durable edge.

    An investment thesis is strongest when a compelling quantitative story is backed by powerful qualitative factors. One without the other leaves you with an incomplete picture.

    Step 3: Put It All Together and Make a Call

    Okay, let's connect the dots. We have InnovateTech, a profitable and financially sound company with low debt. Based on its P/E ratio, it also seems to be trading at a discount compared to the rest of its industry.

    Crucially, those strong numbers are backed up by fantastic leadership, a beloved brand, and patents that protect its business.

    By combining the quantitative data with these qualitative strengths, we can start to form an idea of its intrinsic value. In this case, we conclude that the company is likely worth more than its current stock price suggests. Based on this simple analysis, InnovateTech looks like a pretty compelling investment opportunity.

    Understanding the Limits of Fundamental Analysis

    Look, while fundamental analysis is an incredibly powerful tool for figuring out what a company is really worth, it's not a crystal ball. Anyone who tells you otherwise is selling something. Its main job is to help you spot potentially undervalued companies for a long-term hold, not to predict where the stock will be tomorrow or time the market's wild daily swings.

    Think of it like a ship's captain using maps of known waters. Fundamental analysis is built on historical data. Financial statements tell a great story about where a company has been, but they offer zero guarantees about the future. A business that was crushing it last year could get blindsided by a new competitor or a disruptive technology next year, making all that past success a pretty unreliable guide.

    The Challenge of Subjectivity

    Another huge limitation is just how subjective it can all be, especially when you get into the qualitative stuff. Two seasoned analysts can stare at the same leadership team or brand and walk away with completely different takeaways. One might see a visionary CEO, while the other sees a reckless gambler.

    This personal judgment means that any calculation of a company’s "intrinsic value" is, at the end of the day, an educated guess—not a hard-and-fast number. This is precisely why sharp analysts often lean on statistical tools to bring a dose of objectivity to the process.

    To get a handle on whether a historical average points to a real expected return or is just random market noise, analysts often use statistical significance tests. This is a much more rigorous way to validate their hunches and make smarter portfolio decisions.

    For example, to tell the difference between a genuine trend and a random blip, they might calculate a t-statistic. By comparing that result to a t-distribution, they can figure out the probability that what they're seeing is purely due to chance. It adds a crucial layer of validation that separates professional analysis from pure guesswork. You can learn more about applying financial statistics from the pros at IFA.com.

    Ultimately, getting what fundamental analysis is all about means accepting its flaws. It's an indispensable tool for developing a deep, almost intimate understanding of a business. But it works best when you pair it with a clear-eyed view of its constraints and a healthy dose of skepticism. It gives you the map, but you still have to navigate the unpredictable seas of the market yourself.

    Got Questions? Let's Talk.

    If you’re just getting your feet wet with fundamental analysis, it's natural to have a few questions. In fact, most new investors wonder about the same things. Let’s clear up some of the most common ones right now.

    What's the Real Difference Between Fundamental and Technical Analysis?

    It's a classic question, and the answer helps define two totally different investing philosophies.

    The easiest way I've found to explain it is this: fundamental analysis is about investigating the business, while technical analysis is about studying the stock itself.

    • Think of a fundamental analyst as a detective trying to figure out what a company is truly worth. You're poring over financial reports, checking out the management team, and sizing up the competition to calculate the company's long-term value.
    • A technical analyst, on the other hand, is more like a market psychologist. They don't care about profits or products. They're obsessed with stock charts, looking for patterns in price and trading volume to guess where the stock is headed next based purely on market sentiment.

    A fundamental investor asks, “Is this a great business to own a piece of for the long haul?” A technical trader asks, “Is right now a good time to buy or sell this stock?” Many of the best investors actually use a bit of both.

    Can You Use This for Anything Besides Stocks?

    Absolutely. While stocks are its most famous application, the core idea behind fundamental analysis works for almost anything you can invest in. The goal is always the same: figure out what an asset is really worth based on what drives its value.

    For instance, if you were analyzing bonds, you wouldn't look at a stock chart. You'd dig into the issuer's financial health to see if they can actually afford to pay you back. With real estate, you'd analyze things like potential rental income, property taxes, and the local housing market trends.

    Okay, I'm In. How Do I Actually Start?

    Getting started is way less intimidating than it sounds. My advice is always the same: keep it simple.

    Pick a company you already know and like—maybe it’s the coffee you drink every morning or the phone in your pocket. You already have a feel for the business, which is a huge head start.

    Next, find their latest annual report (this is called a 10-K). Don't get overwhelmed and try to read all 100+ pages. Just start with two things: the "Business" section to see exactly how they make money, and then glance at the income statement to see if their sales and profits are going up or down. That's it. Taking that first small step will give you the confidence to dig in deeper next time.


    Ready to see how this works with real companies and real money? The Investogy newsletter is where I break down my own research, showing you how I apply these exact principles to build a portfolio. Subscribe for free to see my investment theses and get behind-the-scenes research.

  • How to Analyze Stocks for Beginners

    How to Analyze Stocks for Beginners

    Learning how to analyze stocks really just boils down to one simple, powerful idea: you want to stop guessing and start making educated decisions. It's all about looking past the market noise and the latest hype to understand what a company is truly worth. This skill is the bedrock for building an investment portfolio that actually gets you closer to your financial goals.

    Why Stock Analysis Is Your Most Important Skill

    Jumping into the stock market without a plan is like trying to drive across the country without a map. Sure, you might get lucky and stumble upon your destination, but you’re far more likely to get hopelessly lost. Stock analysis is your map.

    It gives you the confidence to do more than just buy shares in companies you recognize from TV commercials. It's the actual work of digging into a stock to figure out where it’s headed and whether it’s a good fit for your money.

    When you know how to properly analyze a stock, you can do three critical things:

    • Find Real Value: You learn to spot solid companies that the market might be overlooking, instead of just chasing the hot stock of the week.
    • Manage Your Risk: Getting a handle on a company’s debt, profits, and place in its industry helps you dodge bullets and protect your hard-earned capital.
    • Invest With a Purpose: Analysis makes sure the stocks you pick actually line up with what you're trying to achieve, whether that's long-term growth or a steady stream of income.

    This entire skill is built on two core methods. Think of them as the two most essential tools in your investing toolkit. Each one gives you a completely different way to look at a potential investment.

    The Two Pillars of Stock Analysis

    First up is fundamental analysis. This is where you become a business detective. You're digging deep into a company's financial statements—the income statement, balance sheet, and cash flow statement—to figure out its real health and intrinsic value.

    Is the company actually making money? Can it handle its debt? Does it have a real, sustainable edge over its competitors? This approach is all about understanding the "why" behind an investment.

    The second pillar is technical analysis. This is more like being a market psychologist. Instead of pouring over financial reports, you’re studying stock charts, price patterns, and trading volume to get a feel for market sentiment.

    Is the stock's price on an upward trend? Are there specific price levels where everyone seems to be buying or selling? This approach helps you figure out the "when" of an investment—the timing.

    To help you see the difference clearly, here’s a quick breakdown of how these two approaches stack up.

    Fundamental vs. Technical Analysis: A Quick Overview

    This table breaks down the core differences between the two main stock analysis methods. Understanding this will help you decide which approach, or combination of approaches, works best for you.

    Aspect Fundamental Analysis (The 'Why') Technical Analysis (The 'When')
    Main Goal Determine a company's intrinsic value. Identify trading opportunities based on market trends.
    Time Horizon Long-term (months, years, decades). Short-term (days, weeks, months).
    Tools Used Financial statements, economic data, industry trends. Stock charts, price patterns, technical indicators (like moving averages).
    Key Question "Is this a good company to own?" "Is now a good time to buy or sell?"
    Investor Type Long-term investors, value investors (like Warren Buffett). Traders, swing traders, day traders.

    Ultimately, many of the most successful investors use a blend of both. They use fundamental analysis to find great companies and then lean on technical analysis to find a good entry point.

    "The individual investor should act consistently as an investor and not as a speculator." – Ben Graham

    Ben Graham’s timeless advice hits the nail on the head. Analysis is what separates true investing from pure speculation. It's about building a solid, evidence-based case for every dollar you put into the market.

    Understanding the Sheer Scale of the Market

    When you learn to analyze stocks, you're plugging into a massive global machine. Just to give you some context, the total global market capitalization is expected to hit a mind-boggling $127.4 trillion in 2025. The United States accounts for the biggest piece of that pie, at roughly $44.8 trillion.

    Giant exchanges like the Nasdaq and the New York Stock Exchange are the nerve centers of all this activity. Understanding a company’s size (its market cap) and where it trades helps you see how your individual investments fit into this enormous economic landscape. If you want to dive deeper, you can explore more stock market statistics to see the bigger picture.

    By learning these skills, you’re not just picking stocks. You’re building a framework to navigate this vast market with purpose and confidence.

    Decoding a Company's Financial Health

    Want to know the secret to picking solid stocks? Forget the talking heads on TV and the latest market craze. You need to become a business detective.

    To really get what makes a stock tick, you have to look past the ticker symbol and dig into the health of the actual company behind it. This is what we call fundamental analysis, and it all starts with learning to read a company's financial story.

    This story is told through three key documents: the income statement, the balance sheet, and the cash flow statement. Don't worry, you don't need an accounting degree. You just need to know where to look.

    The Three Core Financial Statements

    Think of these documents as a company's annual check-up, its report card, and its bank statement all rolled into one. Each one gives you a different piece of the puzzle.

    • The Income Statement is pretty straightforward. It shows you if a company is making or losing money over a certain period, like a quarter or a year. It lists out the revenue, subtracts all the costs, and lands on the net income—the famous "bottom line."

    • The Balance Sheet is more like a snapshot in time. It shows what a company owns (assets) and what it owes (liabilities). The core idea is simple: Assets = Liabilities + Shareholders' Equity. This tells you if the company is on solid ground or drowning in debt.

    • The Cash Flow Statement is arguably the most important of the three. It tracks every dollar coming in and going out. Why does this matter so much? Because a company can look profitable on paper but still go bankrupt if it runs out of actual cash. This statement shows you the real-deal money situation.

    As you start pulling these reports, you'll quickly realize you're dealing with a lot of data. Learning how to manage it all is a skill in itself. For some great tips on keeping your research organized, check out these resources on effective research data management.

    Key Metrics That Tell the Real Story

    Once you get comfortable with the main statements, you can start pulling out a few key numbers that give you some powerful insights. These ratios cut through the noise and help you compare different companies without getting lost in the weeds.

    Let's break down three of the most important ones for anyone just starting to analyze stocks.

    1. Earnings Per Share (EPS)

    You'll hear this one thrown around all the time, and for good reason. EPS tells you exactly how much profit a company generated for each outstanding share of its stock.

    Calculation: (Net Income – Preferred Dividends) / Average Outstanding Shares

    A company whose EPS is consistently climbing is usually a sign of a healthy, growing business. It's a direct line to a company's earning power, which is what really drives a stock's value over the long haul. If you want to dive deeper, we have a whole guide on what Earnings Per Share really means.

    2. Price-to-Earnings (P/E) Ratio

    The P/E ratio takes EPS and puts it into context. It compares the company's stock price to its earnings, giving you a quick read on whether the stock seems cheap or expensive right now.

    Calculation: Market Value Per Share / Earnings Per Share (EPS)

    A super-high P/E isn't automatically bad; it often means investors are betting on huge future growth (think of a hot tech startup). On the flip side, a low P/E might mean the stock is a bargain, or it could signal that investors don't expect much growth (like a stable utility company). Context is king here.

    Real-World Scenario Comparing P/E Ratios

    Company Type Example P/E Ratio What It Suggests
    High-Growth Tech 45x Investors are paying $45 for every $1 of current earnings, betting on rapid future growth.
    Stable Utility 15x Investors are paying $15 for every $1 of current earnings, expecting steady but slow growth.

    See how different they are? This is why you never look at a P/E ratio in a vacuum. You have to compare it to other companies in the same industry and to the company's own historical P/E.

    3. Debt-to-Equity (D/E) Ratio

    This metric is your go-to for sniffing out financial risk. It measures how much debt a company is using to run its business compared to how much of its own money (shareholders' equity) is in the game.

    Calculation: Total Liabilities / Shareholders' Equity

    A high D/E ratio, usually anything over 2.0, means a company is leaning heavily on debt. That can turbocharge growth, but it's risky if business suddenly slows down. A lower ratio points to a more conservative, stable company. Just remember, some industries (like banking) are naturally debt-heavy, so always compare apples to apples.

    Learning to read these numbers is like learning a new language—the language of business. It gives you the power to look past the headlines and make smart decisions based on a company's actual performance and financial strength.

    Finding a Stock's Fair Value

    Spotting a fantastic, well-run company is only half the battle. Seriously. The next question every investor has to ask is: "Am I paying a fair price for this thing?" Even the best business on the planet can be a terrible investment if you overpay, which is why figuring out a stock's real value is so critical.

    Image

    This all comes down to estimating a company's intrinsic value—what its shares are truly worth based on its financial health and future potential, not just its fickle day-to-day stock price. The goal is simple: buy stocks for less than they are actually worth. A crucial part of this is getting good at building stronger financial models.

    The Cornerstone of Value Investing: Margin of Safety

    The legendary investor Benjamin Graham gave us a concept that has been the north star for value investors for decades: the margin of safety. Think of it as your investing cushion, a built-in buffer for when things inevitably go wrong.

    Buying a stock with a margin of safety means you're purchasing it for a lot less than your estimate of its intrinsic value. Let's say you do your homework and figure a stock is worth $100 per share. If you can buy it at $70, you’ve just given yourself a $30 margin of safety.

    This buffer is your protection if:

    • Your analysis was a bit too rosy: Hey, nobody's perfect. Your valuation might be off.
    • The company hits a rough patch: Unexpected industry issues or internal stumbles can hurt performance.
    • The whole market takes a dive: A bear market can drag down even the best stocks for a while.

    "The function of margin of safety is, in essence, that of rendering unnecessary an accurate estimate of the future. If the margin is a large one, then it is enough to assume that future earnings will not fall far below those of the past in order for an investor to feel sufficiently protected."

    This idea is the very heart of value investing. It shifts your focus from trying to perfectly predict the future to simply buying good assets at a cheap enough price to survive an uncertain one. If this approach resonates with you, you'll probably enjoy our deep dive on the differences between growth and value stocks.

    How Market Fear Creates Opportunity

    So where do you find these amazing deals? The best times to find stocks with a wide margin of safety often pop up during periods of market panic. When fear is running high, people sell everything, pushing the prices of excellent companies down to bargain-bin levels. This is where a disciplined analyst can clean up.

    We saw a perfect real-world example of this recently. As of mid-2025, the U.S. stock market was trading at a modest 3% discount to what analysts considered its fair value. Not bad.

    But just a couple of months earlier, in April 2025, widespread pessimism had shoved the market down to a much more attractive 17% discount to fair value. That created a huge margin of safety and was a clear signal for many long-term investors to start buying.

    This scenario drives home a key lesson: the market price is what you pay, but value is what you get. Learning to analyze stocks is all about developing the skill and the patience to tell the difference. By focusing on buying great companies at a discount, you build a resilient portfolio that can weather any storm and deliver solid results over the long haul.

    Reading the Story of a Stock Chart

    If fundamental analysis is about digging into a company's financial health, technical analysis is more like reading the market's collective mood. It's the art of studying stock charts to get a feel for where the price might be headed next, all based on what it's done in the past. It might look complex, but you definitely don't need to be a Wall Street quant to get the hang of it.

    At its heart, technical analysis works on a pretty simple idea: the price you see on the screen reflects everything the market knows and, more importantly, history tends to rhyme. By learning to spot key patterns in price and trading volume, you can get a powerful glimpse into market psychology—the dance between fear and greed that drives millions of investing decisions.

    Image

    This approach helps you tackle the all-important "when" questions. When is a good time to buy? When should you think about selling? Let's walk through three core concepts you can start using right away.

    First, Figure Out the Primary Trend

    Before you do anything else, the first thing to do with any stock chart is to zoom out. You're looking for the big picture, the overall direction of travel. This is the trend, and having it on your side is like swimming with the current instead of against it. Is the price generally climbing, falling, or just treading water?

    • Uptrend: You'll see a series of "higher highs" and "higher lows." Each time the stock hits a new peak, it's higher than the last one, and each time it dips, the bottom is higher than the previous dip. This is a clear signal that buyers are in charge.
    • Downtrend: This is the exact opposite, defined by "lower highs" and "lower lows." It tells you sellers have the upper hand and are pushing the price down.
    • Sideways Trend (Consolidation): Here, the price bounces around in a fairly tight range, not really making any progress up or down. This usually signals a bit of indecision in the market, like a tug-of-war between buyers and sellers.

    There’s an old saying on Wall Street: "The trend is your friend." All it means is that you'll generally have an easier time and take on less risk if you trade with the primary trend instead of trying to fight it.

    Spotting Support and Resistance Levels

    As you stare at a chart, you'll start to notice the price seems to hit invisible floors and ceilings. These are what we call support and resistance levels. They’re basically psychological battlegrounds where a ton of buying or selling pressure kicks in.

    Support: The Price Floor
    Support is a price level where a downtrend tends to run out of steam because of a concentration of buyers. Think of it as a floor propping the price up. When a stock's price falls to a support level, buyers often jump in, thinking they've found a good deal. That influx of demand can be enough to stop the slide and push the price back up.

    Resistance: The Price Ceiling
    Resistance is the opposite of support. It's a price level where an uptrend often stalls out, hit by a wave of selling. As the price climbs toward a resistance level, investors who bought lower start to see it as a great time to lock in their profits. This selling creates a ceiling that the price has a hard time breaking through.

    A huge moment to watch for is when an old resistance level is broken. More often than not, that old ceiling becomes a new floor. This is a very bullish signal, suggesting the upward momentum has some real strength behind it.

    Why Trading Volume Matters

    Price tells you where a stock has been, but trading volume gives you a sense of the conviction behind that move. Volume is simply the total number of shares that changed hands over a given period, usually a day. You'll see it as a series of vertical bars at the bottom of a stock chart.

    Think of volume as the fuel in the engine. A big price jump on huge volume is a much more powerful signal than the same price move on light volume. It shows that a lot of investors are piling in, which helps confirm the trend. On the flip side, a sharp price drop on heavy volume can signal panic and intense selling pressure.

    Of course, a company's real-world financial performance is what drives its stock over the long haul. To get a better handle on how money actually flows through a business, it’s worth taking the time to learn more about what cash flow analysis is and how it connects to the story you see on the chart.

    Using Moving Averages to Smooth Out the Noise

    One of the most beginner-friendly and effective tools in technical analysis is the moving average (MA). An MA literally smooths out the choppy, day-to-day price action to give you a clearer view of the underlying trend. It works by calculating the average price of a stock over a set number of days.

    Two of the most widely followed moving averages are:

    1. 50-Day Simple Moving Average (SMA): This is often used as a proxy for the medium-term trend.
    2. 200-Day Simple Moving Average (SMA): This is the big one, often seen as the definitive line in the sand for the long-term trend.

    Generally speaking, when a stock's price is trading above both its 50-day and 200-day moving averages, it's considered to be in a healthy uptrend. If the price falls below these key levels, it can be a red flag that the trend is losing steam or even reversing. It's a simple way to help keep the market's momentum on your side.

    Making It Stick: Your Stock Analysis Game Plan

    Alright, you've absorbed the theory on financial statements, valuation metrics, and chart patterns. Now what? Knowledge is great, but without a repeatable process, it's just trivia. The real goal is to turn what you've learned into a confident, evidence-based investing decision.

    This is where you build your own workflow. Having a consistent routine is your best defense against making emotional, seat-of-your-pants decisions. It’s the framework that keeps you objective and ensures you've covered all the critical bases before putting your hard-earned money on the line.

    Creating Your Analysis Workflow

    The point isn't to find the "perfect" stock—that doesn't exist. Instead, you're building a strong case for why a company is a solid investment right now. Here’s a simple, repeatable process that combines everything we've talked about.

    1. The Story & The Screen: Start with a company in an industry you actually understand. What's their business model? Who are they up against? Grab their latest annual report (the 10-K) and read the "Business" and "Management's Discussion and Analysis" sections. This gives you the narrative behind the numbers.
    2. The Financial Health Check: Hop on a free tool like Yahoo Finance. Pull up the financials and look for trends over the last three to five years. Is revenue growing consistently? Is net income positive? Is cash flow from operations healthy?
    3. The Key Ratio Check: Now, dig into the metrics. Is the P/E ratio in the same ballpark as its direct competitors? Is the Debt-to-Equity ratio under 2.0 (or at least in line with its industry average)? Is the EPS heading in the right direction?
    4. The Technical Temperature Check: Fire up a chart on a platform like TradingView. Is the stock price trading above its 200-day moving average? That’s a classic sign of a long-term uptrend. Then, eyeball the chart to find the most obvious support and resistance levels.
    5. Building Your Thesis: Time to connect the dots. In one or two paragraphs, write down exactly why you think this stock is a good buy at its current price, based on your findings from the steps above.

    Following a structured approach like this is the best way to avoid "analysis paralysis"—that feeling of being so buried in data that you can't make a decision. The goal here is conviction, not absolute certainty.

    Sidestepping Common Beginner Mistakes

    As you start analyzing real companies, you're going to hit some bumps. The best investors aren't the ones who never make mistakes; they're the ones who learn how to manage them. Discipline is everything.

    One of the biggest traps for new investors is underestimating how much one stock can swing a small portfolio. If you have a $1,000 portfolio and put $200 into five different stocks, a single big winner or loser will have a massive impact. A stock that triples can pull your whole portfolio up, but one that tanks can just as easily wipe out all your other gains. You can discover more insights about portfolio risk on YouTube to see this in action.

    A Pro Tip on Risk: Never put more money into one stock than you’re truly comfortable losing. The fastest way to blow up your account is by making emotional moves driven by fear or greed.

    Before you buy a single share, you need a risk management plan. This infographic breaks down a simple, three-step way to think about risk before you enter a position.

    Image

    As the visual shows, your personal risk tolerance sets the stage for your stop-loss, which in turn helps you figure out the right position size for that specific trade.

    Common Questions About Stock Analysis

    Once you get past the theory, a whole new set of practical questions pop up. It happens to everyone. Moving from reading about analysis to doing your first analysis is where the real learning begins, and it's totally normal to hit a few snags.

    Let's walk through some of the most common questions that trip up beginners when they're just getting their hands dirty.

    Image

    How Much Money Do I Need to Start Buying Stocks?

    Honestly, you don't need a fortune to get in the game. Most modern brokerages now offer fractional shares, which means you can start with as little as $5 or $10. This is a game-changer. It lets you buy a small piece of a company like Apple or Amazon, even if a single share costs hundreds of dollars.

    The real key isn't how much money you start with. It's about building the habit of consistent investing and doing your homework. The principles are exactly the same whether you're investing $100 or $100,000. By starting with an amount you're comfortable losing, you get priceless, real-world experience without putting your finances at major risk.

    What Are the Best Free Tools for Stock Analysis?

    You can get an incredible amount of high-quality information without paying a dime. When you're just learning the ropes, there's absolutely no need to shell out for expensive subscription services.

    Here are a few of my go-to starting points:

    • Fundamental Data: You can't go wrong with Yahoo Finance, Google Finance, or Finviz. They give you full financial statements, all the key ratios, and company news, completely free.
    • Charting and Technicals: The free version of TradingView is ridiculously powerful. It has more than enough firepower for a beginner to start spotting trends, support levels, and resistance zones.
    • Your Broker's Tools: Don't overlook what you already have. Most online brokers provide their customers with a solid suite of research tools. Check out what your platform offers before you go looking elsewhere.

    The goal is to build a solid process first. A fancy tool won't make you a better analyst, but a repeatable process will. Master the free resources, and only think about paid tools if you hit a wall that a specific feature can solve.

    How Long Should I Spend Analyzing a Stock?

    There's no magic number here, but if you're a beginner, expect to spend a few focused hours on a single company for your first deep dive. This isn't a 15-minute job. Not if you want to do it right.

    A thorough first pass usually involves:

    1. Reading the most recent annual report (the 10-K), especially the "Management's Discussion and Analysis" section. This is where they tell their story.
    2. Scanning the last few quarterly reports to see what's been happening lately.
    3. Getting a handle on the company's main competitors and where it fits in the industry.
    4. Pulling up a long-term price chart to understand the stock's historical behavior.

    As you do this more and more, you'll get much faster and develop an intuition for it. The end goal is to get to a point where you can confidently explain why you're buying the stock to someone else in plain English. That’s your investment thesis.

    Should I Focus on Fundamental or Technical Analysis?

    Ah, the classic debate. For most people, the answer isn't one or the other—it's using both, but for different jobs.

    Think of it this way: fundamental analysis is your foundation, especially for long-term investing. It’s how you find great companies that are actually worth owning for years. It answers the question, "What should I buy?"

    Technical analysis is a fantastic complementary tool. It helps you time your entries and exits by giving you a read on market psychology and momentum. It answers the question, "When should I buy?"

    A powerful strategy is to use fundamentals to identify a high-quality business you want to own, and then use technicals to find a good opportunity to actually pull the trigger and buy the stock.

  • 7 Best Dividend Paying Stocks & Tools for 2025

    7 Best Dividend Paying Stocks & Tools for 2025

    Chasing high yields can be a trap. The real secret to successful income investing lies in finding the best dividend paying stocks and using the right tools to analyze their long-term health. Forget the get-rich-quick schemes; this guide is about building a sustainable income stream by focusing on quality, safety, and consistent growth.

    This article provides a comprehensive roundup of the essential platforms and research tools that empower you to look beyond the surface-level yield. We will identify truly durable dividend payers and show you exactly where and how to find them. Before diving deep into specific stocks and analysis tools, it's crucial to have a solid financial foundation. Learning to master your personal finances by tracking spending is the first step toward building a successful investment portfolio.

    We'll cut through the noise to show you which platforms offer the best screeners, in-depth research, and safety metrics. Inside this guide, you will find detailed profiles for each of the following, complete with screenshots and direct links to get you started:

    • Top-Tier Brokerages: Fidelity, Charles Schwab, and Vanguard.
    • Specialized Research Platforms: Seeking Alpha (Premium), Morningstar Investor, Dividend.com (Premium), and Simply Safe Dividends.

    Whether you're a seasoned income investor or just starting, this breakdown will equip you with the resources needed to make informed decisions, manage risk, and consistently compound your wealth. It's not just about finding dividends; it's about building a reliable financial future, one payout at a time.

    1. Fidelity: The All-in-One Hub for Dividend Investors

    For investors seeking a powerful, all-encompassing platform to discover and manage the best dividend paying stocks, Fidelity stands out as a top-tier choice. It merges comprehensive research tools with a user-friendly trading experience, making it an ideal one-stop shop for both new and seasoned income investors. The platform’s core strength lies in its ability to streamline the entire dividend investing process, from initial research to long-term portfolio management.

    Fidelity's $0 commission on U.S. stock and ETF trades eliminates a major cost barrier, allowing your investment capital to go further. This pricing structure is especially beneficial for dividend investors who frequently add to their positions or build a diversified portfolio of income-producing assets.

    Fidelity: The All-in-One Hub for Dividend Investors

    Why Fidelity Excels for Dividend Investing

    Fidelity’s stock screener is a particularly powerful tool for those hunting for quality dividend stocks. You can filter thousands of securities using specific dividend-focused criteria such as:

    • Dividend Yield: Isolate stocks within your desired yield range.
    • Dividend Growth Rate: Find companies with a strong history of increasing their payouts.
    • Payout Ratio: Screen for sustainable dividends by filtering out companies that pay out too much of their earnings.
    • Consecutive Years of Dividend Growth: Identify "Dividend Aristocrats" or other reliable growers.

    This level of customization helps you move beyond simple high-yield stocks and focus on companies with sustainable and growing income streams.

    Key Features and Practical Tips

    The platform’s Dividend Reinvestment Plan (DRIP) is another standout feature. Fidelity allows for the automatic reinvestment of dividends into fractional shares. This means every cent of your payout is put back to work, which significantly accelerates the power of compounding over time. For example, a $50 dividend from a stock trading at $200 per share would automatically purchase 0.25 additional shares.

    To get the most out of the platform, investors should enable the DRIP feature on all eligible holdings immediately after purchase. Furthermore, spend time exploring the "Research" tab for individual stocks to view detailed dividend history, ex-dividend dates, and analyst ratings, all in one place.


    Platform Highlights

    Feature Details & Benefits
    Trading Costs $0 online commissions for U.S. stocks and ETFs.
    Account Minimums $0 to open a standard brokerage account.
    Screening Tools Advanced screeners with dozens of dividend-specific filters.
    Dividend Reinvestment Automatic DRIP available for many securities, including fractional shares.

    Pros & Cons

    • Pro: Low costs and no minimums make it highly accessible.
    • Pro: Deeply integrated research tools are tailored for dividend investors.
    • Pro: Fractional share reinvestment maximizes compounding effects.
    • Con: Not all securities, like certain preferred stocks, are eligible for DRIP.
    • Con: Some third-party funds may carry additional platform-level fees.

    Find out more: https://www.fidelity.com

    2. Charles Schwab: Streamlined Dividend Investing for All

    Charles Schwab offers a robust and user-friendly platform that is exceptionally well-suited for investors focused on building a portfolio of the best dividend paying stocks. It excels by combining zero-commission trading on essential assets with a straightforward and powerful dividend reinvestment system. This blend makes it an excellent choice for individuals who value low costs, operational simplicity, and effective wealth-compounding tools.

    A key advantage for income investors is Schwab's commitment to low-cost access. With $0 online commissions for U.S. stocks and ETFs, investors can build and rebalance their dividend portfolios without worrying about trading fees eating into their returns. This structure encourages consistent investment, whether you are adding new capital or reinvesting small dividend payments.

    Why Charles Schwab Excels for Dividend Investing

    Schwab’s Stock Screener is a highly effective tool for dividend hunters, providing the necessary filters to pinpoint quality income-producing assets. You can easily narrow the universe of stocks based on critical dividend metrics, such as:

    • Dividend Yield: Target companies that meet your specific income requirements.
    • Dividend Growth: Identify businesses with a proven track record of increasing shareholder payouts.
    • Payout Ratio: Assess dividend sustainability to avoid risky "yield traps."
    • Price/Earnings (P/E) Ratio: Combine dividend criteria with value metrics for a more holistic analysis.

    These filters allow investors to move beyond chasing the highest yields and focus on identifying financially sound companies capable of providing reliable, long-term income.

    Key Features and Practical Tips

    The Schwab Dividend Reinvestment Plan (DRIP) is a cornerstone feature for long-term investors. The platform makes it incredibly simple to automatically reinvest cash dividends back into the same security, including fractional shares. This ensures that 100% of your payout is immediately put to work, harnessing the full potential of compound growth.

    For maximum efficiency, investors can enroll in DRIP directly on the trade confirmation screen when purchasing a new stock or ETF. Alternatively, you can manage reinvestment settings for all your holdings at any time from the "Positions" page. To further enhance your strategy, use the platform's research capabilities to review a stock’s dividend payment history and upcoming ex-dividend dates before making an investment. For a deeper dive into the analytical side, explore additional options with some of the best stock market research tools available.


    Platform Highlights

    Feature Details & Benefits
    Trading Costs $0 online commissions for listed U.S. stocks and ETFs.
    Account Minimums $0 to open a standard brokerage account, ensuring high accessibility.
    Screening Tools Robust stock screeners with key filters for yield, growth, and payout ratio.
    Dividend Reinvestment Easy, automatic DRIP enrollment for eligible securities, including fractional share reinvestment.

    Pros & Cons

    • Pro: No account minimums and commission-free trades make it ideal for all investor levels.
    • Pro: The DRIP process is exceptionally simple to manage and includes fractional shares.
    • Pro: A wide marketplace for funds and fixed-income products allows for greater diversification.
    • Con: Over-the-counter (OTC) stock trades incur a $6.95 commission.
    • Con: International stocks listed on local exchanges are not available for online trading.

    Find out more: https://www.schwab.com

    3. Vanguard Brokerage + Vanguard Dividend ETFs

    For investors who prioritize low costs and a straightforward approach to building a portfolio of the best dividend paying stocks, Vanguard offers a compelling combination of a brokerage platform and its own suite of world-class dividend ETFs. This dual offering is perfect for those who prefer a long-term, set-it-and-forget-it strategy, leveraging expertly managed funds to achieve their income goals. Vanguard's core philosophy of keeping investor costs to an absolute minimum is its defining advantage.

    The platform offers $0 commissions for online stock and ETF trades, making it an affordable place to build and maintain a dividend portfolio. This cost-effective structure ensures that more of your money is invested directly into income-generating assets, rather than being eroded by fees over time.

    Vanguard Brokerage + Vanguard Dividend ETFs

    Why Vanguard Excels for Dividend Investing

    Vanguard's true strength lies in its lineup of proprietary, low-cost dividend-focused ETFs. These funds provide instant diversification across hundreds of quality dividend-paying companies, saving you the time and effort of picking individual stocks. Key examples include:

    • Vanguard Dividend Appreciation ETF (VIG): Focuses on U.S. companies with a track record of consistently increasing their dividends, a strategy that targets dividend growth and quality.
    • Vanguard High Dividend Yield ETF (VYM): Tracks stocks that are forecasted to have above-average dividend yields, ideal for investors seeking higher current income.

    These products allow you to implement a sophisticated dividend strategy with a single transaction. To understand more about how these investment vehicles differ, you can learn about ETFs vs. mutual funds.

    Key Features and Practical Tips

    The ultra-low expense ratios of Vanguard's ETFs are a major benefit. For instance, VIG's expense ratio is often a small fraction of what actively managed funds charge, meaning your long-term returns are better protected from high management fees. Like other modern brokerages, Vanguard also offers a Dividend Reinvestment Plan (DRIP) to automatically put your payouts back to work.

    A practical tip for Vanguard users is to set up automatic investments directly into their chosen dividend ETF. By scheduling regular purchases alongside enabling DRIP, you can fully automate your dividend growth strategy, leveraging both dollar-cost averaging and the power of compounding with minimal ongoing effort.


    Platform Highlights

    Feature Details & Benefits
    Trading Costs $0 online commissions for stocks and ETFs.
    Account Minimums $0 to open an account; ETFs trade at their share price.
    Key Products Industry-leading low-cost dividend ETFs like VIG and VYM.
    Dividend Reinvestment Automatic DRIP available for eligible stocks and ETFs.

    Pros & Cons

    • Pro: Extremely low all-in costs, combining $0 trade commissions with rock-bottom ETF expense ratios.
    • Pro: Strong reputation for high-quality, dividend-focused ETFs that simplify portfolio building.
    • Pro: Ideal for passive, long-term investors seeking a simplified investment process.
    • Con: Brokerage research tools are functional but less advanced than some specialized competitors.
    • Con: Phone-placed trades for stocks and ETFs typically incur a commission.

    Find out more: https://investor.vanguard.com

    4. Seeking Alpha (Premium): The Analyst's Toolkit for Dividend Stocks

    For investors who prioritize in-depth analysis and quantitative data to find the best dividend paying stocks, Seeking Alpha's Premium service is an indispensable research platform. It goes beyond a standard brokerage, offering a powerful blend of proprietary analytics, expert contributor insights, and community discussion. The platform’s core value is its ability to provide clear, data-driven grades on dividend quality, helping investors avoid yield traps and identify sustainable income streams.

    While Seeking Alpha is not a brokerage, its research tools are designed to be used alongside one. A Premium subscription is required to access its most valuable features, but for serious dividend investors, the cost can be justified by the depth of information it unlocks.

    Why Seeking Alpha Excels for Dividend Investing

    Seeking Alpha’s proprietary Dividend Grades are its standout feature for income investors. Each dividend-paying stock is graded from A+ to F on four critical metrics, providing a quick yet comprehensive overview of its dividend health:

    • Dividend Safety: Assesses the risk of a dividend cut using over a dozen underlying financial metrics.
    • Dividend Growth: Evaluates the company’s track record and future potential for increasing its dividend.
    • Dividend Yield: Compares the stock's current yield to its historical average and sector peers.
    • Dividend Consistency: Measures how many consecutive years the company has paid a dividend.

    This grading system allows you to instantly gauge the quality of a dividend, a crucial first step in any due diligence process.

    Key Features and Practical Tips

    The platform’s "Top Quant Dividend Stocks" screener is a powerful, ready-made tool that is updated daily. It leverages Seeking Alpha's quantitative model to highlight stocks that score highly on dividend safety, growth, and other value metrics. This is an excellent starting point for generating new investment ideas.

    For practical application, focus on stocks with high Dividend Safety grades (B- or better) to minimize the risk of a payout reduction. Cross-reference the quantitative data with contributor articles on the same stock to get a well-rounded view, blending hard data with qualitative analysis from experienced investors. If you're new to this level of analysis, a guide to dividend investing for beginners can provide a solid foundation.


    Platform Highlights

    Feature Details & Benefits
    Dividend Grades A-F ratings on Safety, Growth, Yield, and Consistency for quick analysis.
    Screening Tools Pre-built "Top Quant Dividend Stocks" screener and customizable options.
    Contributor Analysis Access thousands of articles, including model portfolios from income investors.
    Quantitative Ratings Objective, data-driven ratings on value, growth, and profitability metrics.

    Pros & Cons

    • Pro: Unique Dividend Safety grades help investors avoid potential dividend cuts.
    • Pro: Combines quantitative data with a wide range of editorial analysis.
    • Pro: Active community and contributor base provide a constant flow of new ideas.
    • Con: Requires a paid Premium subscription to access the most valuable features.
    • Con: The quality and bias of contributor articles can vary significantly.

    Find out more: https://www.seekingalpha.com

    5. Morningstar Investor: The Independent Research Powerhouse

    For dividend investors who prioritize deep, independent analysis and data-driven decisions, Morningstar Investor is an indispensable resource. Rather than a traditional broker, it's a powerful research platform that provides the tools and insights necessary to vet the quality and sustainability of the best dividend paying stocks. Its core strength is its proprietary analyst ratings and extensive database, which help investors look beyond high yields to find truly durable income-producing companies.

    Morningstar is a subscription-based service, so access to its most powerful features requires a paid plan. This cost positions it as a premium tool for serious investors who are willing to pay for unbiased, high-quality research to inform their dividend investing strategy.

    Morningstar Investor

    Why Morningstar Investor Excels for Dividend Investing

    The platform's screeners are exceptionally well-suited for income-focused investors. You can build detailed screens to find dividend stocks based on Morningstar’s own proprietary metrics, which provides a unique edge. Key filtering criteria include:

    • Morningstar Rating for Stocks (Star Rating): Quickly identify stocks that Morningstar analysts believe are trading at a discount to their fair value.
    • Economic Moat Rating: Pinpoint companies with sustainable competitive advantages, a key indicator of long-term dividend safety.
    • Dividend Yield %: Filter for stocks that meet your specific income requirements.
    • Financial Health Grade: Assess the strength of a company's balance sheet to gauge its ability to sustain dividend payments.

    This combination of valuation, competitive advantage, and financial health metrics allows you to build a portfolio of high-quality dividend payers, not just high-yielders.

    Key Features and Practical Tips

    One of the most valuable features is the detailed analyst reports available for individual stocks. These reports provide a narrative overview of the company's dividend policy, payout ratio sustainability, and future growth prospects. For a dividend investor, this qualitative analysis is just as important as the quantitative data.

    To maximize the platform's utility, start by using the screener to generate a list of potential dividend stocks. Then, dive into the analyst reports for your top candidates, paying close attention to the sections on "Moat" and "Stewardship." Finally, use the Portfolio tool to track your holdings and receive updates on any changes to their ratings or fair value estimates.


    Platform Highlights

    Feature Details & Benefits
    Pricing Paid subscription required for premium features (Morningstar Investor).
    Core Offering In-depth, independent research, data, and analyst ratings.
    Screening Tools Advanced screeners with proprietary filters like Economic Moat and Star Rating.
    Portfolio Analysis "Portfolio X-Ray" tool helps analyze dividend income and diversification.

    Pros & Cons

    • Pro: Unbiased, third-party research helps validate dividend safety and valuation.
    • Pro: Proprietary metrics like the Economic Moat Rating are invaluable for quality screening.
    • Pro: Consolidated tools on a single platform streamline the research process.
    • Con: The best features are locked behind a paid subscription.
    • Con: It is a research tool, not a brokerage, so you cannot execute trades on the platform.

    Find out more: https://www.morningstar.com

    6. Dividend.com (Premium): The Specialist's Research Toolkit

    For investors who want to go beyond general brokerage screeners and dive deep into dividend-specific data, Dividend.com (Premium) is an indispensable specialized resource. Unlike a trading platform, its sole focus is providing curated lists, proprietary ratings, and advanced tools designed to help you find the best dividend paying stocks with greater efficiency. It’s a dedicated research hub built from the ground up for serious income investors.

    The platform's value proposition is its ability to save you countless hours of research. Instead of building complex screens from scratch, you gain immediate access to expertly curated lists, such as "Best Dividend Stocks by Sector," "Best Monthly Dividend Stocks," and lists based on dividend safety scores. This pre-filtered approach helps you quickly pinpoint high-quality candidates.

    Why Dividend.com Excels for Dividend Investing

    Dividend.com's strength lies in its proprietary DARS™ (Dividend Analytics & Ratings System) score. This rating simplifies the complex task of evaluating a dividend's quality by grading stocks on a scale from 1 to 5 based on five key pillars:

    • Relative Strength: How the stock has performed compared to its peers.
    • Overall Yield Attractiveness: Its yield versus similar securities.
    • Dividend Reliability: The consistency and history of its payouts.
    • Dividend Uptrend: The strength of its dividend growth over time.
    • Earnings Growth: The underlying financial health supporting future payouts.

    This scoring system provides a quick, yet comprehensive, snapshot of a dividend's sustainability and growth potential, allowing investors to make more informed decisions.

    Key Features and Practical Tips

    One of the most powerful tools is the Ex-Dividend Date Search, which allows you to find stocks that are about to pay a dividend within a specific timeframe. This is especially useful for dividend capture strategists or those looking to deploy new capital just before a payout. You can filter by date range, DARS™ rating, and sector to find timely opportunities.

    To maximize the platform, create a personalized watchlist of your current or potential holdings. Dividend.com will then send you email alerts for critical events like dividend announcements, increases, or ex-dividend dates. Also, regularly check the "Best Dividend Stocks" lists, as they are updated frequently to reflect new data and market changes.


    Platform Highlights

    Feature Details & Benefits
    Primary Function A dedicated research and analytics platform, not a brokerage.
    Access Requirements Core features and curated lists require a paid premium subscription.
    Key Tools DARS™ rating system, 'Best Of' lists, ex-dividend date calendar, and model portfolios.
    Data Export Allows users to download dividend data for further analysis in spreadsheets.

    Pros & Cons

    • Pro: Highly specialized, dividend-first layout saves significant research time.
    • Pro: Curated lists are excellent for discovering new investment ideas.
    • Pro: The DARS™ rating system simplifies the evaluation of dividend quality.
    • Con: The most valuable features are behind a premium paywall.
    • Con: It is a research-only tool; you cannot execute trades on the platform.

    Find out more: https://www.dividend.com

    7. Simply Safe Dividends: The Safety-First Research Tool

    For income investors whose primary goal is preserving capital and generating reliable payouts, Simply Safe Dividends offers a specialized research platform dedicated entirely to dividend safety. Unlike broad brokerage sites, its singular focus is on helping users find the best dividend paying stocks that are least likely to cut their distributions. This makes it an essential tool for conservative investors, retirees, and anyone who depends on their portfolio's income stream.

    The platform's core value proposition is its proprietary Dividend Safety Score, which analyzes a company's financial health to predict its ability to maintain and grow its dividend. This data-driven approach moves beyond simple yield metrics to provide a clear, actionable rating on the risk associated with each payout.

    Simply Safe Dividends

    Why Simply Safe Dividends Excels for Dividend Investing

    The entire platform is engineered to prevent the biggest pitfall of income investing: the dividend cut. While many tools can find high-yield stocks, Simply Safe Dividends excels at identifying sustainable ones. Its features are designed to answer crucial questions for income investors:

    • Dividend Safety Score: Rates stocks on a 0-100 scale, giving you an at-a-glance understanding of dividend risk.
    • Dividend Growth Score: Evaluates a company's potential to increase its dividend in the future.
    • Yield Score: Puts a stock's current yield into historical context to help identify if it's trading at an attractive valuation.
    • Portfolio Alerts: Instantly notifies you of any change in your holdings' dividend status, including cuts, raises, or shifts in safety scores.

    This laser focus on risk management helps you build a resilient portfolio designed to withstand market volatility and economic downturns.

    Key Features and Practical Tips

    The platform’s portfolio management tools are a key strength. After linking your brokerage account or manually entering your holdings, you can view your portfolio's overall dividend safety, projected annual income, and an upcoming dividend calendar. This income forecasting feature is invaluable for planning and budgeting.

    A practical tip for new users is to start by screening for stocks with a Dividend Safety Score of 60 or higher (considered safe or very safe). Then, use the detailed research notes and valuation charts provided for each company to analyze its long-term prospects before making a final decision. It's a research platform, not a brokerage, so you will still need a separate account (like Fidelity or Schwab) to place trades.


    Platform Highlights

    Feature Details & Benefits
    Pricing Subscription-based service; a free 14-day trial is available.
    Account Minimums N/A (this is a research platform, not a brokerage).
    Screening Tools Targeted screeners for stocks and CEFs based on dividend safety, growth, and yield.
    Key Offering Proprietary Dividend Safety, Growth, and Yield Scores for thousands of stocks.

    Pros & Cons

    • Pro: Unmatched focus on dividend safety and risk mitigation.
    • Pro: Clean interface and excellent portfolio tools for income planning.
    • Pro: Timely alerts on dividend changes protect investors from surprises.
    • Con: It is a research-only platform, requiring a separate brokerage for trading.
    • Con: Subscription cost is a consideration compared to free tools on brokerage sites.

    Find out more: https://simplysafedividends.com

    Top 7 Dividend Stock Research Tools Comparison

    Platform Implementation Complexity 🔄 Resource Requirements ⚡ Expected Outcomes 📊 Ideal Use Cases 💡 Key Advantages ⭐
    Fidelity Moderate – full brokerage with integrated tools Low – $0 commissions, no minimums Robust dividend investing with reinvestment Investors wanting brokerage + research in one Low costs, strong screeners, automatic DRIP
    Charles Schwab Low – straightforward DRIP setup and basic screeners Low – $0 commissions, simple interfaces Efficient dividend reinvestment and trading Cost-conscious investors seeking simplicity Clear pricing, easy DRIP, fractional reinvestment
    Vanguard Brokerage + ETFs Moderate – brokerage focused on ETFs Low – $0 online trades but some phone fees Low-cost dividend growth via ETFs Dividend growth ETF investors Very low fees, strong dividend ETF lineup
    Seeking Alpha (Premium) Moderate – research platform with advanced analytics High – premium subscription required In-depth dividend safety and idea generation Investors needing detailed dividend research Unique dividend safety grades, active community
    Morningstar Investor Moderate – research and screening tools High – paid subscription Validated dividend safety and valuation insights Investors seeking independent analysis Deep analyst reports and integrated tools
    Dividend.com (Premium) Low – research site, no trading Medium – premium subscription for full features Curated dividend rankings and income tracking Income-focused investors wanting curated lists Time-saving dividend-focused research
    Simply Safe Dividends Moderate – specialized research platform High – premium priced, research only Reliable dividend safety and risk analysis Safety-first dividend investors Proprietary safety scores, easy portfolio tools

    From Tools to Strategy: Building Your Dividend Investing System

    Navigating the world of dividend investing can feel overwhelming, but as we've explored, a powerful suite of tools is available to guide your journey. From the comprehensive brokerage platforms of Fidelity, Charles Schwab, and Vanguard to the deep-dive analytics of Seeking Alpha, Morningstar, Dividend.com, and Simply Safe Dividends, the resources to identify the best dividend paying stocks have never been more accessible. The challenge is not a lack of information, but rather transforming that information into a cohesive and effective strategy.

    The true takeaway is that no single tool is a magic bullet. Instead, the most successful investors build a personalized system, a workflow that leverages the unique strengths of different platforms to create a repeatable and reliable process for finding, vetting, and managing their dividend portfolio.

    Crafting Your Personal Dividend Workflow

    Think of these tools as specialized instruments in a workshop. You wouldn't use a hammer to cut a piece of wood, and you shouldn't rely on a brokerage screener for in-depth safety analysis. A robust workflow might look something like this:

    1. Idea Generation: Use a platform like Seeking Alpha's "Top Dividend Stocks" screener or a Vanguard Dividend ETF like VIG to generate an initial list of promising candidates. These tools are excellent for broad discovery based on key metrics like yield, growth, and sector.
    2. Qualitative & Safety Analysis: Once you have a shortlist, dive deeper. Use Morningstar's economic moat ratings to assess a company's long-term competitive advantages. Cross-reference your findings with Simply Safe Dividends' safety scores to rigorously stress-test the sustainability of the payout. This step is about moving beyond the numbers to understand the business itself.
    3. Valuation & Entry Point: A great company at a bad price can be a poor investment. Use the valuation metrics provided by platforms like Fidelity or Morningstar to determine if a stock is trading at a fair price. Setting price alerts within your brokerage account can help you execute with discipline rather than emotion.
    4. Execution & Monitoring: Finally, place your trades through a low-cost, full-service brokerage like Schwab or Fidelity. Once you own the stock, the work isn't over. Use tools like Dividend.com to track your portfolio's income and receive timely alerts on any changes to your holdings' dividend policies.

    This multi-step process ensures each investment is thoroughly vetted, building a portfolio based on conviction, not just a high starting yield. The goal is to create a system that is both effective and sustainable for your personal investing style and time commitment.

    Beyond the Platform: The Final Ingredient is Conviction

    Ultimately, the most critical element in your success is conviction. The best dividend paying stocks are often found in companies you understand deeply, allowing you to hold firm through inevitable market volatility. Tools provide the data, but conviction comes from understanding the story behind the numbers: the company's competitive edge, its management's philosophy, and its long-term growth prospects.

    This is where your system truly comes together. By combining powerful quantitative screening with deep qualitative research, you transition from being a passive collector of stocks to an active, informed owner of great businesses. This methodical approach is what builds a resilient, growing income stream capable of weathering economic storms and compounding your wealth for decades to come.


    Finding the data is the first step, but building true conviction requires a deeper narrative. Investogy provides just that, offering a transparent look into a real-money portfolio with detailed, long-form analysis that explains the why behind every investment decision. If you’re ready to move beyond screeners and build a portfolio based on deep understanding, explore the insights at Investogy.

  • Growth vs Value Stocks: Which Is Right for Your Portfolio?

    Growth vs Value Stocks: Which Is Right for Your Portfolio?

    When you get down to it, the whole growth vs. value stock debate boils down to one thing: growth stocks are companies you buy with the expectation they'll grow much faster than the overall market. Value stocks, on the other hand, are companies that look like they're trading for less than they're really worth.

    Deciding which camp to pitch your tent in comes down to your own financial situation—what are your goals, how much risk can you stomach, and how long do you plan to stay invested?

    Defining Growth and Value Stocks

    Investing can feel like standing at a fork in the road. One path is the high-speed, exhilarating lane of growth stocks. The other is the steady, more predictable road of value stocks. Getting a handle on what makes each one tick is the first real step to building an investment strategy that works for you. Both have made people plenty of money over the years, but they operate on completely different philosophies.

    Image

    What Are Growth Stocks?

    Growth stocks are shares in companies poised to expand at a clip that leaves the average market in the dust. You'll often find these businesses in disruptive, cutting-edge sectors like tech, biotech, or clean energy. Instead of sending profits back to shareholders as dividends, they pour that cash right back into the business to fuel even more growth.

    Understanding a growth stock means looking at the company's DNA and the specific strategies that fuel company expansion. When you buy a growth stock, you're making a bet on its future potential, banking on the idea that today's seemingly high price will look like a bargain when tomorrow's earnings roll in.

    What Are Value Stocks?

    Value stocks, by contrast, are companies that seem to be on sale, trading for less than their true intrinsic worth. These are typically the established, mature players in foundational industries—think consumer goods, banking, or utilities. Someone buying a value stock believes the market has overreacted to some short-term bad news or is just plain pessimistic, creating a buying opportunity.

    The game here is to scoop up these "undervalued" assets and wait. The hope is that the market eventually comes to its senses and recognizes their actual worth, causing the stock price to climb. On top of that, many value stocks pay out regular dividends, which can provide a nice, steady income stream while you wait.

    You can take a deeper look into these two competing mindsets by exploring the classic growth vs value investing debate.

    The core difference really comes down to what you're paying for. Growth investors pay a premium today for a piece of tomorrow's success. Value investors are looking for a discount on a company's current, real-world assets and earning power.

    To make this crystal clear, here’s a quick side-by-side look at what separates these two investment styles.

    Quick Comparison: Growth vs. Value Stocks

    This table gives you a snapshot of the key traits that define growth and value stocks. Think of it as a cheat sheet for spotting the difference in the wild.

    Characteristic Growth Stocks Value Stocks
    Primary Goal Capital appreciation from rapid growth Buying assets below their intrinsic value
    Typical P/E Ratio High (often > 25) Low (often < 15)
    Dividend Yield Low or none Moderate to high
    Risk Profile Higher volatility and risk Lower volatility, risk of "value trap"
    Company Age Younger, innovative companies Mature, established companies
    Example Sectors Technology, Biotechnology Utilities, Finance, Consumer Goods

    As you can see, they are almost mirror images of each other. The high-flying potential of growth is balanced by higher risk, while the stability of value is offset by potentially slower gains. Neither is inherently better—it's all about which one aligns with your personal investment strategy.

    Exploring Core Investment Philosophies

    Beyond the balance sheets and stock tickers, there’s a massive difference in mindset. The whole growth vs value stocks debate isn’t just about numbers; it’s a collision of two core investment philosophies. If you don't get a handle on these psychological frameworks, you'll struggle to build a portfolio that aligns with how you truly believe markets work.

    At its core, growth investing is pure optimism. It's a bet on innovation, on disruption, and on the power of one company to completely upend an industry. A growth investor looks at a company and asks, "What's the absolute best-case scenario here? What could this thing become?" They're perfectly fine paying a premium today for a piece of what they believe will be a much bigger, more dominant company down the road. This approach means accepting higher volatility—that’s just the price of admission for potentially explosive returns.

    Think about the early investors in Amazon or Tesla. They weren't buying shares based on current profits, which were often zero or negative. They were buying into a vision—the future of e-commerce or the dawn of electric transportation. This requires some serious conviction in a company’s leadership, its competitive moat, and its raw ability to own a growing market.

    Image

    The Value Investor's Mindset

    On the flip side, value investing is all about pragmatism and a healthy dose of skepticism. Championed by legends like Benjamin Graham, this strategy is less about predicting the future and more about nailing down the present. A value investor's first question is always, "What is this company really worth right now, and can I get it for less?"

    Their entire game is to find solid businesses that the market has either ignored or unfairly beaten down. Maybe it was a disappointing earnings report, some negative industry buzz, or just a widespread market panic. The value investor operates with a critical tool: the margin of safety. This is simply the gap between a company's real, intrinsic value and its current stock price.

    "The intelligent investor is a realist who sells to optimists and buys from pessimists." – Benjamin Graham

    This quote from Graham nails the value mindset perfectly. It’s about being disciplined, incredibly patient, and often going against the crowd. While growth investors are chasing momentum, value investors are hunting for bargains. They’re confident that a quality business will eventually have its true worth recognized by the market. A company like Procter & Gamble, with its long history of steady profits and dividends, is a classic name that attracts value investors during market dips. They don't see a dying giant; they see a reliable workhorse on sale.

    Contrasting Worldviews in Action

    To really see the difference, just imagine how each investor might react to the same piece of economic news.

    • A report on rapid technological advancement: The growth investor sees this as confirmation that their innovative tech stocks are on the right path, maybe even buying more. The value investor, however, might get a little nervous, seeing this as a potential threat to the stable, established companies they prefer.
    • A sudden market downturn: The value investor might see this as a Black Friday sale—a golden opportunity to scoop up great companies at a discount. The growth investor will feel the pain much more directly, as their high-flying stocks often get hammered the hardest, forcing them to gut-check their most passionate bets.

    Ultimately, choosing your path isn't just about financial metrics. It's about deciding which worldview fits your personality. Are you an optimist betting on what's next, or a pragmatist looking for hidden value today? Neither approach is inherently better, but understanding what makes them tick is the first step to building a strategy you can stick with.

    Analyzing Historical Performance in Market Cycles

    The tug-of-war between growth and value isn't just a textbook theory; it plays out in real-time across the market, dictated by the broader economic climate. Market leadership is never permanent. Instead, it moves in waves, with each style getting its time in the sun depending on factors like interest rates, inflation, and overall economic growth.

    Getting a handle on these historical patterns is crucial for positioning your portfolio. If you stubbornly stick to one style, you risk getting left in the dust when the market tide turns. A more flexible, or even a blended, approach lets you adapt as different economic cycles give one style an edge over the other.

    Image

    The Dot-Com Boom and Bust

    The late 1990s are the poster child for a growth-crazed era. During the dot-com boom, the hype around tech and the internet reached a full-blown mania. Companies with a ".com" attached to their name, even those with zero revenue, saw their stock prices rocket to the moon based purely on future potential.

    Investors were tripping over themselves to pay insane premiums for the promise of explosive expansion, pushing growth stock valuations to levels we'd never seen before. Meanwhile, value stocks—the so-called "old economy"—were largely ignored because they just couldn't compete with the exciting stories of the new digital age.

    But the party came to a screeching halt when the bubble burst in the early 2000s. As speculative tech companies imploded, investors ran for cover, scrambling back to the safety of businesses with real, tangible assets and predictable earnings. This dramatic reversal kicked off a fantastic run for value stocks, which led the market for most of the next decade.

    The Post-2008 Recovery and Tech Dominance

    The 2008 financial crisis flipped the script once again. In its aftermath, central banks worldwide hammered interest rates down to near-zero and fired up the money printers with quantitative easing to jolt the economy back to life. This period of "cheap money" created the perfect storm for growth stocks to take off again.

    With borrowing costs at rock bottom, fast-growing companies, especially in the tech sector, could fund their ambitious expansion plans for next to nothing. Starved for decent returns in a low-yield world, investors were more than willing to pay up for the potential of massive gains from these innovative firms. This set the stage for a decade-plus run where growth stocks absolutely dominated the market.

    The performance of growth versus value stocks is notably cyclical, reflecting macroeconomic trends and investor preferences. During the 1990s dot-com boom, growth stocks dramatically outperformed. Conversely, from 2001 to 2008—a period marked by recovery from the dot-com bust and a focus on corporate fundamentals—value stocks led the market. The 2008–2021 era saw a resurgence of growth stocks, particularly large-cap technology firms benefitting from quantitative easing and abundant capital. You can explore a detailed breakdown of these market cycles to see the data for yourself.

    Recent Shifts and Macroeconomic Factors

    The ground has shifted again in the last few years. The sudden spike in inflation and the aggressive interest rate hikes from central banks have completely changed the game for investors. When rates go up, future earnings become less valuable in today's dollars. This hurts growth stocks the most, since their sky-high valuations are built on the promise of profits way down the road.

    This new reality has brought value stocks back into the spotlight. Sectors like energy and financials, which often do well with inflation and higher rates, have seen a lot of new money come their way. When capital is no longer cheap, their steady cash flows and more reasonable valuations start looking a lot more appealing.

    It's critical to understand how these big-picture economic forces tilt the playing field:

    • Low-Interest Rates: This is generally rocket fuel for growth stocks. It makes financing expansion cheap and boosts the present value of all those future earnings.
    • High Inflation & Rising Rates: This environment often benefits value stocks. Companies with solid current cash flows and the ability to raise prices (think consumer staples) can weather inflationary storms much better.
    • Strong Economic Growth: A rising tide can lift both boats, but it often gives an edge to growth stocks as an expanding economy creates new markets and opportunities for innovation.
    • Economic Uncertainty or Recession: In scary times, investors tend to favor value stocks. The perceived safety of stable, dividend-paying companies becomes much more attractive than speculative growth names.

    The bottom line is that neither style is always better. Market leadership runs in cycles, and last decade's winner could easily be this decade's laggard. This history lesson makes one thing clear: you have to pay attention to the broader economic picture when weighing growth vs. value.

    Using Key Metrics to Identify Stocks

    So, how do we move from the high-level philosophy of "growth" or "value" to actually picking stocks? It all comes down to the numbers.

    Distinguishing between these two types of companies isn't guesswork; it's about learning to read the story a company’s financials are telling. Once you know which numbers to look at, you can start sifting through the market to find opportunities that fit your strategy.

    For growth investors, the key indicators will point to rapid expansion and massive future potential. For value investors, the numbers need to show a solid, established business that’s currently on sale.

    Metrics That Signal High Growth Potential

    When you're looking at a growth stock, traditional valuation methods can be downright misleading. You’re not buying the company for what it is today; you’re betting on what you believe it will become. The metrics have to reflect that forward-looking view.

    A high Price-to-Earnings (P/E) ratio is often the most obvious tell-tale sign. A value investor might see a P/E of 50 and run for the hills, but a growth investor sees it as the market's stamp of approval—a vote of confidence in explosive future earnings. To really get a handle on this critical metric, you can check out our deep dive on understanding the Price-to-Earnings ratio.

    But the P/E ratio is just the beginning. You'll also want to look for:

    • Strong Revenue Growth: This one is non-negotiable. A real growth company has to be consistently boosting its sales at a fast clip, typically 15-20% or more year-over-year. It’s the clearest sign that its products or services are catching on.
    • High Return on Equity (ROE): ROE tells you how efficiently a company is using shareholder money to make a profit. A consistently high ROE (think above 15%) is a good sign that you've got a strong management team and a real competitive advantage.

    The big idea with growth metrics is to find proof that a company isn't just growing, but is also smart about how it reinvests its money to keep that growth engine running. Strong margins and a growing slice of the market are qualitative signs that usually back up these hard numbers.

    Metrics That Uncover Hidden Value

    Value investing is basically a treasure hunt for bargains. The metrics here are all about finding financially solid companies that are trading for less than they're truly worth. Unlike the optimism of growth investing, this approach is firmly rooted in today's financial health and tangible assets.

    The classic value metric is a low Price-to-Book (P/B) ratio. This number compares the company's stock price to its "book value"—what would be left over if the company sold everything and paid off all its debts. A P/B ratio under 1.5 can be a strong signal that you’re paying a fair price, or maybe even getting a discount on the company's net assets.

    Other key indicators for value hunters include:

    • Attractive Dividend Yield: A steady dividend is often the mark of a stable, mature company with reliable cash flow. A yield that’s higher than the market average (say, over 3%) pays you to wait for the rest of the market to catch on to the stock's real value.
    • Consistent Free Cash Flow (FCF): This is the actual cash a company has left after paying for its day-to-day operations and investments. Strong, predictable FCF is proof of financial strength—the kind that lets a company pay dividends, pay down debt, and ride out economic storms.

    The infographic below shows that despite their different DNA, both growth and value stocks have a history of delivering for investors.

    Image

    As you can see, growth stocks have had a slight edge over the past decade, but both have performed well against the broader S&P 500.

    Valuation Metrics Growth vs Value Stocks

    To make sense of the growth vs value stocks debate, it helps to see the ideal metrics lined up side-by-side. Think of this table as a quick cheat sheet for what "good" looks like for each strategy. It's a great starting point for your own analysis.

    Metric Growth Stocks (What to Look For) Value Stocks (What to Look For)
    P/E Ratio High (often >25-30), reflects future earnings expectations. Low (often <15), suggests the stock may be undervalued relative to current earnings.
    Revenue Growth (YoY) Consistently high (ideally >15-20%). Stable or modest growth, often in the single digits.
    P/B Ratio Can be high, as intangible assets (like brand) aren't fully captured. Low (ideally <1.5), indicating the price is close to the company's net asset value.
    Dividend Yield Typically low or 0%, as profits are reinvested for growth. Moderate to high (often >3%), providing income to shareholders.
    Return on Equity (ROE) High and often increasing (ideally >15%). Consistently positive and stable, but not necessarily spectacular.
    Free Cash Flow (FCF) May be inconsistent or negative due to heavy investment in growth. Strong, stable, and predictable.

    Ultimately, these metrics are just tools. A high P/E doesn't guarantee a stock will soar, and a low P/B doesn't mean it's a sure-fire bargain. The real skill is using these numbers to build a story and make an informed decision that aligns with your personal investment goals.

    Navigating Different Risk and Volatility Profiles

    Every single investment you make comes with risk, but the kind of risk you're taking on is where growth and value stocks really part ways. If you don't get this part right, you can torpedo your portfolio without even seeing it coming. These two styles don't just act differently when the market's hot; they have completely unique reactions to economic stress, scary headlines, and sudden market shocks.

    Growth stocks are, by their very nature, more volatile. It’s just part of the deal. Their valuations are often stretched to the limit, priced for a perfect future of explosive earnings and total market domination. This optimism makes them incredibly fragile. One bad earnings report or a hint of a change in interest rates can send them tumbling. When the market gets nervous, these high-flyers are usually the first ones investors dump as they scramble for safety.

    That heart-stopping volatility is the price you pay for a shot at those massive returns. If you've got a long time until retirement and a strong stomach, these brutal downturns can actually be fantastic buying opportunities. But if you’re closer to cashing out or just can't handle the rollercoaster, the wild swings of growth stocks can be pure torture.

    The Hidden Dangers of Value Stocks

    On the other side of the coin, value stocks are generally seen as the more defensive play. Their prices are already tethered to reality—tied to current earnings and hard assets—which can act as a shock absorber when the market tanks. Plus, they often pay dividends, giving you a steady little income stream to help smooth out any price bumps.

    But don't get complacent. Value investing has its own sneaky, dangerous pitfall: the value trap. This is when a stock looks dirt cheap for a terrifyingly good reason: the business is dying. What you think is a bargain is actually a company that's lost its mojo, is getting crushed by competitors, or just completely missed the boat on industry changes.

    To spot a value trap, you have to look past a simple low P/E ratio. Keep an eye out for these warning signs:

    • Persistently declining revenues: If a company can't sell more stuff year after year, that's a huge red flag.
    • Eroding profit margins: This screams that they're either in a price war they can't win or their product is no longer special.
    • Mounting debt: A mountain of debt can easily crush a business that's already struggling to stay afloat.

    A cheap stock can always get cheaper. The key to avoiding a value trap is distinguishing between a temporarily out-of-favor company and one with permanently broken fundamentals.

    Historical Volatility in Action

    History gives us a crystal-clear picture of these different risk profiles. The dot-com bust back in the early 2000s was a textbook case of growth stock volatility. The whole sector got annihilated while value stocks did much better. To put some numbers on it, growth stocks fell -22.08% in 2000 and another -12.73% in 2001. During that same period, value stocks actually returned +6.08% and then a more modest -11.71%.

    Fast forward to the 2008 financial crisis, and pretty much everything got hammered. But the 2022 market correction again showed the split, with growth stocks plunging -29.41% compared to a much more manageable -5.22% drop for value. You can see more data on these cyclical performance shifts and explore how economic contexts shape these risk profiles.

    This data isn't just academic; it has real consequences for your brokerage account. The "safer" bet depends entirely on what’s happening in the broader economy at that moment.

    Ultimately, handling these different risks comes down to being honest with yourself as an investor and doing your homework on every company you buy. Accept that growth stocks are going to test your nerves with volatility. And always, always ask why a value stock looks so cheap. Getting that balance right is the secret to building a portfolio that can actually last.

    Building a Portfolio for Your Financial Goals

    The whole "growth vs. value" debate completely misses the point. Winning at investing isn't about picking a side. It’s about building a portfolio that actually lines up with your financial goals, your timeline, and what you can stomach in terms of risk. There's no such thing as a one-size-fits-all strategy.

    Your own life circumstances are the only playbook you need. Think about it: an investor in their 20s has a 40-year runway before retirement. They can afford to get aggressive with growth stocks, riding out the inevitable market swings for a shot at much higher returns down the road.

    On the flip side, someone getting close to retirement has a totally different set of priorities. They're thinking about protecting what they've built and generating income. For them, loading up on stable, dividend-paying value stocks is the smarter play. That steady cash flow can supplement their income, and the lower volatility helps them sleep at night, knowing their nest egg is better shielded from nasty market drops.

    Crafting a Blended Approach

    A truly tough portfolio usually lives somewhere in the middle. One of the most popular hybrid strategies is something called Growth at a Reasonable Price (GARP). GARP investors are treasure hunters, looking for companies with real growth potential that aren't yet slapped with the crazy-high price tags of pure growth stocks. They’re trying to get the best of both worlds—upside without taking on insane risk.

    If you'd rather not spend your weekends picking individual stocks, exchange-traded funds (ETFs) are your best friend. They offer instant diversification. You can easily buy a broad-market growth ETF (like VUG) or a value ETF (like VTV) and get exposure to hundreds of different stocks in one shot. It takes the pressure off and simplifies the whole process. For a deeper dive, check out our guide on how to diversify your investment portfolio.

    Here's the key takeaway: don't think of growth and value as opposing teams. See them as different tools in your financial toolkit. A well-built portfolio uses both to strike the right balance between risk and reward as the market moves through its cycles.

    Balancing Performance Expectations

    History is pretty clear: market leadership flips back and forth. Neither style stays on top forever. Looking back over the last two decades, the performance race between growth and value has been surprisingly close. In fact, value stocks have actually beaten growth stocks in about 46% of months during that time.

    But here's the interesting part: when growth stocks did take the lead, they tended to win by a slightly bigger margin. They outperformed by an average of 2.5 percentage points a month, compared to value's 2.3 point lead when it was on top. You can dig into more of this long-term performance data over at Morningstar.

    At the end of the day, your strategy needs to evolve right along with you. Make it a habit to review your portfolio. Make sure your allocation still makes sense for your age, your financial picture, and your long-term goals. What's perfect for you today might be completely wrong a decade from now.

    Common Questions About Growth vs. Value

    Even after you've got the basics down, the growth versus value debate can still throw some curveballs. Let's tackle a few of the most common questions that pop up when investors are trying to figure this all out.

    So, Which One Is Actually Better: Growth or Value?

    There's no single "best" answer here—it really depends on what the market is doing and what you're trying to accomplish. The leadership between growth and value has swung back and forth for decades.

    Historically, growth stocks have tended to rip higher during periods of low interest rates and a booming economy. On the flip side, value stocks often find their footing and shine when the economy gets a little shaky or interest rates start climbing.

    The smartest move for most people isn't to bet the farm on one or the other. A blended approach, holding a bit of both, usually builds a more durable portfolio that can handle whatever the economy throws at it.

    How Can I Get Started in Each Style?

    Dipping your toes in is easier than ever, thanks to Exchange-Traded Funds (ETFs) and mutual funds. These funds give you instant access to a whole basket of stocks, so you don't have to stress about picking individual winners and losers.

    • For Growth Investing: You can look at ETFs that mirror growth indexes. Good starting points are the Vanguard Growth ETF (VUG) or the Invesco QQQ Trust (QQQ), which is packed with big tech names.
    • For Value Investing: Check out funds like the Vanguard Value ETF (VTV) or the iShares Russell 1000 Value ETF (IWD). These focus specifically on companies trading at lower valuations.

    Key Takeaway: For most investors, the simplest on-ramp is through these style-specific ETFs. They're a low-cost, diversified way to add growth or value exposure to your portfolio without needing to do a ton of homework on individual companies.

    Can a Stock Be Both a Growth and a Value Play?

    Absolutely. There's a whole category of stocks that sit right in the middle, often called Growth at a Reasonable Price (GARP).

    GARP investors are on the hunt for companies with solid earnings growth that haven't been bid up to the sky-high prices of your typical pure growth darlings. It's about finding that sweet spot.

    Think of a company like Microsoft in recent years. It's putting up huge growth numbers in its cloud and software businesses, but its sheer size and profitability sometimes mean it trades at a more sensible valuation compared to smaller, hotter tech stocks. Finding these GARP gems takes a bit more digging, blending the best of both worlds.


    At Investogy, we don't just talk about this stuff—we put our money where our mouth is. We share the real-world research behind our public, real-money portfolio. Subscribe to our free weekly newsletter to see exactly how we navigate the growth vs. value debate with our own capital. Join for free at Investogy.

  • Dividend Investing for Beginners: Start Building Wealth Today

    Dividend Investing for Beginners: Start Building Wealth Today

    At its heart, dividend investing is simply buying stocks in companies that regularly share their profits directly with you, the shareholder. Think of it as getting paid just for owning a small piece of a successful business. It's a straightforward path for beginners to start generating passive income and build real, long-term wealth.

    What Is Dividend Investing and How Does It Really Work?

    Image

    Let's say you invested in a wildly popular local coffee shop. Business is booming, and at the end of every quarter, the owners decide to distribute a portion of the profits to everyone who helped fund it. That check you get in the mail? That's a dividend.

    Dividend investing takes that exact same idea and applies it to big, publicly-traded companies on the stock market.

    When you buy a dividend stock, you're not just buying a ticker symbol—you're becoming a part-owner of that business. As the company makes money, its board of directors can decide to return some of those earnings back to shareholders like you. These payments usually arrive every quarter, giving you a predictable stream of income.

    This approach gives you two powerful ways to grow your money:

    • Capital Appreciation: The value of the shares themselves can climb over time as the company succeeds and expands.
    • Dividend Income: You get regular cash payments, which you can either spend or, even better, reinvest to buy more shares and create a compounding effect.

    The Power of Dividends in Total Returns

    Watching a stock’s price shoot up is always exciting, but it’s only half the story. The steady cash payments from dividends play a huge role in an investor's total return over the long haul. They act as a consistent reward for your patience, no matter what the market is doing day-to-day.

    Historically, dividends have been a massive engine of wealth creation in the stock market. Since 1926, dividends have accounted for roughly 31% of the total return of the S&P 500.

    Let that sink in. Nearly one-third of all the wealth the U.S. stock market has generated for almost a century came directly from these shareholder payments and the magic of reinvesting them. You can explore the full research on the long-term impact of dividends to see just how significant this is.

    Understanding the Basic Terms

    Getting started with dividend investing as a beginner doesn't require a Ph.D. in finance or memorizing a bunch of Wall Street jargon. You really only need to get a handle on a few key terms.

    To make things easier, here's a quick-reference table with the essential vocabulary you'll come across.

    Key Dividend Investing Terms for Beginners

    Term Simple Explanation Why It Matters
    Dividend A cash payment from a company's profits to its shareholders. This is the direct income you receive for owning the stock.
    Dividend Yield The annual dividend per share divided by the stock's current price, shown as a percentage. It tells you the return you're getting from dividends alone, relative to what you paid for the stock.
    Payout Schedule How often dividend payments are made, which is most often quarterly (four times a year). This determines when you'll see that cash hit your account.
    Payout Ratio The percentage of a company's earnings that it pays out as dividends. A lower ratio (e.g., under 60%) often suggests the dividend is safer and the company is keeping enough cash to fuel future growth.

    Getting familiar with these four terms is your first big step. It will give you the foundation you need to start analyzing dividend stocks and making informed decisions for your portfolio.

    The Real Power of a Dividend Portfolio

    Getting a cash payment from a stock is nice, but it's not the whole story. Not by a long shot. Building a dividend portfolio unlocks two game-changing advantages that can seriously accelerate your wealth-building journey, especially when you're just starting out.

    The real magic happens when you put those dividends right back to work through compounding. It's a simple idea with powerful results. When you reinvest your dividends—which you can often do automatically with a Dividend Reinvestment Plan, or DRIP—you buy more shares of the company. Those new shares then kick off their own dividends. It’s a wealth-building snowball that starts small but can grow into a massive nest egg over time.

    A Financial Cushion in Choppy Waters

    Let's be real: the stock market has its bad days. Seeing your portfolio value drop during a downturn is tough, and it can pressure even experienced investors into making bad decisions. This is where a solid dividend strategy really shines, acting as a crucial buffer when the market gets volatile.

    While other investors are just watching their account balances shrink, you’re still collecting regular cash payments. That steady income provides a huge psychological and financial boost.

    History shows this isn't just a theory. In bull markets, the S&P 500's price has climbed by about 19% annually on average, with dividends adding another 5% on top. But in bear markets, when prices fell by an average of -15% a year, dividends provided a positive return of around 3%. This consistent cash flow helps offset some of the paper losses and makes the ride a lot less bumpy.

    A Signal of Company Health

    Think about it from a business owner's perspective. A company that not only pays a dividend but consistently increases it is sending a powerful signal to the market.

    A reliable dividend isn't just a payment; it's a vote of confidence from the company's management in its own future. It signals financial stability, disciplined leadership, and a commitment to rewarding shareholders.

    For beginners, this acts as a fantastic quality filter. It naturally steers you toward mature, profitable companies with a proven track record of success. Over the long haul, this stability is a cornerstone for building lasting wealth and is a key part of most plans for how to generate income in retirement.

    When you combine the explosive power of compounding with the reliability of established, dividend-paying companies, you're building a portfolio designed to work for you through thick and thin.

    How to Spot Great Dividend Stocks

    Image

    Alright, let's move from theory to action. This is where you learn to separate the truly solid dividend payers from the ones that just look good on paper but might be hiding some serious risks.

    Finding great dividend stocks isn't about chasing the flashiest, highest numbers. It's about becoming a bit of a detective, identifying healthy, durable companies that can consistently reward you for being a shareholder, year after year. Honestly, this skill is the heart and soul of successful dividend investing.

    Think of it like inspecting a house before you buy it. You wouldn't just look at the fresh coat of paint; you'd check the foundation. For a company, that foundation is its financial health. Two of the most critical metrics to get comfortable with are the dividend yield and the payout ratio.

    A healthy dividend yield means you're getting a decent return, but a sky-high yield can actually be a red flag. The payout ratio shows you how much of the company’s profit is being sent out to shareholders. A reasonable number here tells you the company isn't stretching itself too thin and still has cash left over to grow the business.

    Look for Signs of Sustainability and Growth

    Beyond those initial numbers, you're looking for a track record. You want to see a history of reliability and, ideally, a commitment to giving shareholders a raise over time. When a company manages to increase its dividend year after year, it's sending a powerful signal about its financial strength and its confidence in the future.

    This is where you'll hear about a couple of pretty exclusive clubs:

    • Dividend Aristocrats: These are big-name S&P 500 companies that have hiked their dividend for at least 25 consecutive years. We're talking about mature, stable businesses that have built massive competitive moats around themselves.
    • Dividend Kings: This group is even more elite. To be a King, a company must have increased its dividend for an incredible 50+ years straight.

    Using these lists as a starting point for your research is a great shortcut. It immediately narrows the massive world of stocks down to some of the most dependable payers out there.

    A history of dividend growth isn't just a track record; it's a powerful signal. It tells you that a company has successfully navigated decades of economic ups and downs while still prioritizing its shareholders.

    And this focus on dividend growth is becoming more important than ever. After a lot of companies hit the brakes during the pandemic, we're seeing some real momentum building again. For the past two decades, global dividends grew at a respectable 5.6% annual rate. But now, some forecasts are predicting that to jump to around 7.6% annually.

    Why the optimism? A big part of it is that payout ratios are near 25-year lows, which means companies have a lot of wiggle room to boost their payments to shareholders. You can dig into the analysis on the future of dividend growth if you want to see the data for yourself.

    Beginner's Checklist for Evaluating a Dividend Stock

    So you've found a stock that looks promising. Now what? It's time to do a little digging. You don't need to be a Wall Street analyst, and you can find all this information for free on sites like Yahoo Finance or right within your brokerage's app.

    This checklist is your simple, go-to guide for a quick health check on any dividend stock you're considering. It helps you look past the hype and focus on what really matters for long-term success.

    Metric to Check What to Look For Red Flag to Avoid
    Dividend Yield A reasonable and sustainable yield, often between 2% and 5%. An unusually high yield (over 7-8%) that might signal risk.
    Payout Ratio A ratio below 60-65% for most companies (REITs are an exception). A ratio over 80% or a negative ratio, suggesting the dividend may be unaffordable.
    Dividend History A consistent record of paying and, ideally, increasing dividends for 5+ years. A history of recent dividend cuts or inconsistent payments.
    Revenue & Earnings Growth Steady and predictable growth in sales and profits over several years. Declining revenue or erratic earnings that threaten future dividend payments.

    Running a company through this quick analysis gives you a much clearer picture of its stability. If a stock checks these boxes, you're likely looking at a much more reliable investment than one with a flashy yield but a shaky foundation.

    Choosing Your Dividend Investing Strategy

    Once you’ve got a handle on how to spot a solid company, it’s time to decide on your game plan. Not all dividend investing is cut from the same cloth. Just like there are different ways to train for a marathon, there are different strategies for building a dividend portfolio, each wired for different goals and timelines.

    For beginners, two paths tend to stand out: dividend growth investing and high-yield investing. The one you pick will seriously shape how your income stream builds up over the years.

    The Patient Grower: Dividend Growth Investing

    Think of dividend growth investing like planting a small fruit tree. The first few years, your harvest might be pretty modest. But if you stick with it, that little sapling grows into a mighty tree, churning out more and more fruit every single season. This strategy is all about finding companies with a proven track record of increasing their dividend payments year after year.

    The main goal here isn't to get the biggest paycheck today. Instead, you’re playing the long game, prioritizing future income growth. You're putting your money into healthy, stable companies so confident in their future that they consistently give their shareholders a raise.

    The real magic of this strategy is its compounding momentum. A 3% yield from a stock that bumps its dividend by 10% each year will eventually produce far more income than a stagnant 6% yield.

    The Immediate Harvester: High-Yield Investing

    The other approach is high-yield dividend investing. This is more like buying a fully-grown orchard that's already pumping out a massive amount of fruit. The goal is simple: maximize your current income by snapping up stocks with the highest possible dividend yields right now.

    This can be incredibly tempting, especially if you want immediate cash flow. But this path demands a lot more caution. An unusually high yield can sometimes be a red flag—what investors call a "yield trap"—signaling that the market thinks the company is in hot water and might have to slash its dividend.

    While both strategies have their place, many long-term investors find that a focus on growth just makes more sense for their goals. To get a better feel for where these ideas fit into the bigger market picture, you can check out the key differences between growth vs. value investing in our detailed guide.

    The infographic below shows just how much reinvesting and growth can supercharge a starting dividend yield over time.

    Image

    This really drives home the point that your initial yield is just the starting line. The real power is unlocked by how often you reinvest those payouts and how much the company grows its dividend.

    Ultimately, the best strategy for your dividend journey comes down to your own financial situation. Are you building an income stream for a retirement that's 20 years away, or do you need to juice your cash flow today? Answering that question is the first step to choosing the right path for you.

    Taking Your First Steps in Dividend Investing

    Image

    Alright, theory is one thing, but putting your money to work is where the magic happens. Let's walk through how you can go from just reading about dividend investing to actually becoming a dividend investor. We'll break it down into simple, actionable steps to get you on the path to building your own passive income engine.

    First things first, your investments need a place to live. That place is called a brokerage account. Think of it as a special bank account built specifically to hold your stocks, ETFs, and other assets.

    These days, there are plenty of great online brokers with easy-to-use platforms, and many of them have gotten rid of commission fees for stock trades.

    Key Takeaway: When you're picking a broker, make sure it offers a Dividend Reinvestment Plan (DRIP). This is a game-changer. A DRIP automatically takes the dividends you earn and uses them to buy more shares of that same stock, putting your compounding on autopilot.

    Your Simple Startup Checklist

    Getting started often feels like the biggest hurdle, but it's really just a series of small, manageable tasks. The trick is to just take it one step at a time. This simple checklist will help you push past that initial inertia that stops so many people cold.

    If you want a more detailed look at the whole process of setting up an investment account, our guide on how to start investing is a great resource.

    Here’s your plan to get moving:

    1. Pick and Open Your Brokerage Account: Look into beginner-friendly online brokers like Fidelity, Charles Schwab, or Vanguard. You're looking for low fees, a solid mobile app, and, of course, a DRIP option. The sign-up process is almost always done online and only takes a few minutes.

    2. Fund Your Account: Next, you'll link your regular bank account and transfer over the money you want to start with. And remember, you don't need a fortune to get in the game. Starting with a manageable amount, even just $100 or $500, is a fantastic way to learn the ropes and build momentum.

    3. Place Your First Trade: With money in your account, you’re ready for the exciting part—buying your first dividend-paying stock or ETF. Just search for the stock's ticker symbol, type in how much you want to invest, and hit the "buy" button.

    That's it! You're officially a dividend investor. That first trade is the most important one you'll ever make because it gets the ball rolling. From here, the goal is to keep adding funds regularly and slowly build a diversified portfolio that works for you.

    Common Dividend Investing Mistakes to Avoid

    Knowing what not to do is often just as important as knowing what to do, especially when you're starting out with dividend investing. While it's a pretty straightforward strategy on the surface, a few common mistakes can easily trip you up.

    Steering clear of these classic blunders is your first line of defense in building a dividend portfolio that lasts.

    The Siren Song of Sky-High Yields

    One of the most tempting traps for new investors is chasing dangerously high yields. It’s easy to get wide-eyed when you see a stock with a 10% dividend yield—it looks incredible on paper, but it’s often a massive red flag. This is what experienced investors call a "yield trap."

    An unusually high yield doesn't just appear out of nowhere. It usually means the market has lost all confidence in the company, causing the stock price to plummet. A sky-high yield is often a warning sign that a dividend cut is just around the corner, which could leave you with both a smaller income stream and a loss on your initial investment.

    Forgetting About Diversification and Company Health

    Another critical mistake is putting all your eggs in one basket. I've seen it happen time and time again: an investor gets excited and plows all their cash into one or two high-paying stocks. This exposes you to an incredible amount of risk. If just one of those companies hits a rough patch, your entire dividend income could evaporate overnight.

    A single stock is not a portfolio. True resilience comes from spreading your investments across various companies and sectors, ensuring that a problem in one area doesn't sink your entire ship.

    This is exactly why proper diversification is non-negotiable for any long-term success. If you want to build a more robust foundation for your investments, you should spend some time learning how to diversify an investment portfolio the right way.

    Finally, a lot of beginners get so focused on the dividend payout that they completely ignore the company’s underlying financial health. A dividend is only as safe as the business that pays it. It's not free money; it's a share of the company's profits.

    Before you even think about investing, ask yourself a few simple questions:

    • Is this company actually making money consistently?
    • Is its revenue growing, or is it shrinking?
    • How much debt is it carrying? Is it manageable?

    A strong, healthy business has the muscle to sustain and even grow its dividend through thick and thin. A weak one, on the other hand, will eventually be forced to cut its payout, leaving a trail of disappointed investors in its wake.

    Of course. Here is the rewritten section, crafted to sound completely human-written and natural, following all your provided instructions and examples.


    Your Top Dividend Investing Questions, Answered

    As you start digging into dividend investing, it's natural for a few questions to pop up again and again. Let's tackle them head-on so you can get past any uncertainty and start building your portfolio with confidence.

    How Much Money Do I Really Need to Start?

    This is easily the most common question, and the answer is probably not as much as you think. Forget the old days of needing a huge pile of cash to get in the game. With commission-free trading and fractional shares now widely available, you can honestly get started with $100 or even less.

    What matters isn't the starting amount. It's the habit. Consistently putting money to work, even small amounts, is what builds real wealth over time.

    Are Dividends Actually Guaranteed?

    Nope, and it's critical to understand this: dividends are not guaranteed. A company's board of directors has the final say. They can decide to raise, lower, or even suspend the dividend entirely based on how the business is doing or where they want to focus their cash.

    This is exactly why we hunt for financially solid companies—the ones with a long, proven history of not just paying, but growing their dividends year after year.

    A strong track record doesn't guarantee future payments, but it's a powerful indicator of a company's commitment to rewarding its shareholders. It signals stability and financial discipline.

    Should I Just Chase the Highest Yields I Can Find?

    While it’s incredibly tempting, fixating only on the highest-yielding stocks is a classic beginner's mistake. An abnormally high yield often acts as a warning flare, what we call a "yield trap." It could mean the company is in serious financial trouble and the market expects that juicy dividend to get slashed.

    A much safer and more successful path for the long haul is to focus on sustainable yields from healthy, proven companies. It's a balanced approach that pays off.


    Ready to see how these principles work with a real-money portfolio? The Investogy newsletter shares the exact "why" behind every buy and sell decision, helping you build conviction in your own strategy. Subscribe for free at Investogy.