Category: Articles

  • 7 Proven Bear Market Investing Strategies for 2025

    7 Proven Bear Market Investing Strategies for 2025

    A bear market, officially a decline of 20% or more from recent highs, often sparks fear and panic among investors. But for those with a plan, it represents one of the greatest wealth-building opportunities. Instead of retreating, savvy investors use downturns to acquire high-quality assets at discounted prices, setting the stage for significant long-term growth. This guide moves beyond generic advice to provide seven distinct, actionable bear market investing strategies, complete with real-world examples and practical implementation steps.

    We will explore a range of tactics, from the disciplined consistency of Dollar-Cost Averaging to the strategic patience of Value Investing. You will learn how to identify defensive sectors that can weather economic storms and how to target high-quality growth companies when their valuations become attractive. We will also cover more advanced concepts, such as using short selling or inverse ETFs to potentially profit from falling prices, and the critical role of holding cash as a strategic tool for seizing opportunities.

    Each strategy is designed to provide a clear framework for making informed decisions when market sentiment is at its lowest. Before diving into real-world applications of these strategies, consider utilizing tools like paper trading to practice and refine your approach risk-free and build confidence in navigating market downturns. This guide is designed to help you not only survive a downturn but to use it as a foundation for future financial success, transforming market volatility from a threat into a strategic advantage.

    1. Dollar-Cost Averaging (DCA)

    Dollar-cost averaging (DCA) is a disciplined and systematic investment strategy that removes emotion from the often-turbulent process of buying assets. Instead of trying to "time the market" by investing a lump sum at the perceived bottom, an investor commits to investing a fixed amount of money at regular intervals, such as weekly, bi-weekly, or monthly. This approach is one of the most effective bear market investing strategies because it reframes falling prices as an opportunity rather than a crisis.

    Dollar-Cost Averaging (DCA)

    During a bear market, your fixed investment amount automatically buys more shares of an asset when its price is low. As the market eventually recovers and prices rise, that same fixed amount buys fewer shares. This process can significantly lower your average cost per share over time, positioning your portfolio for amplified gains when the market turns bullish.

    How DCA Thrives in a Downturn

    The core strength of DCA lies in its ability to leverage volatility. Consider investors who consistently contributed to their 401(k) plans throughout the 2008-2009 financial crisis. While their account balances looked bleak in the short term, their regular contributions were purchasing stocks at deeply discounted prices. By 2012, those who stayed the course saw their portfolios recover and grow substantially, having built a strong foundation at the market’s low point.

    Similarly, an investor who committed to a $500 monthly investment in an S&P 500 index fund during the dot-com crash (2000-2002) would have accumulated a large number of shares at depressed valuations. This disciplined approach would have resulted in powerful returns by the time the market peaked again in 2007. More recently, crypto investors who used DCA to buy Bitcoin during its 2022 downturn were well-positioned for the significant recovery in 2023.

    Actionable Tips for Implementing DCA

    To make this strategy work effectively, focus on automation and consistency.

    • Set It and Forget It: Automate your investments. Schedule recurring transfers from your bank account to your brokerage account to invest on a specific day each month. This removes the temptation to pause contributions when fear is highest.
    • Focus on Broad Market Funds: DCA works best with diversified assets like broad-market index funds (e.g., VTI, VOO) or ETFs. These assets are highly likely to recover with the overall market, reducing single-stock risk.
    • Consider "Buying the Dip" Strategically: While standard DCA involves a fixed amount, some investors adopt a "DCA-plus" strategy. They might slightly increase their regular contribution amount after a significant market drop (e.g., a 10-15% decline) to capitalize further on lower prices.
    • Annual Review: Revisit your DCA amount annually or after a significant change in income. Adjusting your contribution ensures your strategy aligns with your current financial situation and long-term goals.

    2. Value Investing

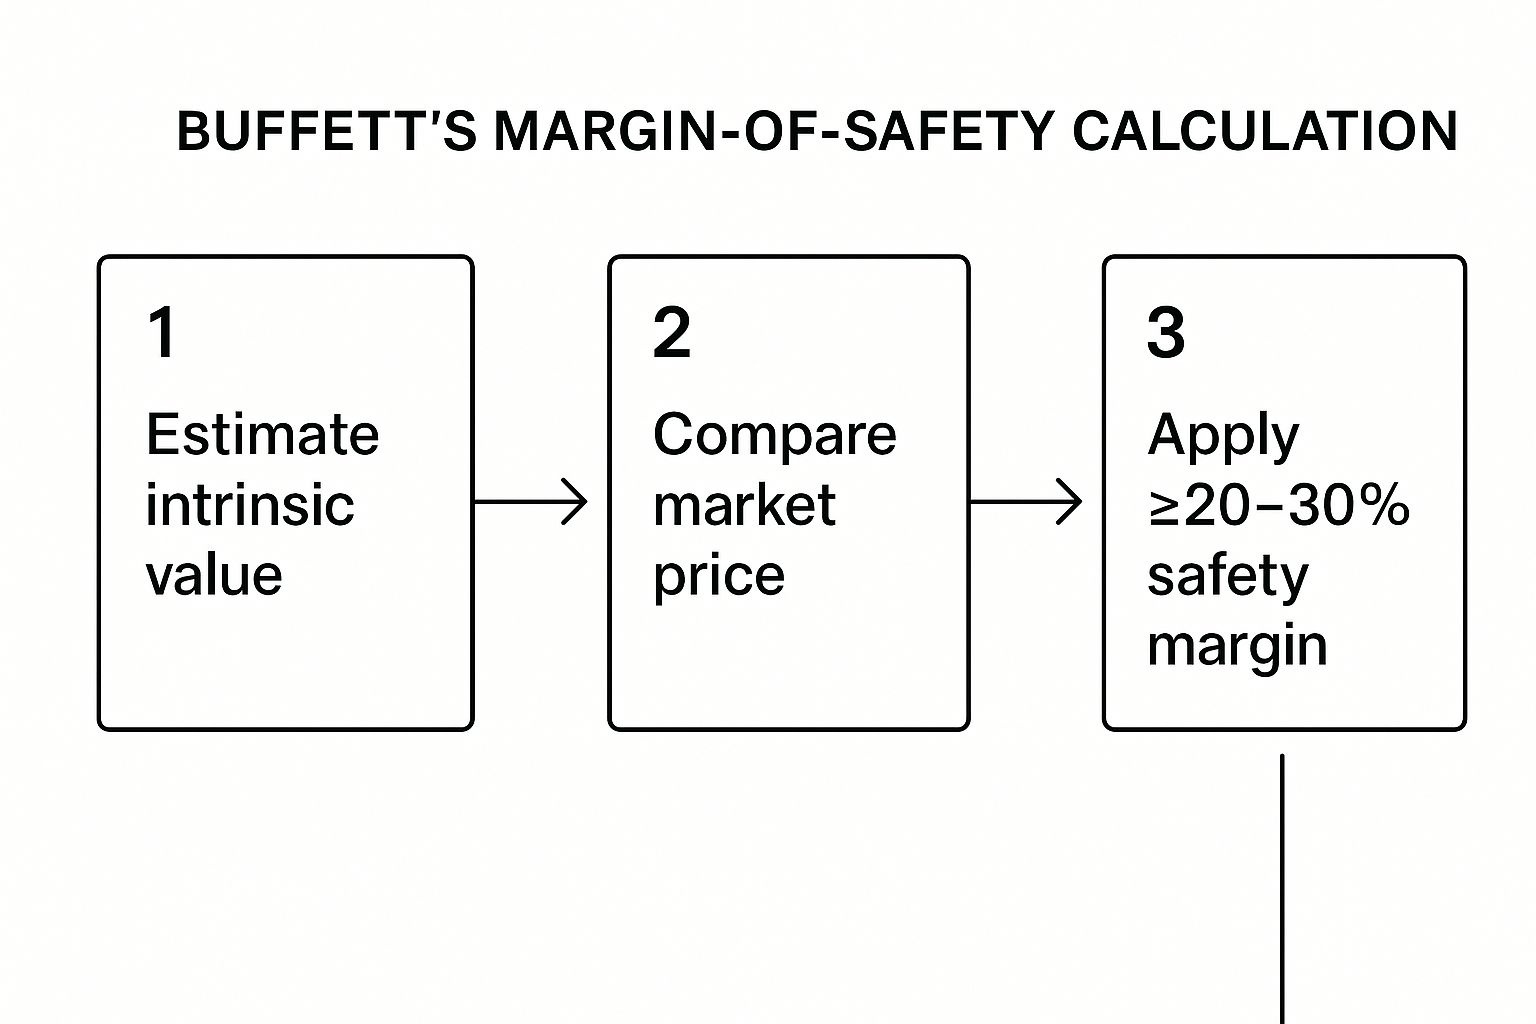
    Value investing is a time-honored philosophy centered on buying high-quality companies for less than their underlying worth. Pioneered by Benjamin Graham and famously practiced by Warren Buffett, this strategy involves identifying securities that are trading at a significant discount to their intrinsic value. A bear market is the ultimate hunting ground for value investors, as widespread fear and pessimism can cause even fundamentally sound businesses to become temporarily underpriced, creating exceptional bear market investing strategies for the patient investor.

    Instead of getting caught up in market sentiment, a value investor acts like a business analyst, meticulously assessing a company's financial health, competitive position, and long-term prospects. The goal is to find durable businesses that the market has unfairly punished. By purchasing these assets at a discount, investors create a "margin of safety," which provides both downside protection and significant upside potential when the market eventually recognizes the company's true value.

    How Value Investing Capitalizes on Fear

    History is filled with examples of value investing shining brightest during downturns. During the 2008 financial crisis, Warren Buffett made multibillion-dollar investments in Goldman Sachs and Bank of America. While others were panicking, he saw fundamentally strong institutions trading at crisis-level prices and secured highly favorable terms. Similarly, during the sharp COVID-19 market crash in March 2020, Berkshire Hathaway deployed capital into various businesses, capitalizing on the momentary panic.

    This approach isn't just for Wall Street titans. Benjamin Graham, the "father of value investing," built his fortune by patiently buying undervalued stocks during the Great Depression, a strategy that led to phenomenal long-term returns. The core principle remains the same: market downturns offer the rare chance to buy great companies "on sale." For a deeper dive into this philosophy, you can learn more about how to invest like Warren Buffett.

    Actionable Tips for Implementing Value Investing

    To apply this strategy effectively, you need a disciplined and analytical approach.

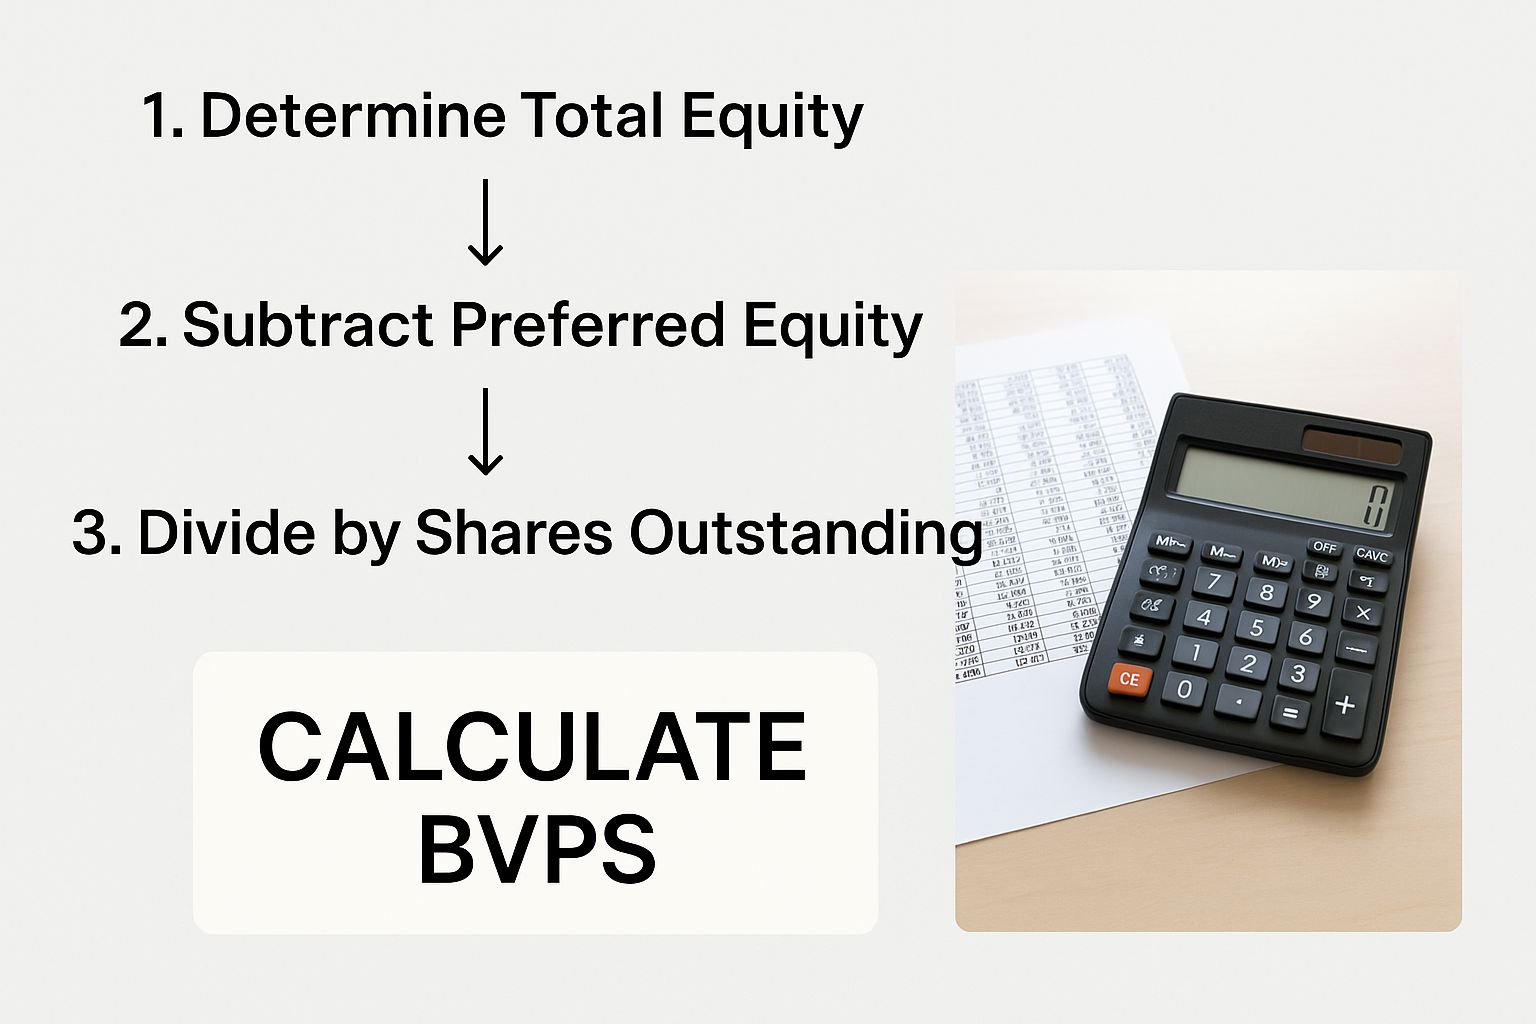
    • Prioritize Financial Health: Focus on companies with strong balance sheets, specifically those with low debt-to-equity ratios. Financially sound businesses are better equipped to survive economic storms without diluting shareholder value.
    • Identify a Durable Competitive Advantage: Look for businesses with a "moat," such as a powerful brand, network effects, or patent protection. This advantage allows them to protect their market share and profitability over the long term.
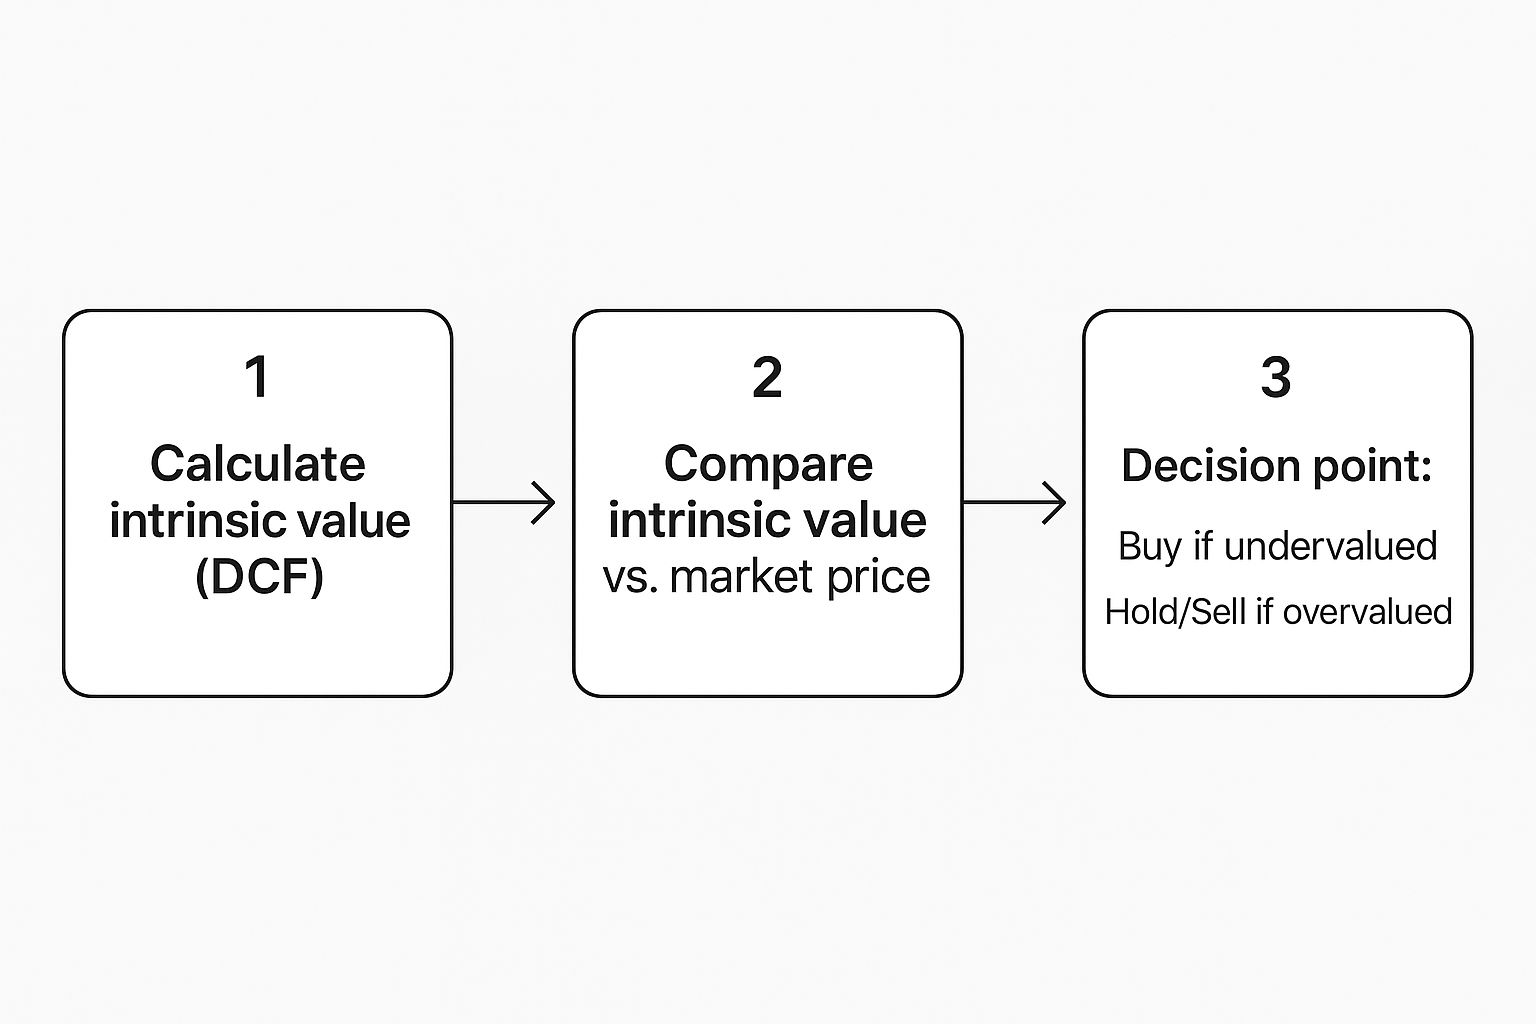
    • Calculate Intrinsic Value: Don't just guess if a stock is cheap. Learn to calculate a company's intrinsic value using multiple methods, such as Discounted Cash Flow (DCF) analysis. Understanding essential financial formulas like NPV and IRR is crucial for building accurate valuation models.
    • Keep Cash on the Sidelines: Maintain a cash reserve specifically for market downturns. This "dry powder" allows you to act decisively and purchase high-conviction assets when they become available at bargain prices.

    3. Defensive Sector Rotation

    Defensive sector rotation is a strategic portfolio adjustment that involves shifting investments toward sectors that have historically shown resilience during economic downturns. Rather than selling off assets in panic, this strategy reallocates capital to industries providing essential goods and services with stable demand. These typically include utilities, consumer staples, healthcare, and telecommunications, making this one of the most proactive bear market investing strategies for preserving capital.

    This infographic provides a quick reference on why defensive sectors can be a portfolio stabilizer during market volatility.

    Infographic showing key data about Defensive Sector Rotation

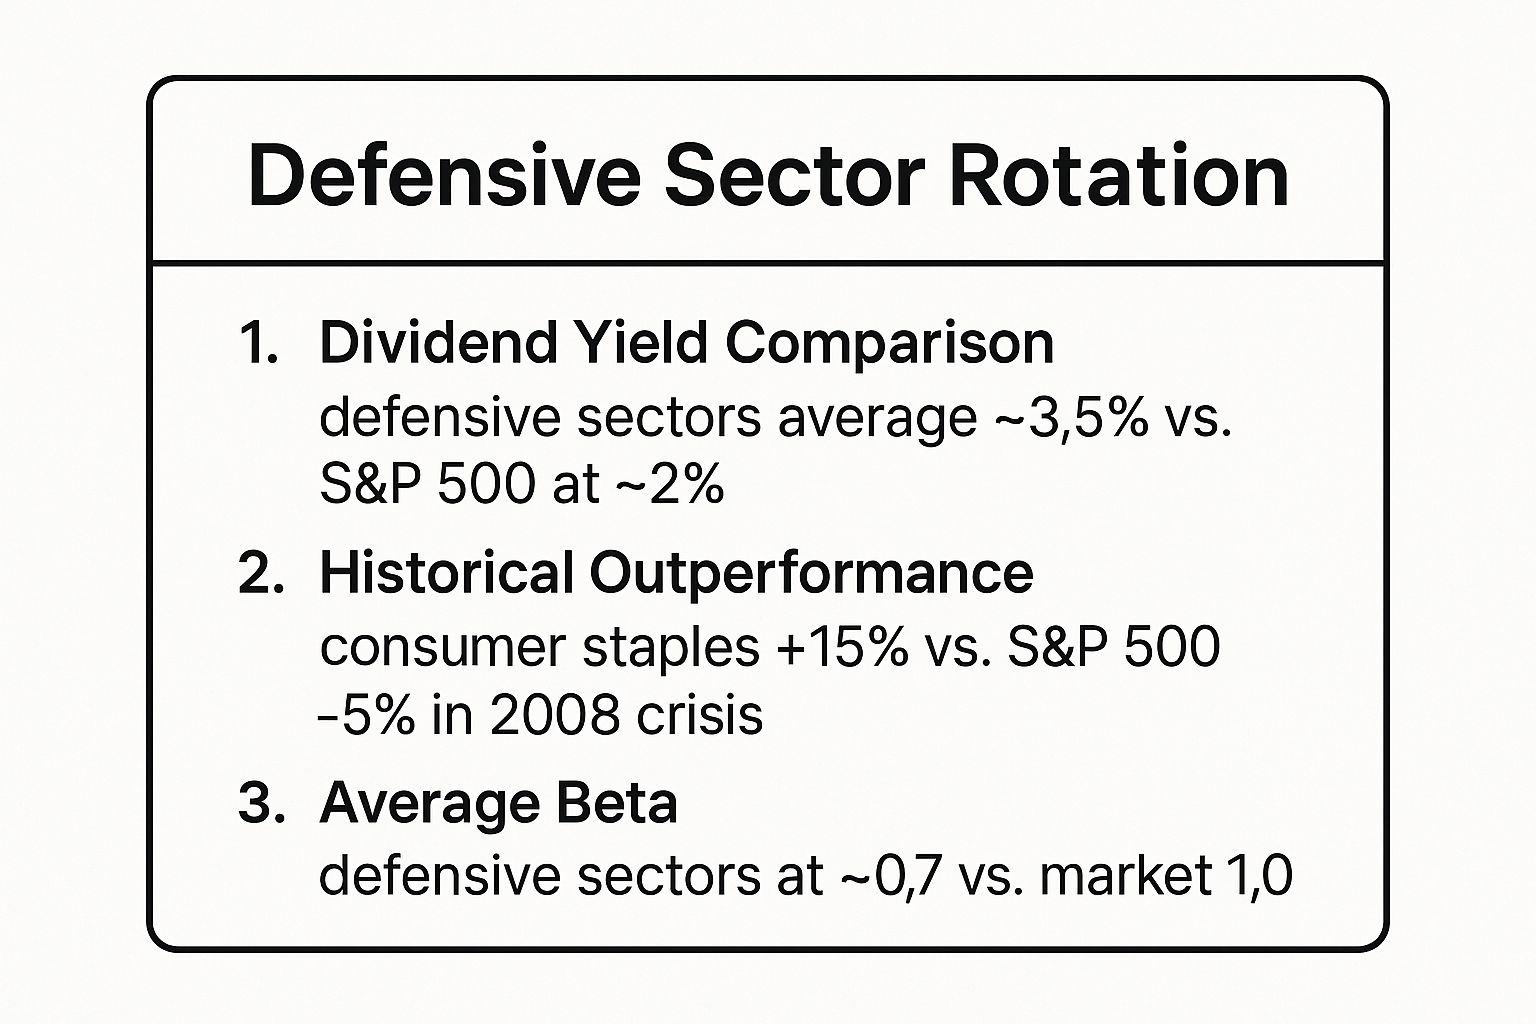
    The data clearly illustrates that these sectors not only tend to have lower volatility (beta) but also have a history of outperformance and higher dividend yields during economic stress.

    How Defensive Rotation Thrives in a Downturn

    The strength of this strategy lies in its focus on non-cyclical businesses. While consumers may delay buying a new car or a luxury watch during a recession, they will continue to pay for electricity, buy groceries, and seek medical care. This inelastic demand provides a floor for the revenues and earnings of companies in defensive sectors, making their stock prices less susceptible to wild swings.

    For example, during the 2008 financial crisis, the S&P 500 Consumer Staples sector outperformed the broader S&P 500 by approximately 15%, showcasing its capital preservation qualities. Similarly, during the initial COVID-19 market crash in early 2020, the healthcare sector demonstrated significant resilience as demand for its products and services surged. During the dot-com crash of 2000-2002, while technology stocks plummeted, utility stocks delivered positive returns, shielding investor portfolios from the worst of the drawdown.

    Actionable Tips for Implementing Defensive Rotation

    To execute this strategy effectively, focus on careful selection and timing.

    • Use ETFs for Diversification: Instead of picking individual stocks, consider using defensive sector ETFs like the Consumer Staples Select Sector SPDR Fund (XLP) or the Health Care Select Sector SPDR Fund (XLV). This provides instant diversification across the industry and reduces single-company risk.
    • Analyze Dividend Sustainability: Defensive stocks are often prized for their dividends. Look beyond the current yield and examine a company's dividend payout ratio and history of dividend payments to ensure they are sustainable, especially during a recession.
    • Monitor the Interest Rate Environment: Utility stocks, in particular, can be sensitive to interest rate changes. In a high or rising rate environment, their steady dividends may become less attractive compared to the yields on lower-risk bonds, which can put pressure on their stock prices.
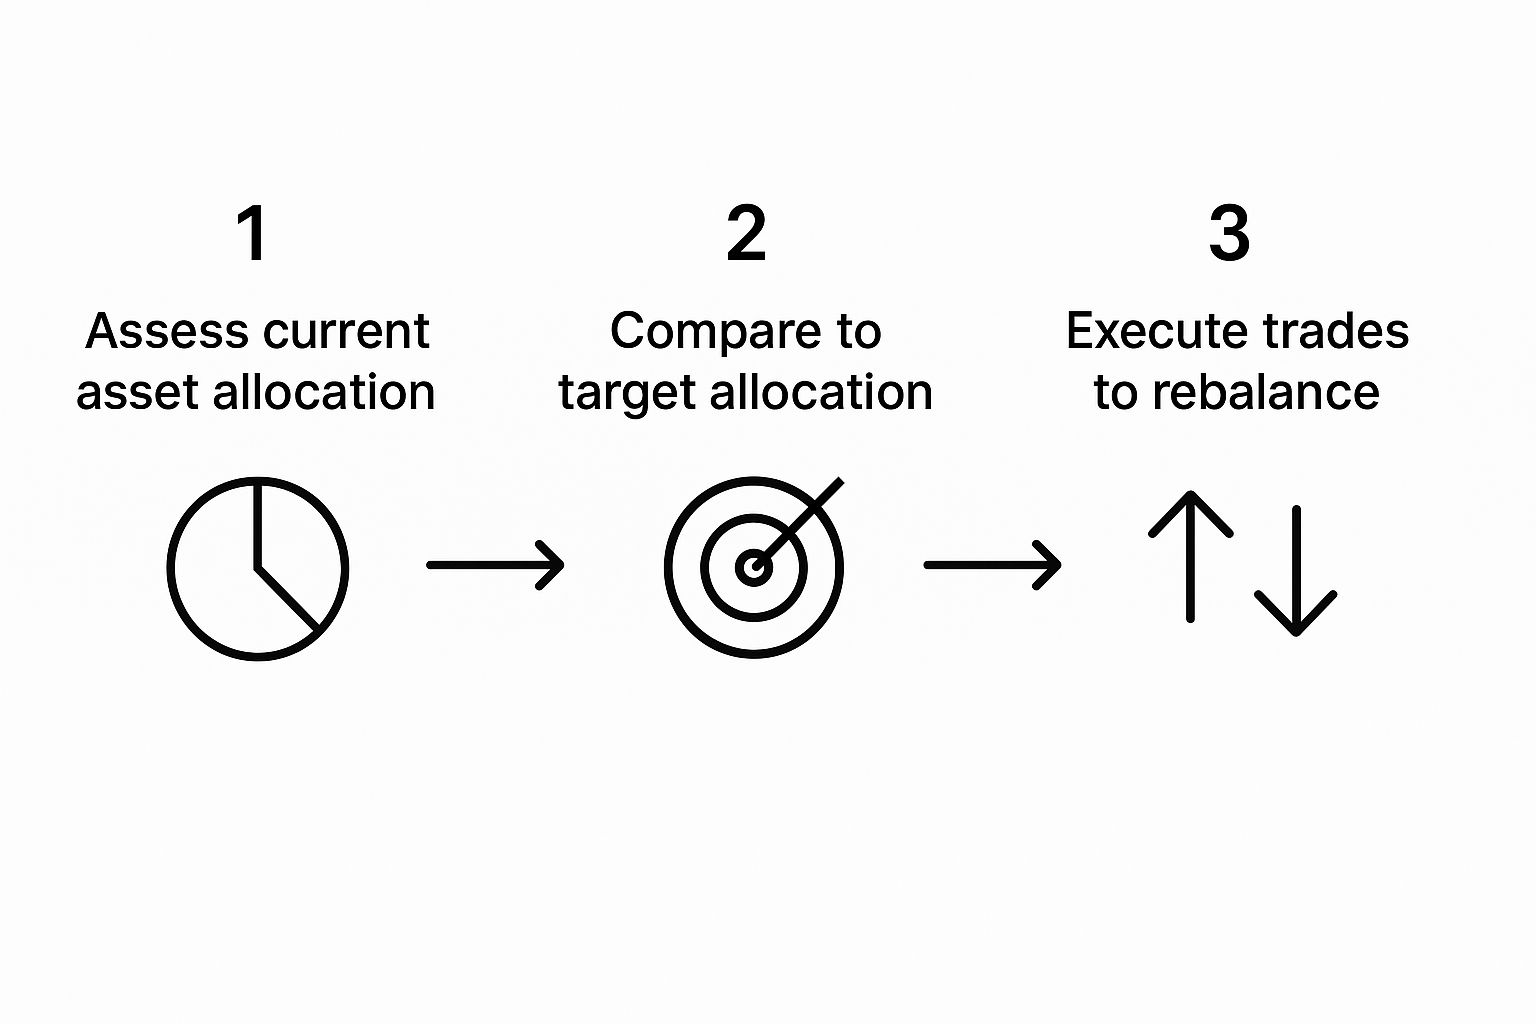
    • Plan Your Re-Entry: Defensive rotation is not a permanent move. The goal is to weather the storm and then rotate back into more growth-oriented sectors as the economy shows signs of recovery. For a deeper understanding of adjusting your portfolio, you can learn more about the principles of portfolio rebalancing.

    4. Short Selling and Inverse ETFs

    While most investment strategies focus on profiting from rising asset prices, short selling and inverse ETFs are advanced bear market investing strategies designed to generate returns when the market is falling. Short selling involves borrowing a stock, selling it at its current price, and then buying it back later at a lower price to return to the lender, pocketing the difference. Inverse ETFs, a more accessible alternative, are funds designed to move in the opposite direction of their underlying index, such as the S&P 500.

    Short Selling and Inverse ETFs

    These approaches allow savvy investors to not only hedge their long positions but also actively profit from a downturn. Instead of simply trying to preserve capital, these tools turn bear market declines into direct opportunities for growth. However, they come with significantly higher risks, as potential losses from short selling are theoretically unlimited if the stock price rises instead of falls.

    How Shorting Thrives in a Downturn

    The power of these strategies was famously demonstrated during the 2008 financial crisis. Michael Burry of Scion Capital used credit default swaps to effectively "short" the subprime mortgage market, leading to immense profits for his firm when the housing bubble burst. Similarly, hedge fund manager John Paulson made billions by shorting subprime mortgage-backed securities. These are extreme examples, but they highlight the potential of profiting from correctly identifying overvalued assets before a correction.

    During the dot-com bubble burst (2000-2002), short sellers like Jim Chanos of Kynikos Associates earned fortunes by betting against fraudulent or wildly overvalued tech companies. More recently, during the 2022 bear market, inverse ETFs like the ProShares Short S&P500 (SH) and the ProShares Short QQQ (PSQ) delivered positive returns while their underlying indices, the S&P 500 and Nasdaq-100, saw significant declines.

    Actionable Tips for Implementing Short Strategies

    These are not "set it and forget it" strategies and require active management and a deep understanding of the risks involved.

    • Start with Inverse ETFs: For investors new to shorting, inverse ETFs are a simpler and less risky entry point. They don't require a margin account or borrowing shares, and losses are capped at the initial investment amount.
    • Use Strict Stop-Loss Orders: When short selling a stock directly, a stop-loss order is non-negotiable. This automatically buys back the stock if it rises to a predetermined price, capping your potential losses.
    • Keep Position Sizes Small: Due to the high-risk nature of these strategies, allocate only a small portion of your portfolio to them. This ensures a mis-timed bet doesn't cripple your overall financial health.
    • Monitor Borrowing Costs: For direct short selling, you must pay interest on the shares you borrow. These "borrow fees" can become very expensive, especially for heavily shorted stocks, and can eat into potential profits.

    5. Quality Growth at Reasonable Prices (GARP)

    Quality Growth at a Reasonable Price (GARP) is a sophisticated hybrid strategy that blends the best of both growth and value investing. Instead of chasing high-flying growth stocks at any price or buying deeply distressed "cigar-butt" value stocks, GARP investors seek a sweet spot: well-managed, growing companies whose stock prices have been unfairly punished. This makes it one of the most effective bear market investing strategies, as widespread pessimism often pushes excellent companies into the "reasonable price" category.

    The GARP approach, famously championed by legendary investor Peter Lynch, prioritizes companies with consistent earnings growth, strong returns on equity, sustainable competitive advantages, and competent management. During a downturn, the market often fails to distinguish between high-quality businesses experiencing temporary headwinds and fundamentally flawed companies. A GARP investor uses this confusion to acquire shares in premier businesses at a significant discount to their intrinsic value.

    How GARP Thrives in a Downturn

    The power of GARP is its ability to find bargains among market leaders. During the 2008-2009 financial crisis, companies like Microsoft and Apple saw their stock prices plummet alongside the rest of the market, despite their fortress-like balance sheets and dominant market positions. Investors who recognized that their long-term growth stories were intact could acquire shares at price-to-earnings (P/E) ratios that were unthinkably low just a year earlier, leading to immense gains in the subsequent recovery.

    More recently, the 2022 tech bear market punished nearly all growth stocks. Amazon's stock fell dramatically as growth expectations were reset post-pandemic. A GARP investor would have analyzed its enduring dominance in e-commerce and cloud computing (AWS), recognized its long-term potential, and viewed the lower valuation as a prime buying opportunity. Similarly, Peter Lynch’s success at the Fidelity Magellan Fund was built on finding companies like Dunkin' Donuts and The Home Depot during periods when the market had temporarily soured on their prospects.

    Actionable Tips for Implementing GARP

    To apply this strategy, you must be both a business analyst and a disciplined value investor.

    • Look for Consistent Profitability: Focus on companies with a track record of high Return on Equity (ROE), ideally consistently above 15%. This indicates an efficient, well-run business that generates strong profits from its assets.
    • Analyze Competitive Positioning: Identify companies with durable competitive advantages or "moats." Does the company have a powerful brand, network effects, or patents that protect it from competition? Analyze its market share trends to ensure it's a leader.
    • Use the PEG Ratio: The Price/Earnings to Growth (PEG) ratio is a classic GARP metric. It compares a company's P/E ratio to its earnings growth rate. A PEG ratio around 1.0 is often considered a good indicator of a reasonably priced growth stock.
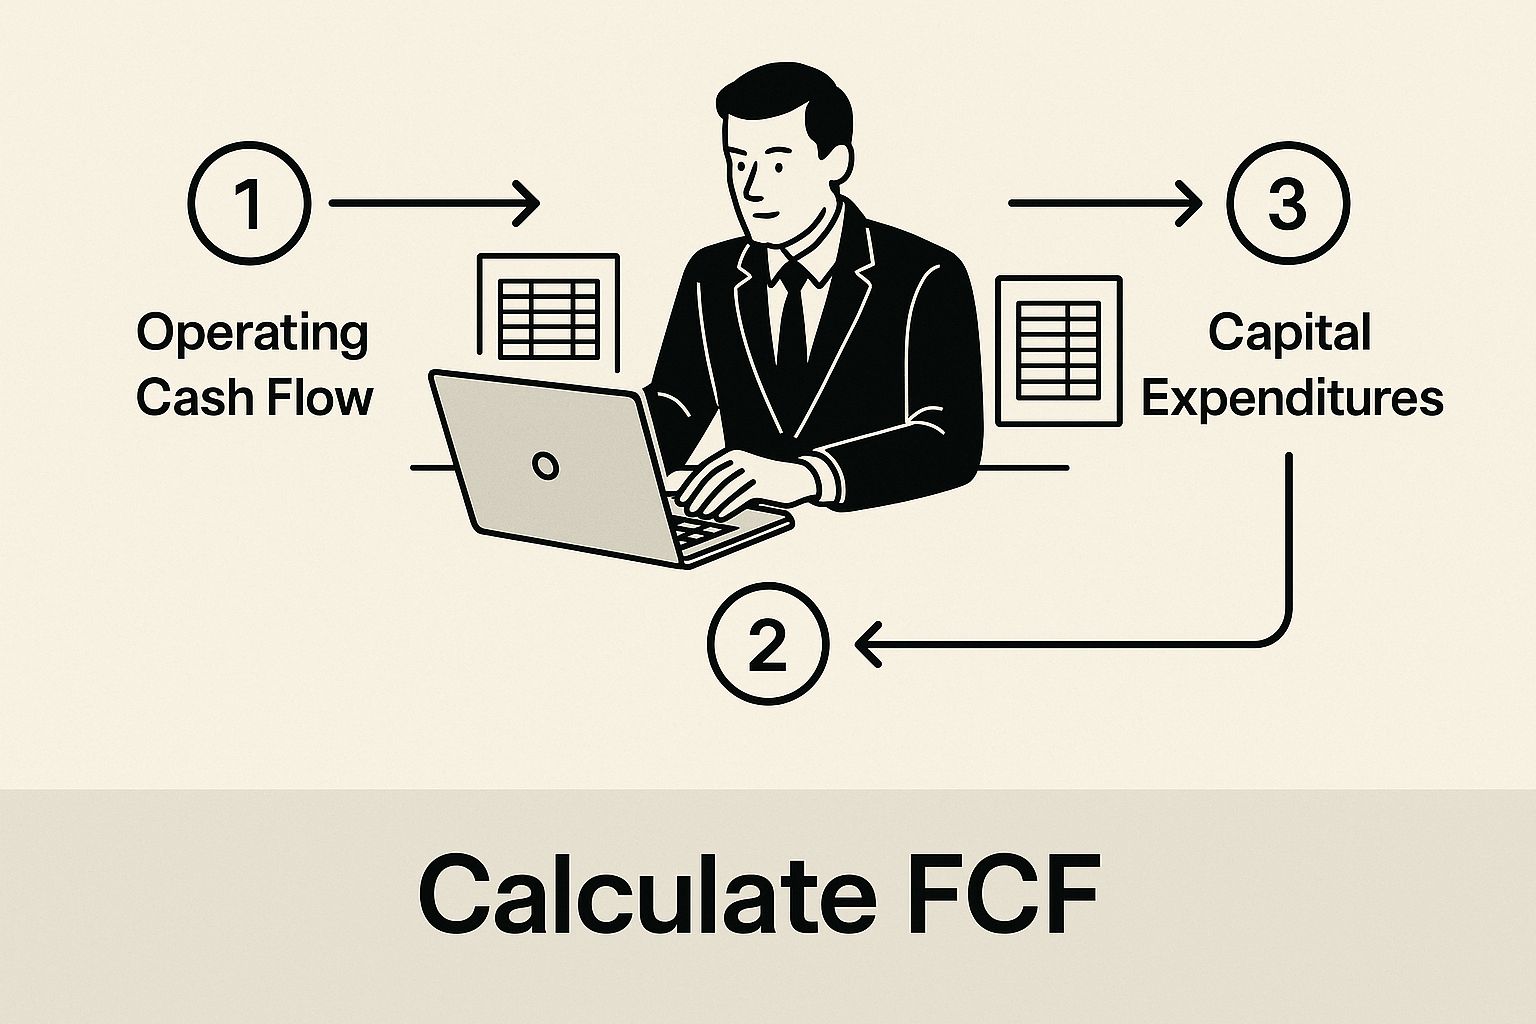
    • Focus on Free Cash Flow: Beyond earnings, analyze a company's ability to generate free cash flow. This is the actual cash a business produces, which can be used to pay dividends, buy back shares, or reinvest for future growth, making it a critical sign of financial health.

    6. Cash and Cash Equivalents Strategy

    Holding a higher-than-normal cash position is a powerful defensive move that prioritizes capital preservation and strategic flexibility during a downturn. This approach involves keeping funds in highly liquid, low-risk instruments like high-yield savings accounts, money market funds, or short-term Treasury bills. Rather than viewing it as "sitting on the sidelines," this is an active strategy that positions you to act decisively when investment opportunities arise from market panic. This is one of the most effective bear market investing strategies for investors focused on risk management and opportunistic buying.

    During a bear market, cash is king because its value doesn't fall with the market. While others are forced to sell assets at a loss to cover expenses or are too fearful to invest, your cash position gives you "dry powder." This liquidity allows you to purchase quality assets at significant discounts, effectively turning a market crisis into a generational buying opportunity.

    How Holding Cash Thrives in a Downturn

    The core strength of this strategy lies in its dual role as a shield and a spear: it protects your capital from drawdowns while preparing you for a future offensive. A prime example is Berkshire Hathaway, which famously maintained a cash hoard of over $120 billion leading up to the COVID-19 crash in early 2020. This massive liquidity allowed Warren Buffett to deploy capital into strategic investments when fear was at its peak.

    Similarly, investors who shifted a portion of their portfolio to cash in late 2021 or early 2022 were insulated from the worst of the 2022 market decline. As high-quality stocks and funds hit multi-year lows, these investors had the capital ready to buy at deeply discounted prices, setting themselves up for a powerful rebound. During the height of the March 2020 volatility, money market funds saw record inflows as investors flocked to safety, preserving capital that could be redeployed just weeks later at the market bottom.

    Actionable Tips for Implementing a Cash Strategy

    To use this strategy effectively, you need a disciplined plan for both holding and deploying your cash.

    • Define Your "Dry Powder" Fund: Determine a specific percentage of your portfolio to allocate to cash, separate from your standard 6-12 month emergency fund. This is your dedicated "opportunity fund."
    • Use High-Yield, Secure Instruments: Park your cash in FDIC-insured high-yield savings accounts (up to $250,000) or Treasury-backed money market funds to earn some return while waiting. For inflation protection, consider short-term Treasury bills or I-bonds.
    • Set Predetermined Re-entry Criteria: Don't try to time the exact bottom. Instead, establish clear rules for when you will start deploying cash. For example, you might decide to invest 25% of your cash after the S&P 500 has fallen 20%, another 25% after a 30% fall, and so on.
    • Avoid "Cash Drag" Indefinitely: The biggest risk of a cash strategy is missing the recovery. Sticking to your pre-defined deployment plan is crucial to ensure your cash doesn't sit on the sidelines for too long and miss the subsequent bull run.

    7. Dividend Growth Investing

    Dividend growth investing is a powerful strategy focused on acquiring stocks of companies with a long and consistent history of increasing their dividend payments. This approach is not about chasing the highest yields, but rather identifying financially sound businesses that reward shareholders with a growing stream of income. This discipline makes it one of the most resilient bear market investing strategies, as it provides both a psychological and financial cushion during downturns.

    While capital appreciation is a goal for any investor, dividend growth stocks offer a tangible return in the form of cash payments, regardless of the stock price's daily fluctuations. This reliable income can be a source of stability when portfolio values are declining. Furthermore, a commitment to consistently raising dividends often signals strong fundamentals, disciplined management, and confidence in future earnings, qualities that are highly attractive during periods of market uncertainty.

    How Dividend Growth Thrives in a Downturn

    The strength of this strategy lies in its dual benefit of income and defensive positioning. Dividend-paying companies, particularly "Dividend Aristocrats" (S&P 500 companies with 25+ consecutive years of dividend increases), often exhibit lower volatility than the broader market. Their established business models and stable cash flows allow them to weather economic storms more effectively.

    For instance, during the 2008-2009 financial crisis, stalwarts like Johnson & Johnson and Coca-Cola continued their multi-decade streaks of dividend increases, providing investors with a predictable income stream even as the market crashed. Similarly, data shows that dividend-focused ETFs often outperformed the S&P 500 during the dot-com bust of 2000-2002, offering superior downside protection. This historical resilience makes the strategy a cornerstone for conservative investors.

    Actionable Tips for Implementing Dividend Growth

    To effectively build a dividend growth portfolio for a bear market, focus on quality and sustainability.

    • Analyze the Payout Ratio: Target companies with a payout ratio below 60%. A lower ratio indicates that the dividend is well-covered by earnings and has room to grow, making it more sustainable during a recession.
    • Focus on Free Cash Flow: A healthy and growing free cash flow is essential for funding future dividend increases. Analyze a company's cash flow statements to ensure it generates more than enough cash to cover its obligations and reward shareholders.
    • Reinvest Dividends for Compounding: Use a Dividend Reinvestment Plan (DRIP) to automatically reinvest your dividend payments. During a bear market, this strategy acts like dollar-cost averaging, as your reinvested dividends buy more shares at lower prices, accelerating compound growth when the market recovers.
    • Diversify Across Sectors: Avoid concentrating in a single industry. Build a portfolio of dividend growers across various sectors like consumer staples, healthcare, utilities, and industrials to mitigate sector-specific risks. For those just starting, learning the fundamentals is key. You can explore a complete guide to dividend investing for beginners on investogy.com to build a solid foundation.

    Bear Market Investing Strategies Comparison

    Strategy Implementation Complexity 🔄 Resource Requirements 💡 Expected Outcomes 📊 Ideal Use Cases 💡 Key Advantages ⭐
    Dollar-Cost Averaging (DCA) Low 🔄 Low (steady cash flow) 💡 Reduced impact of volatility; steady growth 📊 Long-term investors looking for disciplined investing Automation reduces emotional decisions ⭐
    Value Investing High 🔄 High (research & analysis) 💡 Potential for strong returns after recovery 📊 Patient investors targeting undervalued stocks Margin of safety; quality company focus ⭐
    Defensive Sector Rotation Medium 🔄 Medium (active portfolio management) 💡 Portfolio stability during downturns 📊 Risk-averse investors seeking defensive exposure Stable dividends and essential services ⭐
    Short Selling & Inverse ETFs Very High 🔄 High (margin, borrowing costs) 💡 Profits from market decline; hedging 📊 Sophisticated investors hedging or speculating Potential for significant gains in bear markets ⭐
    Quality Growth at Reasonable Prices (GARP) High 🔄 High (in-depth analysis) 💡 Balanced growth and downside protection 📊 Investors seeking growth with value discipline Combines growth with value advantages ⭐
    Cash and Cash Equivalents Low 🔄 Low (liquid assets) 💡 Capital preservation; liquidity for opportunities 📊 Defensive investors prioritizing safety and flexibility Eliminates downside risk; fast redeployment ⚡
    Dividend Growth Investing Medium 🔄 Medium (analysis of dividend stability) 💡 Steady income with potential inflation protection 📊 Income-focused investors during volatile markets Consistent income; psychological benefit ⭐

    Building a Resilient Portfolio for All Seasons

    Navigating the turbulent waters of a downturn is less about finding a single, magical formula and more about assembling a robust toolkit of bear market investing strategies. The approaches we've detailed, from the systematic discipline of Dollar-Cost Averaging to the opportunistic patience of Value Investing, are not mutually exclusive. Instead, they represent a spectrum of tactics you can blend to construct a portfolio that is not just defensive but also opportunistic.

    The true challenge of a bear market is psychological. Fear and panic are powerful forces that can derail even the most well-intentioned investor. By internalizing these strategies before a downturn hits, you replace emotional reactions with a pre-defined, logical plan of action. This mental shift from fear to calculated opportunism is the single most important factor in turning market adversity into a long-term advantage.

    Synthesizing Your Strategy for Success

    The most resilient portfolios are rarely built on one pillar alone. Consider how these strategies can complement one another to create a more dynamic and effective plan:

    • Combine DCA with GARP: Use Dollar-Cost Averaging to systematically buy into high-quality companies whose growth prospects remain strong, even as their stock prices have become more reasonable. This methodical approach removes the pressure of timing the bottom perfectly.
    • Pair Value Investing with Dividend Growth: Hunt for undervalued, blue-chip companies that not only offer a margin of safety but also boast a long history of increasing their dividend payments. This creates a powerful dual-engine for returns: potential capital appreciation and a reliable, growing income stream to reinvest or live on.
    • Integrate Defensive Sectors with a Cash Reserve: Rotate a portion of your portfolio into non-cyclical sectors like consumer staples and healthcare for stability, while holding a strategic cash position. This cash isn't just a safety net; it's your "dry powder," ready to be deployed into high-conviction ideas when valuations become undeniably attractive.

    Ultimately, the goal is not to avoid losses entirely, which is an unrealistic expectation. The goal is to mitigate downside, stay invested, and strategically position your portfolio to capture the upside of the inevitable recovery. Every bear market in history has been followed by a bull market, and the seeds of future wealth are often sown during periods of maximum pessimism.

    Your Actionable Path Forward

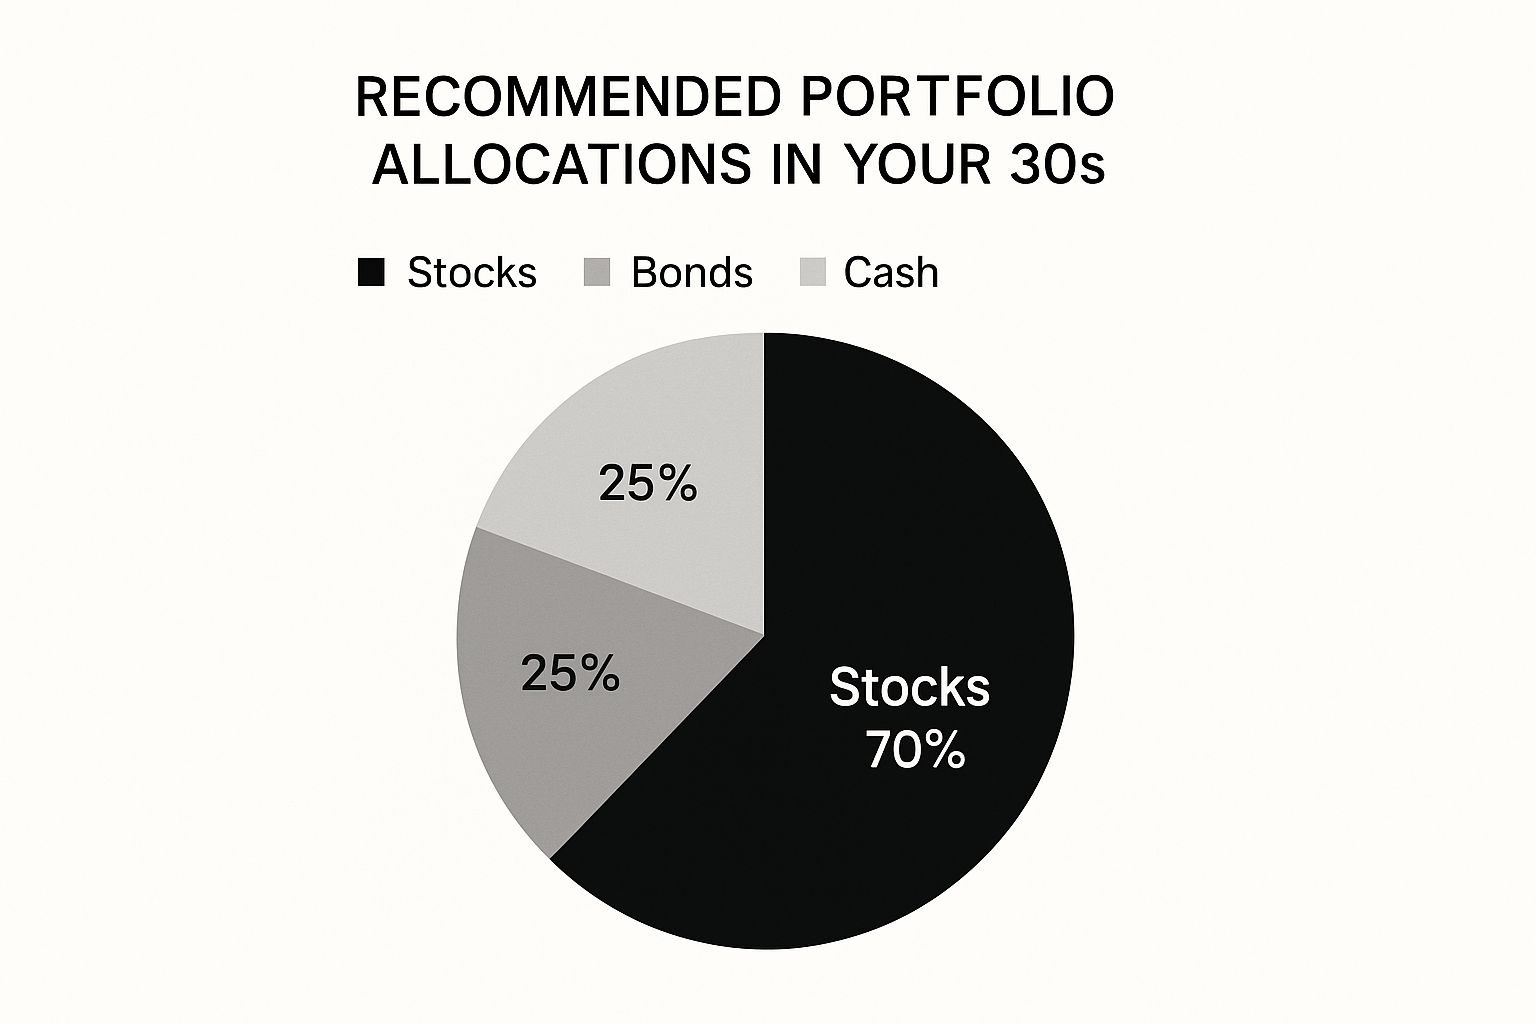
    Translating theory into action is what separates successful investors from the crowd. Your immediate next steps should be to review your current portfolio and financial plan with these concepts in mind. Ask yourself critical questions: Is my asset allocation aligned with my risk tolerance? Do I have a watchlist of quality companies I'd love to own at lower prices? Is my cash position adequate to seize opportunities without needing to sell assets at a loss?

    Furthermore, as you execute these strategies, such as selling certain positions to rotate into defensive sectors or harvesting losses for tax purposes, a crucial part of long-term resilience involves understanding capital gains tax implications. Proactive tax management can significantly enhance your net returns, ensuring that more of your hard-earned gains stay in your portfolio to compound over time. By mastering these powerful bear market investing strategies, you are not just surviving the storm; you are building a stronger, more resilient foundation for all seasons to come.


    Ready to see these principles in action? Follow along as we transparently manage a real-money portfolio through every market cycle at Investogy. Our newsletter provides the in-depth research and unfiltered analysis you need to build conviction and navigate the markets with confidence. Join Investogy today to transform market theory into a practical, real-world investing edge.

  • How to Build a Stock Portfolio from Scratch

    How to Build a Stock Portfolio from Scratch

    Before you even think about buying a single stock, you've got to do the foundational work. This is the part most people skip, and it's where the costliest mistakes are made. Building a solid stock portfolio isn't about chasing the hot stock everyone's talking about; it's about crafting a plan that fits your life and your goals.

    Get this part right, and every dollar you invest will have a clear, powerful purpose.

    Setting Your Personal Investment Foundation

    The first real step has nothing to do with the market. It’s all about you. What are you actually investing for? Without a destination, you’re just wandering, and in the world of investing, wandering gets expensive fast.

    Are you saving for a down payment on a house in five years? Or are you playing the long game, aiming for a comfortable retirement in three decades? The timeline is everything. It dictates your entire strategy.

    Define Your Time Horizon

    Your time horizon is simply the amount of time you plan to hold your investments before you need to pull the cash out. This single factor will have a huge impact on the kinds of assets you should own.

    • Short-Term Goals (Under 5 years): Think a new car, a wedding fund, or that house down payment. With a short window, you have very little time to recover from a market downturn. This means you need to lean conservative and focus on lower-risk assets.
    • Mid-Term Goals (5-10 years): This could be funding a child's college education or starting a business down the road. You have a bit more runway, which allows for a more balanced approach—a mix of growth and stability.
    • Long-Term Goals (10+ years): Retirement is the classic example here. With decades ahead of you, you can afford to take on more risk for the shot at higher returns. Your portfolio has plenty of time to bounce back from the inevitable market bumps and bruises.

    A 28-year-old socking money away for retirement can stomach a lot more market drama than a 58-year-old who plans to hang it up in seven years. The first person can weather the storms; the second needs to be laser-focused on protecting what they’ve already built.

    Understand Your True Risk Tolerance

    Next up, you have to get brutally honest with yourself about risk. This isn't just a fun little quiz; it’s about your real, gut-level ability to handle your account balance swinging up and down.

    Ask yourself this: If the market tanked 20% tomorrow, would you panic and hit the sell button, or would you see it as a chance to buy your favorite investments on sale?

    So many investors think they’re aggressive thrill-seekers during a bull market, only to find out they’re terrified of heights when things get choppy. The 2022 market downturn was a perfect gut check—a staggering 96% of stocks in the S&P 500 dropped by at least 15%. That kind of scenario tests everyone’s nerve.

    Your portfolio should let you sleep at night. If the thought of a market correction gives you a pit in your stomach, a high-octane, all-stock portfolio is wrong for you, no matter what the potential upside is.

    To get a better handle on where you stand, see which of these feels most like you:

    1. Conservative Investor: You prioritize protecting your capital above all else. You'd much rather earn a steady 4-5% return with low volatility than chase 12% returns that come with wild swings.
    2. Moderate Investor: You're looking for a happy medium between growth and stability. You're okay with some market ups and downs if it means a better shot at solid long-term returns.
    3. Aggressive Investor: Your main goal is to maximize your returns, and you're comfortable with big risks to get there. You understand that in the hunt for big gains, you might have to endure some significant losses along the way.

    And remember, this isn't a one-and-done decision. Life happens. Getting married, changing careers, or getting closer to retirement are all milestones that should prompt you to revisit your investment foundation. Taking the time to get this right from the start saves you from building a portfolio based on someone else's plan.

    Crafting Your Asset Allocation and Diversification Strategy

    Alright, now that you’ve wrestled with your financial goals and figured out your stomach for risk, it's time to build the actual blueprint for your portfolio. This is where the rubber meets the road—we’re turning your personal needs into a real investment structure through asset allocation and diversification.

    Think of asset allocation as the big picture: deciding how much of your money goes into broad categories like stocks versus bonds. Diversification is the next layer down. It’s about spreading that money across different kinds of stocks and bonds so you don't have all your eggs in one basket.

    Getting this structure right is probably the single most important thing you can do to manage risk without killing your potential for growth.

    The image below really nails down how this whole process starts with your personal objectives, which then dictate how you should structure everything else.

    Image

    As you can see, a solid plan always starts with you—your goals are the foundation for a smart allocation strategy.

    The Power of Not Losing Money

    Here’s the real magic of diversification: it's not about trying to pick only winners. It’s about making sure the losers don’t sink your entire ship. When one part of your portfolio is having a rough time, another part is hopefully holding steady or even rising. It’s a built-in shock absorber.

    This isn't just theory. Take 2022, a brutal year for almost everyone. A staggering 96% of stocks in the S&P 500 dropped by at least 15% at some point. If you were heavily concentrated in just a few of those falling stocks, you would have been absolutely crushed.

    A truly diversified approach means spreading your money across different dimensions:

    • Asset Classes: This is the classic mix. Stocks for growth, bonds for stability.
    • Sectors and Industries: You want a piece of everything—technology, healthcare, energy, consumer goods. When tech is in a slump, maybe energy is booming.
    • Geographies: Don't just stick to the U.S. market. Investing internationally can protect you if the American economy hits a rough patch.
    • Company Size: A healthy mix of large-cap (the established giants), mid-cap, and small-cap (companies with high growth potential) adds another layer of balance.

    This multi-layered approach helps ensure your portfolio isn't riding on the success of a single company, industry, or country.

    Finding Your Ideal Asset Mix

    So, how do you figure out the perfect mix for you? A great place to start is with time-tested models, then tweak them for your own situation. One of the most famous is the 60/40 portfolio.

    Historically, this simple strategy—60% in stocks, 40% in bonds—has been remarkably resilient. A 150-year analysis found that during 19 different stock bear markets, a 60/40 portfolio saw declines that were 45% less severe than a portfolio that was 100% in stocks. That's a huge difference when markets are in freefall. You can dig into the numbers in Morningstar's detailed stress test.

    But let's be clear: while the 60/40 is a great reference point, it's not a one-size-fits-all rule. Your personal asset mix should be a direct reflection of your goals, timeline, and how much risk you can handle.

    To give you a clearer picture, here’s how different types of investors might approach their allocation.

    Sample Asset Allocation Models by Risk Profile

    The table below shows a few examples of how your mix of stocks, bonds, and other assets might change depending on whether you're a conservative, moderate, or aggressive investor.

    Risk Profile Stocks (%) Bonds (%) Alternatives/Cash (%)
    Conservative 30% 60% 10%
    Moderate 60% 35% 5%
    Aggressive 85% 10% 5%

    An aggressive investor in their 20s with a 30-year horizon might go with 85% stocks, knowing they have decades to ride out any market downturns.

    On the flip side, someone getting close to retirement would likely feel much more comfortable with a conservative mix, maybe only 30% in stocks, to protect the money they’ve already saved. Age is a huge factor here, and you can explore some recommended asset allocation models based on age to get more specific ideas.

    Ultimately, the goal is to build a portfolio that not only aligns with your financial plan but, just as importantly, lets you sleep at night. A well-thought-out asset allocation is your best defense against volatility and making emotional, knee-jerk decisions with your money.

    Choosing the Right Investments for Your Portfolio

    Okay, you've got your asset allocation blueprint. Now comes the fun part: picking the actual investments that will build your portfolio. This is where we shift from theory to action, filling those buckets you've designed with assets that will (hopefully) grow your wealth.

    The investing world is massive, but for most of us building a stock portfolio, it really boils down to three main choices: individual stocks, ETFs, and mutual funds. Getting a handle on how these work is crucial for building a portfolio that not only fits your strategy but also matches how much time you're willing to put into managing it.

    Image

    Individual Stocks: The Hands-On Approach

    Buying individual stocks means you're purchasing a small piece of a specific company, like Apple (AAPL) or Ford (F). This path offers the biggest potential payoff if you pick a winner, but it's also the riskiest and demands the most homework.

    If you go this route, you can't just follow the headlines. You need to become a bit of a financial detective. That means digging into a company’s health by analyzing its balance sheet, income statement, and cash flow reports. You'll also want to understand its competitive edge in the market—what investors call its "moat." A strong moat means the company has a durable advantage that keeps competitors at bay.

    Honestly, it's a time-intensive process. If you want to be a stock picker, be prepared to commit to ongoing research. For those who enjoy this kind of detailed analysis, our guide on how to identify undervalued stocks is a great place to start.

    ETFs and Mutual Funds: The Power of Bundling

    For anyone who prefers a more hands-off approach or just wants instant diversification, Exchange-Traded Funds (ETFs) and mutual funds are fantastic tools. Think of them as baskets of securities—stocks, bonds, or other assets—that you can buy as a single investment.

    • ETFs (Exchange-Traded Funds): These trade on an exchange just like stocks, so their prices move up and down all day. They are often passively managed, meaning they're designed to track a specific index like the S&P 500. This passive style usually translates into very low fees, known as expense ratios.
    • Mutual Funds: These are priced only once per day after the market closes. Many are actively managed by a fund manager who is trying to beat the market by buying and selling securities. This active management almost always comes with higher expense ratios.

    The huge advantage of both is immediate diversification. Buying a single share of an S&P 500 ETF, for example, gives you a small slice of 500 of the largest U.S. companies. You get broad market exposure without having to research and buy 500 different stocks.

    Comparing Your Investment Choices

    Deciding between stocks, ETFs, and mutual funds isn't about finding the "best" one; it's about finding what's best for you. In fact, many successful portfolios use a mix of all three. Here’s a quick breakdown to help you see the differences.

    Feature Individual Stocks ETFs Mutual Funds
    Control Full control over which companies you own. No control over underlying holdings. No control over underlying holdings.
    Diversification Low (you build it one stock at a time). High (instant diversification). High (instant diversification).
    Management Self-managed (requires significant research). Mostly passive (tracks an index). Mostly active (managed by a professional).
    Cost Brokerage commissions per trade. Low expense ratios, brokerage commissions. Higher expense ratios, potential sales loads.
    Best For Investors who enjoy deep research and have high conviction. Hands-off investors seeking low-cost, broad exposure. Investors who want professional management.

    So, how does this look in the real world? An investor might use a low-cost global ETF as the core of their portfolio for stable, diversified growth. Then, they might dedicate a smaller slice of their capital to a few individual stocks in sectors they understand well and believe have huge growth potential.

    Building a stock portfolio effectively hinges on the principle of diversification, which has been proven critical over the long run. Diversification across different asset classes like stocks, bonds, and bills significantly reduces portfolio risk. A disciplined and diversified approach, coupled with a long-term perspective, is key to building a resilient stock portfolio globally. Discover more insights from the research in the UBS Global Investment Returns Yearbook 2025.

    Ultimately, your goal is to pick investments that fit neatly into the asset allocation plan you already created. Whether you choose to be a dedicated stock-picker or prefer the simplicity of an ETF, make sure every selection is deliberate, researched, and perfectly suited to your personal financial journey.

    From Plan to Action: Placing Your First Trades

    You've done the hard work. You’ve laid out your goals, assessed your risk, and built a solid investment blueprint. But a plan on paper is just that—paper. It’s time to bring it to life and make your strategy meet the market.

    This is the final, and frankly, most exciting part. We're moving from theory to reality. It all boils down to two things: picking the right tools for the job and then learning how to use them. Let's get your first trades placed with confidence.

    Choosing the Right Brokerage for You

    Think of a brokerage as your gateway to the stock market. Picking the right one makes investing feel simple and affordable. The wrong one? It’s a fast track to headaches and sneaky fees that chip away at your returns. The good news is, you've got tons of options, so you can be picky.

    When you're shopping around, cut through the noise and focus on what really matters:

    • Fees: This one's huge. Most major brokerages now offer $0 commissions on stock and ETF trades. That’s a massive win. But keep an eye out for the other stuff—account maintenance fees, transfer-out fees, or other random charges.
    • User Experience: Is the platform easy to figure out, both on your computer and on your phone? As a new investor, you don't need the overwhelming complexity of a professional trading terminal. A clean, straightforward interface is your best friend.
    • Research & Tools: If you’re planning to dive into individual stocks, good research tools are a game-changer. Some brokers offer fantastic stock screeners, analyst reports, and educational content for free.

    Big names like Fidelity, Charles Schwab, and Vanguard are perennial favorites for a reason—they offer a great all-around package with robust tools and tons of low-cost funds. On the other hand, newer players like Robinhood or M1 Finance have built a following with their slick, mobile-first designs that appeal to a new generation of investors.

    Executing Your First Purchase

    Okay, your account is open and funded. You’re ready to pull the trigger. But "buying a stock" isn't quite as simple as hitting a single "buy" button. You need to give your broker specific instructions on how you want to buy it. This is called placing an order, and the two you need to know are market orders and limit orders.

    A market order is the most basic command you can give. It says, "Buy this for me right now at the best price available." It’s fast and guarantees your order gets filled, but it doesn't guarantee the price you'll pay.

    A limit order, however, puts you in the driver's seat. You set the maximum price you're willing to pay for a stock (or the minimum you'll accept to sell). Your order will only go through if the stock's price hits your target number or better.

    Here’s how that plays out in the real world: Let's say you want to buy some shares of a big tech company that's trading around $150. If you place a market order, the price could tick up to $150.10 or dip to $149.95 in the split second before your trade executes. You'll pay whatever the going rate is. But if you place a limit order to buy at $149.50, your order will just sit there, waiting patiently. It will only execute if and when the price drops to that level.

    So, which one should you use?

    For long-term investors buying big, stable ETFs or blue-chip stocks, a market order is usually perfectly fine. The price isn't likely to swing wildly in a matter of seconds. But if you're buying a more volatile stock or you've pinpointed a specific price you think is a good deal, the limit order is the smarter, more disciplined approach. It’s a simple choice that helps you avoid overpaying and builds a crucial habit of sticking to your plan from day one.

    How to Manage and Grow Your Portfolio Long Term

    So you’ve built your portfolio. Great! But the real work—and the real reward—starts now. Building a stock portfolio is just the first step; learning how to manage it over the long haul is where the magic happens.

    Think of it like tending a garden. You don't just plant the seeds and walk away hoping for the best. You have to water, weed, and prune. That consistent attention is what helps it flourish into something truly substantial.

    This ongoing maintenance, a mix of periodic reviews and strategic tweaks, is what transforms your initial investment into a dynamic, lifelong wealth-building machine. It’s how you make sure your portfolio keeps working for you, even as your life and the market inevitably change.

    Image

    The Overlooked Power of Rebalancing

    Left to its own devices, your portfolio is going to drift. It's just what happens. Your best-performing assets will grow faster, gobbling up a larger slice of the pie, while others might lag behind. This isn't a bad problem to have, but it can quietly crank up your risk exposure without you even noticing.

    This is where rebalancing comes in. It’s the simple, disciplined process of nudging your portfolio back to its original target.

    In practice, this usually means selling a bit of your winners and using that cash to buy more of the assets that have underperformed. I know, it feels completely backward. Why sell the things that are doing well? But it’s a systematic way to force yourself to sell high and buy low.

    Imagine you started with a target of a 60/40 stock-to-bond mix. After a killer year for stocks, your portfolio might now be sitting at 70% stocks and 30% bonds. Rebalancing just means trimming that stock position back down to 60% and topping up your bonds to 40%. You lock in some gains and, more importantly, bring your risk level back to where you’re comfortable.

    Finding Your Review Rhythm

    So, how often should you be checking in on your portfolio? For most long-term investors, the answer is "a lot less than you think."

    Peeking at your account every day (or even every week) is a recipe for emotional decision-making. You end up reacting to meaningless market noise instead of focusing on the big picture. A much calmer, more effective approach is to schedule your check-ins.

    Here are a couple of popular ways to do it:

    • Time-Based: This is the easiest method. Just pick a schedule and stick to it—quarterly, semi-annually, or annually. For most people, an annual review is plenty.
    • Threshold-Based: With this strategy, you only step in when an asset class drifts by a certain percentage from its target, say 5%. If your target for U.S. stocks is 40%, you’d only act if it ballooned to 45% or shrank to 35%.

    A quick pro-tip: big life events are another powerful trigger for a portfolio review. Getting a major promotion, having a child, or getting close to retirement are all milestones that should prompt you to ask, "Does my investment strategy still make sense for my new reality?"

    As you get more comfortable, you'll want to refine your approach. Learning about different strategies, like these 8 portfolio management best practices, is a great way to stay sharp.

    Stay Grounded and Play the Long Game

    Managing your portfolio over the long term is also about managing your own expectations. It's incredibly easy to get discouraged during a down year or feel like a genius during a bull run.

    The key is to anchor your mindset in reality. History shows us, time and again, that steady, patient investing is what wins out. It’s not about timing the market; it’s about time in the market.

    Remember, you’re building wealth over decades. To get a deeper dive on this, check out our own guide on /blog/portfolio-management-best-practices/ for some more advanced strategies.

    Ultimately, your success won't come from one spectacular stock pick. It will come from your commitment to a disciplined, long-term process of managing, rebalancing, and growing your investments year after year.

    Got Questions About Building a Portfolio? You're Not Alone.

    Jumping into the world of investing can feel like learning a new language. A million questions probably pop into your head, and it’s completely normal to wonder if you're getting it right, especially when your hard-earned money is on the line.

    Think of this as your quick-start FAQ. We're going to tackle some of the most common questions and sticking points I see from people just starting to build a stock portfolio.

    How Much Money Do I Actually Need to Start?

    This is easily the biggest myth that trips people up. For years, the conventional wisdom was that you needed a small fortune to even get in the game. Thankfully, that idea is long dead.

    These days, the barrier to entry is practically zero. Thanks to the magic of fractional shares, you can start investing with as little as $5 or $10. This lets you buy a tiny slice of a stock instead of needing the cash for a full, expensive share. Eyeing a piece of a company whose stock trades for over $500? With fractional shares, you can buy a sliver of it with whatever you've got.

    The most important thing isn’t the amount you start with—it’s the habit you build. Consistently putting away a small amount, like $50 a month, is far more powerful in the long run than making one big splash and then stopping.

    Should I Pay Off All My Debt Before Investing?

    This is a classic "it depends" situation, but there’s a pretty simple framework to figure it out. It all comes down to comparing the interest rate on your debt to the potential return on your investments.

    • High-Interest Debt: If you're carrying credit card debt with a nasty 15% to 25% APR, that should be your absolute top priority. No investment on earth can reliably guarantee that kind of return. You'll get a better "return" on your money just by wiping out that high-interest debt first.
    • Low-Interest Debt: On the other hand, for debt with a lower interest rate—think mortgages or student loans under 7%—the math starts to look different. The stock market has historically returned around 10% annually over the long haul. In this scenario, it often makes sense to invest while you're paying down that debt, letting your money work for you in two places at once.

    Do I Need a Financial Advisor?

    Let's be clear: hiring a financial advisor is a personal choice, not a mandatory step. For a huge number of people, a straightforward, low-cost strategy using broad-market ETFs is something they can absolutely manage on their own. The sheer volume of high-quality, free information available today has empowered millions of DIY investors.

    But an advisor can be incredibly valuable in a few key situations:

    • Your finances are complex. If you're juggling business ownership, intricate estate planning needs, or other complicated financial pieces, an expert can be worth their weight in gold.
    • You need emotional backup. Let's be honest—some of us are prone to panic-selling during a market dip. An advisor can act as a crucial behavioral coach, keeping you from making emotional mistakes.
    • You just don't have the time or interest. If you'd rather spend your time doing literally anything else than managing your money, delegating to a professional is a smart move.

    At the end of the day, whether you go it alone or hire some help, the core principles of building a solid stock portfolio are the same. The real goal is to create a plan that fits your life and gives you the best shot at reaching your financial destination.


    At Investogy, we're all about showing our work. We're building a real-money portfolio in public, sharing every decision—the wins and the lessons learned. If you want to see these principles in action, subscribe to our free weekly newsletter.

    See How We're Building Our Portfolio at Investogy

  • What Is Portfolio Rebalancing? A Guide for Investors

    What Is Portfolio Rebalancing? A Guide for Investors

    Portfolio rebalancing is just a fancy term for getting your investments back in line with your original game plan. Think of it as a disciplined tune-up for your portfolio: you systematically sell some of the assets that have done really well and use that money to buy more of the assets that have lagged behind. The goal is to bring your portfolio back to its target risk level.

    Your Investing GPS: Understanding Portfolio Rebalancing

    Image

    Imagine setting out on a long road trip. Before you leave, you plug your destination into your GPS. That route is your investment plan, designed to get you to your financial goals safely and on time. Rebalancing is the GPS constantly recalculating and making small course corrections to keep you on the fastest, most efficient path, especially when unexpected detours or traffic jams (market volatility) pop up.

    Left untouched, your portfolio will naturally drift away from its starting point. It’s inevitable. Some investments will have a great year and grow faster than others, making them a bigger piece of your overall pie. For instance, a strong run in the stock market could easily turn your balanced 60% stocks/40% bonds portfolio into a much riskier 70/30 mix—without you ever making a single trade.

    The Car Alignment Analogy

    This is a lot like your car's wheel alignment. When the wheels are out of alignment, the car still drives, but it might pull to one side. You might not even notice it on a smooth, straight road. But that subtle pull makes the car less efficient, wears down your tires unevenly, and can make it much harder to control in bad weather.

    An unbalanced portfolio is the same way. It might feel great during a bull market when everything is going up, but that unintended concentration in certain assets leaves you far more exposed when the market takes a downturn. Rebalancing is the routine maintenance that pulls everything back into spec, ensuring a smoother, safer financial journey.

    To illustrate how this works, let's look at a simple portfolio before and after a year of market movements.

    Your Portfolio Before and After Rebalancing

    This table shows how a simple portfolio can drift from its intended path and how rebalancing brings it back into alignment.

    Asset Class Initial Target After Market Shift After Rebalancing
    Stocks 60% 70% 60%
    Bonds 40% 30% 40%

    As you can see, the stock portion grew to 70% due to strong performance, increasing the portfolio's overall risk. Rebalancing involves selling 10% of the stocks and buying 10% more bonds to restore the original 60/40 split.

    This process isn't about chasing the highest possible returns. It’s about sticking to your strategy and managing risk.

    At its core, portfolio rebalancing is a risk-control tool. The idea isn't to time the market but to maintain your intended investment strategy and protect yourself from taking on more risk than you're comfortable with as the market moves.

    This systematic approach forces you to buy low and sell high, putting discipline ahead of emotion. If you're looking to build on foundational concepts like this, resources like Vtrader's Academy offer a great way to deepen your knowledge. Ultimately, rebalancing keeps you in the driver's seat of your financial future.

    Why Rebalancing Is Your Financial Safety Net

    Image

    A lot of investors think rebalancing is about trying to squeeze a few extra percentage points out of the market. It’s not. In reality, its main job is far more important: it’s one of the best risk-management tools you’ll ever use.

    Think of it less like chasing hot stocks and more like protecting the gains you’ve already worked so hard to make.

    The real magic of rebalancing is that it yanks emotion right out of the equation. It's a system that forces you to follow the oldest, most proven rule in investing: buy low and sell high. When one of your investments shoots for the moon, rebalancing tells you to sell a bit and lock in those profits. When another one takes a dive, it nudges you to buy more while it's on sale.

    Protecting Against Overconcentration

    Imagine your portfolio is a garden. If you let one plant—say, a fast-growing tomato vine—go wild, it’ll eventually hog all the sunlight, water, and nutrients. Pretty soon, your other plants will start to wither. A smart gardener regularly prunes that overgrown vine, not to punish it, but to keep the whole garden healthy and balanced.

    That’s exactly what rebalancing does for your investments. Without it, a single high-flying stock or a hot sector can quietly grow to dominate your portfolio. Before you know it, you're dangerously over-exposed to one volatile area. Rebalancing "prunes" those winners to restore balance and keep your entire portfolio thriving for the long haul.

    This isn't just a trick for DIY investors, either. Professional fund managers are constantly doing this to keep their portfolios in line with their risk targets. One study of 6,500 international equity funds found that managers consistently tweaked their holdings to stabilize their exposure as the market moved.

    Rebalancing is basically a cheat code for disciplined investing. It makes you a contrarian by default, forcing you to take profits from your winners and move that cash into assets that are temporarily unloved. This simple act prevents you from making emotional mistakes that could derail your whole strategy.

    Aligning With Your Long-Term Goals

    At the end of the day, the whole point is to keep your portfolio true to your personal financial plan. You picked your specific mix of stocks and bonds for a reason—it was based on your timeline, your goals, and how much risk you could stomach.

    If you haven't nailed down those targets yet, our guide on recommended asset allocation based on age is a great place to start. Once you have that blueprint, rebalancing is simply the maintenance that ensures you stay on that carefully chosen path, no matter what kind of chaos the market throws at you.

    Common Portfolio Rebalancing Methods Explained

    Image

    Once you’re sold on the "why" of rebalancing, the next question is "how." Luckily, you don't need a Wall Street algorithm to get this right. Most investors stick to one of two straightforward, battle-tested methods to keep their portfolios on track.

    Think of it as two main camps: rebalancing on a fixed schedule, or rebalancing only when things get noticeably out of whack. Each has its own rhythm and fits a different type of investor.

    Calendar-Based Rebalancing

    The simplest and most popular method is calendar-based rebalancing. Just like it sounds, you pick a date on the calendar and make that your rebalancing day. It could be annually (maybe on your birthday), semi-annually, or quarterly.

    The biggest win here is discipline. It creates a recurring, non-negotiable appointment to check in on your portfolio. This forces you to step back from the daily market noise and focus on your long-term plan, preventing emotional, knee-jerk reactions.

    This "set it and forget it" style is a perfect fit for hands-off investors who prefer a simple routine they can stick to without much fuss.

    By committing to a schedule—say, every January 1st—you automate your discipline. This removes the temptation to react to short-term market noise and keeps your focus squarely on your long-term strategy.

    Threshold-Based Rebalancing

    On the other hand, threshold-based rebalancing is all about reacting to specific events, not the calendar. Here, your trigger is when an asset class strays too far from its target allocation by a percentage you decide on ahead of time.

    For example, you could set a 5% threshold. If your target for stocks is 60% of your portfolio, you'd only step in to rebalance when that allocation hits 65% (time to sell some) or drops to 55% (time to buy more).

    This approach is naturally more tuned-in to market swings. It ensures you only make a move when your portfolio's risk level has genuinely shifted, which can lead to smarter adjustments during big market rallies or downturns.

    Choosing Your Rebalancing Strategy

    So, which path is right for you? It really boils down to your personality and how you like to manage things. Are you a routine-oriented person who thrives on a simple, predictable schedule? Or do you prefer a more dynamic approach that calls for a bit more monitoring but responds directly to market changes?

    To help you decide, here’s a quick comparison of the two main strategies.

    Strategy Best For Pros Cons
    Calendar-Based Hands-off investors who value simplicity and routine. Easy to remember and automate. Enforces discipline and prevents emotional decisions. Can be arbitrary; you might trade unnecessarily or miss major market moves between dates.
    Threshold-Based Hands-on investors who want to react to market volatility. More responsive to market shifts. Avoids trading on minor fluctuations. Requires more frequent monitoring to spot when a threshold is crossed.

    Ultimately, there’s no single "best" answer. The most effective rebalancing plan is the one you can actually follow consistently over the long haul. Figure out which style clicks with you, and you'll be well on your way to building a resilient, goal-oriented portfolio.

    How Global Events Impact Your Rebalancing Strategy

    It’s easy to forget, but your portfolio doesn't live in a vacuum. It's constantly being pushed and pulled by what's happening around the world—everything from currency swings to how international markets are trending. These global currents can seriously throw your asset allocation off course, which is why a disciplined rebalancing strategy is so critical.

    Professional fund managers get this. For them, rebalancing isn't just about managing risk; it's their systematic way of responding to global shifts. It also acts as a powerful antidote to a classic investor mistake known as home bias. That’s our natural tendency to keep most of our money invested right here in our own country's market.

    Overcoming Home Bias With Discipline

    Sticking to what's familiar feels safe, but piling too much into domestic stocks leaves your portfolio exposed. A good rebalancing plan forces you to stay globally diversified.

    Let’s say your international stocks have a fantastic year. Their value balloons, and suddenly they’re a much bigger piece of your portfolio pie than you intended. Rebalancing is the trigger that tells you to trim some of those high-flying foreign assets and lock in those gains, bringing the profits back home.

    Now, flip the script. What happens when international markets take a dive? Your allocation to them shrinks. This is where rebalancing shines. It nudges you to buy more of these assets while they're on sale, hardwiring the "buy low" principle into your strategy on a global scale. This disciplined process keeps you from ditching your international holdings right when it's the most opportune time to be buying.

    A study of over 8,500 funds found a clear pattern: when foreign stocks did well, managers systematically moved capital back to their home turf. But when foreign stocks fell, they consistently bought more, with currency volatility making this effect even stronger. You can dive into the research on global rebalancing strategies.

    By sticking to your target allocations, you’re not just reacting to market news. You're building a framework that can actually take advantage of global market cycles instead of getting swept away by them.

    Your Step-by-Step Guide to Rebalancing a Portfolio

    Knowing the theory is one thing, but putting portfolio rebalancing into practice is where you really take control. The good news is, this process isn't nearly as complex as it sounds. Think of it as a disciplined tune-up for your investments, designed to keep everything aligned with your long-term vision.

    This visual below lays out the core workflow, from taking stock of where you are to making the necessary moves.

    Image

    It really boils down to three simple stages: see where you stand, compare it to your blueprint, and then make the adjustments to get back on track.

    A Practical Four-Step Process

    Ready to roll up your sleeves? Here is a clear, actionable blueprint to bring your portfolio back into balance. Once you do it a couple of times, it becomes a simple, repeatable habit.

    1. Review Your Target Allocation: Before you touch a single investment, you need to check your map. Is your original target still the right one for you? Life changes, and your strategy should, too. Does that 60% stock and 40% bond split still feel right given your goals and stomach for risk? A solid, up-to-date allocation is the foundation of everything that follows.

    2. Assess Your Current Portfolio: Next, it's time for a snapshot of your portfolio right now. Tally up the current value of each of your asset classes—U.S. stocks, international stocks, bonds, etc.—and calculate what percentage each one represents of your total portfolio. This is where you'll see exactly how far the market's ups and downs have pushed you off course.

    3. Calculate the Difference: This part is just simple math. With your target percentages and your current percentages in hand, subtract one from the other. This instantly shows you which assets are overweight (they've grown bigger than planned) and which are underweight (they've shrunk or been outpaced). You now have a crystal-clear roadmap for what to sell and what to buy.

    4. Execute the Trades: Now for the final step: taking action. Sell just enough of your overweight assets to bring them back down to their target percentage. Then, take that cash and use it to buy more of your underweight assets until they're back up to their target.

    A critical piece of the puzzle here is taxes. To sidestep a surprise bill from Uncle Sam, always try to do your rebalancing inside tax-advantaged accounts like a 401(k) or IRA first. Trades inside these accounts don't trigger capital gains taxes.

    By doing the heavy lifting in your tax-sheltered accounts, you can often get your entire portfolio back in line without having to sell anything and create a taxable event in your brokerage account. Getting this process right reinforces the core principles of a smart, well-built investment plan. For a deeper dive on setting up that structure, check out our guide on how to diversify an investment portfolio.

    Common Rebalancing Mistakes and How to Avoid Them

    Even with a rock-solid plan, it's surprisingly easy to shoot yourself in the foot when rebalancing. One of the classic blunders is over-trading—basically, fiddling with your portfolio way too often. It might feel like you're being proactive, but all you're really doing is racking up transaction fees and possibly triggering capital gains taxes that eat into your returns.

    Then there's the biggest portfolio-killer of all: letting your emotions call the shots. The whole point of a rebalancing strategy is to take your gut feelings out of the equation. It feels completely wrong to sell a stock that's on a hot streak or buy more of one that's been struggling. But the moment fear or greed starts dictating your moves, you've defeated the purpose of this disciplined approach.

    Forgetting About Fees and Taxes

    Ignoring the small stuff, like transaction costs, is another huge mistake. Those fees might seem minor, but they add up fast, especially if you have a smaller portfolio and rebalance aggressively. Research actually shows that these costs directly influence how and when fund managers rebalance, especially when there's a big performance gap between different assets. If you're curious about the nitty-gritty, you can check out this paper on how transaction costs impact fund rebalancing.

    A successful rebalancing strategy is as much about what you don't do as what you do. Avoiding frequent, emotionally-driven trades and keeping a close eye on tax implications are just as important as the rebalancing itself.

    If all this sounds like a headache you'd rather avoid, you're not alone. For investors who prefer a more hands-off approach, automated options like target-date funds or robo-advisors handle all of this for you. They keep your portfolio aligned with your targets automatically, making them a fantastic way to sidestep these common pitfalls.

    Getting these details right is a massive part of smart, long-term investing. You can dive deeper into other great habits in our guide to portfolio management best practices.

    Your Top Rebalancing Questions, Answered

    Even when you've got the basics down, some of the finer points of rebalancing can be tricky. Let's tackle some of the most common questions that pop up.

    How Often Should I Rebalance My Portfolio?

    There's no single "right" answer here—it really boils down to the method you're most comfortable with.

    Many investors love the simplicity of a calendar-based approach, rebalancing on a set schedule like annually or quarterly. It’s simple and keeps you disciplined. Others prefer a threshold-based method, which ignores the calendar completely and only triggers a rebalance when an asset class drifts by a certain amount, say 5% from its target.

    Does Rebalancing Actually Increase My Returns?

    Not really, and honestly, that’s not the point. Think of rebalancing as a risk-management tool, not a magic bullet for higher returns.

    Its real job is to keep your portfolio from getting too top-heavy in one area and drifting away from your long-term goals. While it naturally forces you to "buy low and sell high," its main superpower is keeping your risk level exactly where you want it.

    What Are the Tax Implications of Rebalancing?

    This is a big one, and you’re smart to ask. When you sell winning investments in a regular taxable brokerage account, you’ll likely trigger capital gains, and Uncle Sam will want his cut.

    To be smart about it, always try to rebalance inside your tax-advantaged accounts first, like a 401(k) or an IRA. Trades within these accounts don't create a taxable event, which is a huge advantage.

    A slick way to rebalance without selling is to use your new contributions. Instead of trimming your winners, just direct your new investment dollars into the parts of your portfolio that are underweight. This nudges your allocation back into line over time without creating a tax bill.

    It's a gentler, more tax-efficient way to get your portfolio back on track.


    Ready to stop guessing and start building conviction? The Investogy newsletter offers a transparent look at how a real-money portfolio is managed, sharing deep research and actionable insights every week. See the strategies in action and learn from real results by subscribing for free at https://investogy.com.

  • When to Sell Stocks Your Guide to Smart Investing

    When to Sell Stocks Your Guide to Smart Investing

    Knowing when to sell a stock is easily the hardest part of investing. More often than not, the decision is driven by raw emotion rather than a clear-headed strategy. The secret to success is reframing the sale. It's not an admission of failure or a moment of panic, but a calculated, strategic move in your long-term game plan.

    Why Selling Is Harder Than Buying

    It’s a strange paradox, isn't it? We spend countless hours researching which stocks to buy, digging through financials, and waiting for that perfect entry point. But when it comes to the other side of the trade—knowing when to actually sell—many investors just go with their gut, swayed by market noise instead of a concrete plan.

    Image

    This hesitation is deeply rooted in some powerful psychological biases that mess with our decision-making. The fear of missing out (FOMO) on future gains can keep us holding onto a winning stock for way too long. On the flip side, loss aversion—the simple fact that the pain of losing feels about twice as strong as the pleasure of gaining—can make us cling to a losing position, just hoping it will eventually claw its way back.

    Selling is not an event; it's a process. The decision should be made before emotions like fear or greed take over your judgment. A predetermined strategy is your best defense against impulse.

    The Reality of Market Sell-Offs

    Market volatility is usually what triggers these emotional reactions, but if you look at the data, pullbacks are a totally normal part of the investing cycle. Since 1929, the stock market has experienced 154 instances of 5% sell-offs. That happens in 92% of calendar years.

    While these dips always feel alarming in the moment, less than a quarter of them ever spiral into a full-blown bear market. And when a 5% drop doesn't get worse? Historically, the market bounces back in about four months. Understanding these patterns can help you stay rational when everyone else is hitting the panic button. You can explore more data on market sell-offs on alphaarchitect.com.

    To get around these challenges, successful investors build a solid selling framework before they even think about clicking the "buy" button. When you have clear, objective criteria for when to sell, you take emotion out of the equation. Selling just becomes another tool in your toolbox for building long-term wealth. This guide will give you the practical frameworks you need to make those tough calls with confidence.

    Selling Based on Company Fundamentals

    Sometimes, the smartest move has nothing to do with the market's daily mood swings. Instead, the most powerful sell signals come directly from the company itself. Your original reason for buying the stock—your investment thesis—is your foundation. If that foundation starts to crack, it’s time to seriously consider heading for the exit.

    Think of it like being a fan of a championship sports team. You back them because they’ve got a star player, a brilliant coach, and a winning strategy. But what happens if that star player suffers a career-ending injury, the coach gets poached by a rival, and the team starts fumbling every game? You wouldn't keep betting your money on them to win it all. The same exact logic applies to your stocks.

    Image

    Spotting the Fundamental Red Flags

    A company’s fundamentals rarely collapse overnight. It’s usually a slow burn, a gradual erosion you can spot if you’re paying attention. Keeping an eye on a few key areas can help you see the cracks forming long before the walls come tumbling down.

    The most glaring warning sign is a consistent decline in earnings or revenue. Sure, one bad quarter can be a fluke, but a steady downward slide over several quarters points to a much deeper issue. It could mean customers are losing interest in their products, or worse, that their entire business model is on the verge of becoming obsolete. Getting comfortable with financial reports is a non-negotiable skill here, and you can learn more about /blog/how-to-read-company-financial-statements/ to sharpen your abilities.

    Another huge red flag is losing market share to competitors. If a rival is consistently out-innovating, undercutting on price, or just plain stealing your company's customers, the long-term growth story you bought into is at serious risk. This is particularly dangerous if your company's "moat"—its unique competitive advantage—is getting narrower.

    A deteriorating fundamental picture is one of the most reliable indicators that it's time to sell. Market sentiment can be fickle, but declining revenue and a shrinking competitive advantage are tangible signs that your investment thesis is broken.

    Changes in Leadership and Industry Disruption

    Never underestimate the power of who’s in the corner office. A major leadership change, like the departure of a visionary CEO or other key executives, can signal a massive shift in corporate strategy that might not align with your reasons for investing. While new leadership can sometimes inject fresh energy, it always, always introduces uncertainty.

    Finally, you have to look at the bigger picture: broad industry disruption. Is a new technology threatening to make your company's core business irrelevant? Just think about what streaming did to video rental stores. If your company is on the wrong side of a massive technological or consumer shift and isn't adapting fast enough, holding on is a bet you probably don't want to make.

    Staying on top of all this is easier with a structured process. To really dig into a company's health, using a comprehensive due diligence checklist can give you a solid framework for your fundamental analysis. Regularly checking in on these core business realities helps you make sell decisions based on facts, not just fear.

    Selling to Improve Your Overall Portfolio

    Knowing when to sell a stock isn't always about reacting to bad news or watching a company stumble. In fact, some of the smartest moves I’ve ever made involved selling a perfectly good, profitable investment. It sounds counterintuitive, I know. But this isn't about ditching a winner; it's about actively managing your portfolio's health, balance, and long-term potential.

    Think of your portfolio like a garden. If one tomato plant absolutely takes off, growing so big it starts blocking the sun and hogging all the water, it can actually hurt the other plants around it. Pruning that monster plant—even though it’s thriving—is exactly what the rest of the garden needs to flourish. The same logic applies to your investments.

    The Discipline of Rebalancing

    The most common reason to sell a winning stock is for portfolio rebalancing. Let's say you started with a rule that no single stock should ever make up more than 10% of your entire portfolio. Then, one of your picks has an incredible year and its value skyrockets, ballooning to 20% or even 30% of your total holdings.

    On the surface, that feels fantastic. But it also means a huge chunk of your financial well-being is now tied to the fate of just one company. A sudden downturn in that single stock could wipe out a massive portion of your gains. Rebalancing is simply the discipline of trimming that position back down to your target, locking in some profit, and putting that cash to work elsewhere. It’s how you ensure your risk exposure stays where you want it to be.

    Image

    This is the constant balancing act of portfolio management: managing risk while chasing rewards. By periodically rebalancing, you stay in control of that dynamic instead of letting the market's whims dictate it for you.

    Better Opportunities and Life Goals

    Another perfectly good reason to sell is to free up cash for a more compelling investment you've uncovered. No stock exists in a vacuum. If you find a new company with what you believe are significantly better growth prospects or a much more attractive valuation, it makes all the sense in the world to sell a current holding to fund that new position.

    Selling a good investment to buy a great one is a hallmark of an active, strategic investor. The goal is to continuously upgrade the quality and potential of your portfolio over time.

    To help clarify these portfolio-driven decisions, let's look at a few common strategies side-by-side.

    Portfolio Management Selling Strategies

    Strategy Primary Goal When to Use It
    Rebalancing Maintain target asset allocation and control risk. When a single position has grown to an outsized percentage of your portfolio, making you overexposed.
    Opportunity Cost Reallocate capital to a more promising investment. When you identify a new stock with a better risk/reward profile than a current holding.
    Diversification Reduce concentration risk from a specific stock or sector. If your portfolio becomes too heavily weighted in one industry (e.g., tech, energy) and you want to spread the risk.
    Goal Funding Convert investment gains into cash for life expenses. When you need money for a planned major purchase, like a home down payment or tuition.

    These strategies aren't about panic-selling. They’re about disciplined, forward-looking decisions that keep your portfolio aligned with your goals.

    Ultimately, the whole point of investing is to help you achieve your personal financial goals. Selling stocks is a natural and necessary step when you need the cash for a major life event. These milestones might include:

    • Putting a down payment on a home
    • Paying for a child’s college education
    • Launching a new business
    • Funding your retirement

    Selling for these reasons isn't a sign of failure; it's the very definition of success. It means your investments did their job. By planning for these events, selling becomes a rewarding and stress-free part of your financial journey. Getting these portfolio-level decisions right is closely tied to your overall asset allocation strategy, a topic we cover in detail in our guide on how to diversify an investment portfolio.

    Using Technical Signals to Refine Your Timing

    While your fundamental homework tells you what to sell, technical analysis can give you some powerful clues about when to pull the trigger. Now, let's be clear: this isn't about perfectly timing the market—that's a fool's errand. Instead, think of it as using price and volume data to get an objective, second opinion on a decision you're already leaning towards.

    I like to think of it this way: fundamental analysis is like checking the long-range weather forecast before a big road trip. It gives you the big picture—should you expect sun or storms ahead? Technical analysis is like checking the real-time radar right before you pull out of the driveway; it helps you pinpoint the best moment to actually start driving.

    Reading the Price Trends

    One of the most straightforward tools in the technical toolbox is the moving average. This simply smooths out the day-to-day price swings to give you a clearer picture of the underlying trend. The 200-day moving average (MA) is a classic benchmark for a stock's long-term health.

    If a stock's price dips below its 200-day MA and stays there, that’s a pretty strong signal. It’s the market telling you that the long-term upward momentum has either stalled out or, worse, started to reverse.

    This isn't just some old trading floor theory; it's a statistically-backed way to manage risk. For instance, a common sell signal is generated when the S&P 500 index itself closes below its 200-day MA, suggesting the whole market is losing steam. You can get a better feel for how these trade signals work on cmgwealth.com.

    This simple check can be the nudge you need to stop holding on and hoping, confirming that your fundamental worries are now showing up in the stock's price action.

    Identifying Key Crossover Signals

    For an even stronger signal, you can watch for when different moving averages cross over each other. These events are watched like a hawk by traders because they often point to a major shift in momentum.

    Two of the most famous crossover patterns have pretty dramatic names:

    • The Death Cross: This sounds grim, and it’s a bearish signal for a reason. It happens when a stock's short-term moving average (usually the 50-day MA) crosses below its long-term moving average (the 200-day MA). It suggests that recent momentum has soured and could be the start of a real downtrend.
    • The Golden Cross: This is the happy opposite. When the 50-day MA crosses above the 200-day MA, it signals a potential long-term uptrend is kicking off.

    The Death Cross isn't a crystal ball predicting a crash, but it's a powerful confirmation. If you've already found fundamental cracks in the company's story, seeing this technical pattern should give you a sense of urgency.

    These signals help take raw emotion out of the decision, giving you clear, data-driven triggers to consider. When you combine your fundamental reasons to sell with this kind of technical confirmation, you build a much more robust case for your decision. And if you really want to get sophisticated, exploring advanced predictive modeling techniques can add another layer of precision to your timing. This two-pronged approach helps you act with more confidence and discipline, which is what successful selling is all about.

    Common Selling Mistakes and How to Avoid Them

    Knowing when to sell a stock is a skill, no doubt. But the biggest hurdle isn't a lack of information or a fancy chart—it's us. Our own human nature. The greatest enemy of a solid selling strategy is almost always our emotional reaction to the market's daily chaos. If you can understand the most common mental traps, you're already halfway to building the discipline you need to succeed long-term.

    These mistakes often feel like the right move in the heat of the moment, driven by powerful instincts like fear and greed. But they are the very reason so many investors underperform, turning small, recoverable dips into major portfolio damage.

    The Panic Sell During a Market Dip

    The first and most classic blunder is the panic sell. The market takes a nosedive, headlines are screaming about a crash, and your gut is telling you to get out now before it all goes to zero. This is a pure, fear-driven reaction, and all it does is turn a temporary paper loss into a very permanent real one.

    History has shown us, time and time again, that market downturns aren't just common; they're an inevitable part of the game. Look at the 2020 crash, when the S&P 500 plunged roughly 34% in just over a month. Or the 2022 slide, which saw a 27.55% drop from the peak. In both cases, the market eventually roared back to new highs. The investors who sold at the bottom? They locked in those painful losses and completely missed the recovery. Wikipedia has a sobering list of major market declines that's worth a look.

    How to Avoid It: Before you even think about buying a stock, write down your long-term plan. Seriously, put it on paper. Acknowledge that volatility is going to happen. When the market inevitably drops, go back and read your plan instead of staring at your portfolio balance. That piece of paper can be the rational anchor you need to stay the course when things get choppy.

    Holding a Loser and the Sunk Cost Fallacy

    The flip side of panic selling is just as dangerous: stubbornly clinging to a losing stock, praying for it to one day recover. This is often fueled by the sunk cost fallacy, a mental trap where we feel like we've already put so much time or money into something that we can't possibly walk away—even when it's clearly a sinking ship.

    We start telling ourselves stories. "I'll just sell as soon as I break even." Here's the hard truth: the market doesn't know or care about your break-even point. A bad investment is a bad investment, whether you're down 10% or 50%.

    How to Avoid It:

    • Set Stop-Loss Orders: When you first buy the stock, decide on the maximum loss you’re willing to take. Set a stop-loss order to automatically sell if it hits that price. This yanks the emotion right out of the decision-making process.
    • Keep an Investment Journal: Write down why you bought the stock in the first place. Was it the strong earnings? A new product? If those fundamental reasons are no longer true, it's time to sell, no matter what the price is.

    The key is learning the difference between a temporary market downturn and a fundamental breakdown in the business itself. It’s about separating price swings from the company's actual performance. To get a better feel for this, check out our guide on what market volatility is and how to manage it. This knowledge helps you react to real changes in the business, not just scary-looking price charts.

    A Few Common Questions About Selling Stocks

    Working through the decision to sell a stock can feel like navigating a maze. It’s totally normal to have questions. Getting a firm grip on the core ideas behind a solid selling strategy is the best way to build the confidence you need to make a move when the time is right.

    Let's tackle some of the most common—and often pressing—questions investors wrestle with, breaking them down into clear, straightforward answers.

    Should I Sell a Stock If It Drops 20 Percent?

    A sudden 20% drop in one of your stocks is enough to make anyone's stomach churn, but it’s not an automatic signal to sell. Your very first move should be to pull out your original investment thesis. Go back to your notes and ask yourself: why did I buy this stock in the first place?

    The real question you need to answer is whether the drop is because of a problem with the company or just a wider market freak-out. If the company’s fundamentals have genuinely soured—maybe they lost their biggest client, a competitor launched a superior product, or their debt is spiraling—then that 20% drop is a justified warning flare. In that scenario, selling is a logical step to protect what you have left.

    But, if the business itself is still humming along and the stock got dragged down in a market-wide correction, that drop might actually be a gift—a chance to buy more at a discount. The trick is to separate the company's story from the market's noise. A great business doesn't become a bad one overnight just because of a temporary dip.

    How Do Taxes Affect My Decision to Sell a Stock?

    Taxes are a huge piece of the puzzle, and honestly, it's one that too many investors ignore until it's too late. How long you've held a stock directly impacts how your profits are taxed, which can make a big difference in your final take-home return.

    Here's the simple breakdown:

    • Long-Term Capital Gains: If you sell a stock you've owned for more than one year, your profit gets taxed at the much friendlier long-term capital gains rate. For most of us, this is the goal.
    • Short-Term Capital Gains: If you sell within a year of buying, that profit is considered ordinary income and taxed at your regular, higher income tax rate. Ouch.

    Now, you should never let the "tax tail wag the investment dog." That means you don't hang on to a failing stock just to get a better tax rate. That's just silly. But being smart about the tax implications is crucial. If you're on the fence about selling and you're getting close to that one-year mark, it might make sense to wait a few more weeks to cross into long-term territory.

    Is It a Bad Idea to Sell a Winning Stock?

    Absolutely not. In fact, knowing when to strategically sell a winner is one of the clearest signs of a disciplined, experienced investor. It’s so important to understand the difference between bailing on a great company and wisely managing your portfolio's overall risk.

    The number one reason to sell a winner is for rebalancing. If a stock has crushed it to the point where it's now a huge, lopsided part of your portfolio, you're overexposed. You’ve got too many eggs in one basket. A sudden reversal in that one stock could do some serious damage to your entire net worth.

    Think of it this way: the goal is to let your winners run, but not to let them run your entire portfolio into the ground if they suddenly reverse course. Trimming a winning position locks in gains and reduces risk.

    Selling a winner can also be a smart move to free up cash for a new opportunity you believe has even more upside. Your job as an investor is to constantly look for the best possible place to put your money. Sometimes, that means selling a good investment to fund what you believe is a truly great one.


    Ready to build a smarter, more disciplined investment strategy? At Investogy, we don't just talk about stocks; we show you how we manage a real-money portfolio, explaining the "why" behind every buy and sell decision. Subscribe to our free weekly newsletter at Investogy to get actionable insights delivered in just 3 minutes.

  • Recommended Asset Allocation Based on Age: Expert Tips

    Recommended Asset Allocation Based on Age: Expert Tips

    As a rule of thumb, your ideal asset allocation tends to shift from aggressive (heavy on stocks) to conservative (heavy on bonds) as you move through life. For instance, a 25-year-old might be perfectly comfortable with a 90% stock and 10% bond portfolio. But fast forward to age 65, and that mix might look more like 40% stocks and 60% bonds to safeguard what they've built.

    The whole point is to make sure your investment risk lines up with your time horizon.

    Matching Your Investments to Your Life's Timeline

    Think of your investment portfolio like a ship setting off on a long voyage. When you're young, with the destination far off in the distance, you can afford to build a faster, more aggressive vessel. This ship is designed to chase high growth, weathering the inevitable storms of market volatility because it has plenty of time to get back on course. The goal is to maximize your returns when you have decades to recover from any market downturns.

    But as you get closer to retirement, your mission changes entirely. It’s no longer about speed; it's about arriving safely in the harbor with all your cargo intact. This is where capital preservation takes over, and your ship needs to be reconfigured to be steadier and more defensive.

    Image

    Why Time Horizon Is Your Greatest Asset

    The core idea behind age-based asset allocation isn’t about trying to time the market—that’s a fool’s errand. It’s about matching your portfolio's risk profile with the amount of time you have left to invest. This strategy hinges on one simple truth: the more time you have, the more risk you can comfortably take on.

    • Growth Engines: Think of stocks (equities) as the powerful engines of your portfolio. They have the highest potential for long-term growth.
    • Portfolio Stabilizers: Bonds (fixed income) are like the ballast in the ship's hull. They provide stability and predictable income to keep things steady during rough seas.

    Getting the balance right between these two asset classes is the key to building a portfolio that serves you well at every stage of life. Of course, this is just one piece of the puzzle. To really build a resilient portfolio, check out our guide on /blog/how-to-diversify-investment-portfolio/.

    The best asset allocation is the one that gives you the highest probability of hitting your financial goals. It's about finding that sweet spot where you aren't taking crazy risks when you can't afford to, but you also aren't being too conservative when you have decades of growth still ahead of you.

    Ultimately, a recommended asset allocation based on age is a roadmap, not a rigid set of rules you have to follow blindly. Life is complicated, and knowing when and how to adjust your investments is crucial. It often helps to get expert advice on portfolio distribution and fund selection to make sure your financial plan is truly built for your own unique journey.

    The Investor's Lifelong Balance of Risk and Reward

    When it comes to investing, time is the most powerful asset you'll ever have. Period. When you're young, with decades stretching out in front of you, you can afford to play offense. Your portfolio can be built for speed—heavy on growth assets like stocks—because you have plenty of time to recover from the market’s inevitable punches. That long runway is what lets the magic of compounding really work its wonders.

    Think about it this way: Sarah starts investing at 25, while Tom holds off until he's 40. Even if they sock away the same amount each year, Sarah has a massive 15-year head start. For her, a market dip in her 30s is just a temporary setback, maybe even a buying opportunity. For Tom, that same dip in his 50s is a code-red, sweat-inducing event.

    Image

    Shifting from Aggression to Preservation

    But as retirement looms on the horizon, the game completely changes. The high-risk, high-reward strategy that built your wealth can suddenly become your biggest liability. With only a few years until you need to start living off that nest egg, a major market crash could be catastrophic. There’s just not enough time left on the clock to wait for a recovery.

    This is when you have to make the crucial pivot from offense to defense. Your focus shifts from aggressive growth to capital preservation. You're no longer trying to hit home runs; you’re protecting the lead you’ve spent a lifetime building. This is where more stable, reliable assets like bonds step up to the plate.

    There's an old rule of thumb that gives a simple framework for this transition. A classic guideline suggests the percentage of stocks in your portfolio should be 100 minus your age. It’s a straightforward way to visualize a gradual shift out of equities and into bonds over time. Following this logic, a 30-year-old might keep 70% in stocks, while a 60-year-old would dial that back to around 40%. For a deeper dive into how this plays out for larger portfolios, you can check out more insights on asset allocation for high-net-worth individuals.

    Why This Evolution Is Necessary

    Pivoting your strategy isn't about getting scared—it's about getting smart. It's a natural and absolutely essential part of any successful long-term investment plan.

    Your financial needs and risk tolerance simply aren't the same throughout your life. It makes sense that your portfolio reflects that.

    • Young Investors (20s-30s): The goal is maximizing long-term returns. Market volatility isn’t a threat; it’s a chance to scoop up assets on sale.
    • Mid-Career Investors (40s-50s): Time to start balancing that growth with a little more protection. You're gradually taking some chips off the table.
    • Pre-Retirees (60s+): The number one priority is protecting your principal and generating a stable income stream.

    The point isn't just to accumulate wealth. It's to make damn sure that wealth is there for you when you actually need it. Adjusting your asset allocation as you age ensures your portfolio evolves with you, protecting you from a devastating loss at the worst possible time.

    This lifelong rebalancing act is the bedrock of turning years of market participation into lasting financial security.

    Building Your Growth Engine in Your 20s and 30s

    If you're in your 20s and 30s, your investing mission is pretty straightforward: go for growth. Hard. During these early career years, your single greatest asset isn't money—it's time.

    With decades of compounding ahead of you, your portfolio can—and should—prioritize building a powerful wealth-creation engine. That means putting the pedal to the metal with a high allocation to stocks.

    The classic recommendation for this stage of life is a portfolio with anywhere from 80% to 95% in equities. That aggressive stance is designed to squeeze every bit of potential return out of the market while your career earnings and investment timeline are at their peak. A market downturn might feel scary, but for you, it's just a chance to scoop up assets on sale, knowing you have plenty of time to recover.

    Crafting a Growth-Focused Portfolio

    So what does an "aggressive growth" portfolio actually look like? It's not about YOLO-ing into a handful of speculative stocks. It's about building a diversified foundation.

    A typical setup for this age bracket is built around a core of broad-market index funds, giving you a piece of hundreds or thousands of companies all at once. From there, you can add other growth-oriented assets.

    • U.S. Market Index Funds: This is your bedrock. Think funds that track the S&P 500 or the total U.S. stock market. They give you a slice of the American economy.
    • International Stocks: You don't want all your eggs in one country's basket. Adding funds that cover developed and emerging markets outside the U.S. is a crucial diversification move. It spreads your risk across different economies.
    • Growth-Focused Equities: This is where you can be a bit more targeted. You might put a smaller slice of your portfolio into individual stocks you believe in or sector-specific funds (like technology) that have higher growth potential—just remember they come with higher risk, too.

    Let's look at how this might break down for a few different investor profiles.

    Sample Asset Allocation for Ages 20-39

    The table below illustrates some typical portfolio breakdowns for investors in their early career stages. Notice how all three prioritize long-term growth by keeping stock allocations high.

    Investor Profile Stocks (Equities) % Bonds (Fixed Income) % Cash/Alternatives % Primary Goal
    Aggressive Growth 90% 5% 5% Maximize capital appreciation
    Growth 80% 15% 5% Strong growth with a small buffer
    Moderate Growth 70% 25% 5% Substantial growth with more stability

    As you can see, even the more "moderate" approach for this age is still heavily weighted toward stocks. The small allocation to bonds and cash is there to provide a little stability without putting a major damper on your growth potential.

    The infographic below paints a similar picture, showing a portfolio dominated by stocks.

    Image

    Mastering the Psychology of Volatility

    Committing to a portfolio that's nearly all stock means you have to get comfortable with volatility. Watching your account balance swing up and down can be tough on the nerves, but it's just part of the game. The real trick is learning to use those market dips to your advantage.

    For a young investor, market volatility isn't the enemy; it's the price of admission for higher long-term returns. The biggest risk isn't a market crash, but rather the risk of being too conservative and letting inflation erode your future.

    One of the most powerful ways to manage this is through dollar-cost averaging. It sounds complicated, but it's simple: you invest a fixed amount of money on a regular schedule, no matter what the market is doing.

    When prices are high, your fixed amount buys fewer shares. But when prices drop? Your money automatically buys more shares.

    This disciplined approach takes the emotion out of investing and turns market downturns from a crisis into an opportunity. By consistently buying in, you systematically lower your average cost per share over time and build a rock-solid foundation for the decades to come. It's the key to keeping your growth engine running at full throttle.

    Balancing Growth and Protection in Your 40s and 50s

    Once you hit your 40s and 50s, the game changes. These are usually your peak earning years, and retirement stops being some far-off, fuzzy idea. It’s a real destination you can see on the horizon. The goal shifts from pure, pedal-to-the-metal growth to a much more deliberate balance—growing your wealth while actively protecting what you've worked so hard to build.

    This is the time to start gradually taking some risk off the table. That doesn't mean you ditch stocks entirely, but you do start beefing up your allocation to less volatile assets, like bonds. The idea is to smooth out the ride, making sure a sudden market correction doesn't derail years of disciplined saving. A portfolio that might have been 90% stocks in your 20s is probably better suited to a 60-70% stock allocation now.

    Image

    This moderate strategy keeps your portfolio moving forward, still aiming to beat inflation. The bigger bond allocation, however, acts like a shock absorber. To really get a feel for how those market swings can rattle your accounts, check out our guide on what is market volatility. This is crucial stuff to understand as you start to prioritize protecting your capital.

    The Growing Importance of Bonds

    In your 40s and 50s, bonds go from being a minor player in your portfolio to a critical, stabilizing force. They provide a much-needed counterbalance to the gut-wrenching ups and downs of the stock market.

    • Income Generation: A lot of bonds pay out regular interest (called coupon payments), which creates a predictable income stream. That predictability becomes incredibly valuable the closer you get to retirement.
    • Lower Volatility: Bonds have historically been way less volatile than stocks. When the stock market tanks, high-quality bonds often hold their ground or even go up in value, cushioning the blow to your overall portfolio.
    • Diversification: Because bonds and stocks often move in opposite directions, they give you true diversification. This is key to lowering your portfolio's overall risk.

    This pivot toward fixed income is a classic move for investors in this age bracket. Data shows that investors with a 10-year horizon often land around a 60% stock, 35% bond, and 5% cash mix to find that sweet spot between growth and risk.

    The goal in your 40s and 50s is simple: have a portfolio that can still grow but won’t give you a heart attack. You’re transitioning from building the engine to reinforcing the chassis for the final leg of your journey.

    Rebalancing Becomes Non-Negotiable

    As you dial in this new target allocation, the discipline of rebalancing becomes absolutely essential. It’s natural for your best-performing assets—usually stocks—to grow faster than everything else. If you don't pay attention, they can slowly take up a bigger and bigger slice of your portfolio, quietly cranking up your risk exposure without you even realizing it.

    Rebalancing is just the simple act of periodically selling off some of your winners and using the cash to buy more of your underperforming assets. This brings you back to your target mix—say, back to that 60/40 stock-to-bond split. It’s a disciplined way to force yourself to sell high and buy low, keeping your portfolio perfectly aligned with your goals and making sure you stay on track for a secure retirement.

    Securing Your Nest Egg for Retirement and Beyond

    Once you hit your 60s and start eyeing retirement—or are already living it—the entire investment playbook gets flipped on its head. The lifelong mission of growing your wealth takes a backseat to a new, more critical priority: preserving what you’ve built and making it last.

    It's a huge shift in mindset. You're no longer trying to hit home runs with your investments. Instead, your focus is on protecting the lead you've worked so hard to create, ensuring that your nest egg can support you for the next 20, 30, or even 40 years. This new game plan calls for a much more conservative portfolio.

    Shifting Gears to Income and Stability

    For most retirees, a smart age-based asset allocation means holding a significant chunk of your portfolio in bonds and cash—often somewhere between 50% to 70%. These assets become the bedrock of your financial security, providing the stability and predictable income you need when a regular paycheck is no longer part of the picture.

    So, why not just go 100% into "safe" assets and call it a day?

    Because your portfolio has a silent enemy: inflation. The smaller portion you keep in stocks, maybe 30% to 50%, is your primary weapon against the rising cost of living. This slice of equity gives your portfolio the growth it needs to ensure your purchasing power doesn't slowly evaporate over a long retirement.

    Your portfolio's construction should emphasize assets that are built to generate a steady stream of cash, such as:

    • Dividend-paying stocks: Think of established, blue-chip companies with a long history of rewarding shareholders. Their consistent dividends can act like a reliable income stream.
    • Government and corporate bonds: These fixed-income workhorses offer regular interest payments and are generally far less volatile than the stock market.

    While these are general principles, your specific situation matters. Federal employees, for instance, have unique options and should look into strategies for maximizing FERS benefits and TSP.

    A conservative allocation is your primary defense against "sequencing risk"—the immense danger of a sharp market downturn occurring just as you begin making withdrawals. A big loss in the early years of retirement can be devastating with no new income to replenish the funds.

    This strategy of de-risking isn’t just some personal finance tip; it’s standard practice for the biggest players in the game. The 2025 Global Pension Assets Study revealed that pension funds all over the world systematically reduce their stock exposure as their members age, shifting into bonds to lock in gains and protect capital.

    This is a powerful lesson in how the pros secure retirement funds. By adopting a similar defensive posture, you can build a nest egg that’s truly built to last.

    Sample Asset Allocation for Ages 60+

    For investors over 60, there's no single "correct" portfolio. It really depends on your personal risk tolerance, income needs, and overall financial health. Some retirees might need more growth, while others will prioritize maximum stability above all else.

    Below is a table showing a few sample portfolio models. Think of these as starting points to help you visualize what a retirement-focused allocation might look like.

    Investor Profile Stocks (Equities) % Bonds (Fixed Income) % Cash/Alternatives % Primary Goal
    Growth-Oriented Retiree 50% 40% 10% Moderate growth to outpace inflation
    Balanced Retiree 40% 50% 10% Income and stability with some growth
    Conservative Retiree 30% 60% 10% Capital preservation and steady income
    Very Conservative Retiree 20% 70% 10% Maximum stability, minimal volatility

    These models illustrate the trade-off between growth potential (stocks) and stability (bonds). As you move from a growth-oriented to a more conservative stance, you're dialing down risk in favor of protecting your principal and ensuring your income streams are as reliable as possible. The key is finding the right balance that lets you sleep well at night.

    Moving Beyond Age to Personalize Your Strategy

    The age-based rules of thumb we've covered are a fantastic starting point for mapping out your investment plan. Think of them as the standard blueprint for a house. It’s a solid, proven design that works well for most people.

    But that blueprint doesn’t know anything about you. It doesn’t account for your specific needs, your personal taste, or the unique piece of land you’re building on. A truly effective financial plan has to be custom-fit.

    Simple age-based guidelines just can't see the full picture. Take two 40-year-olds—they could have wildly different financial lives. One might be a high-earning doctor with a pension, aiming to retire at 55. The other could be a freelance artist with an income that swings month-to-month and a dream of buying a home. A generic recommended asset allocation based on age isn't going to serve them equally. Not even close.

    Tailoring Your Portfolio to Your Life

    To move beyond the blueprint, you have to bring your life into the equation. These are the factors that help you fine-tune your strategy, making sure it aligns perfectly with your real-world circumstances and what you’re actually trying to achieve.

    Three personal factors, in particular, should shape your final allocation:

    • Risk Tolerance: This is your gut-level ability to handle market swings. When the market dives, are you the type to panic-sell, or do you see it as a buying opportunity? An honest self-assessment here is absolutely critical.
    • Financial Goals: Are you on the traditional path, saving for retirement at 65? Or do you have other big goals on the horizon, like paying for a child’s education or starting a business? Goals with a shorter timeline demand a more conservative touch.
    • Overall Financial Health: Think about your job stability, your emergency savings, and any other income you have. Someone with a secure government job and a pension can afford to take on more risk than someone whose income is far less predictable.

    Your portfolio should be a reflection of your entire financial life, not just your date of birth. The goal is to build a strategy that lets you sleep well at night, confident that your investments are working for you.

    For instance, an investor who is comfortable with a bit more risk might decide to lean more heavily into specific market sectors. A great place to start exploring that is by understanding the key differences between growth vs. value stocks.

    Ultimately, the smartest approach is to use the age-based models as your baseline and then adjust—sometimes significantly—for your personal situation. That’s how you build an investment portfolio that is both resilient and truly effective.

    Answering Your Top Questions About Age-Based Investing

    Okay, so you’ve got the core principles down. But when the rubber meets the road, practical questions always pop up. Getting these answers straight is what gives you the confidence to actually manage your money for the long haul, through every up and down the market throws at you.

    One of the first things people ask is how often they should be tinkering with their portfolio. A good rule of thumb is to check in on your allocation at least once a year. Another trigger is if your mix gets seriously out of whack—say, by more than 5% from your target. If a monster bull market in stocks turns your 60/40 portfolio into a 67/33 split, that’s your cue. It’s time to sell some of those winning stocks and buy bonds to bring things back into balance.

    Are Target-Date Funds a Good Shortcut?

    You've probably seen Target-Date Funds (TDFs) offered in your 401(k). They're designed to be a "set it and forget it" solution, automatically shifting your investments to be more conservative as you get closer to retirement. For someone who just wants a hands-off strategy, they can be a fantastic option.

    But here’s the catch: they’re a one-size-fits-all solution. A TDF has no idea about your personal stomach for risk, or if you have other big financial goals outside of retirement. They offer convenience, for sure, but they might not be the perfect fit for your specific financial life.

    The biggest risk for many investors isn't necessarily a market crash, but the quiet, relentless erosion of purchasing power caused by inflation. Being too conservative, especially early on, can be just as damaging as being too aggressive.

    What's the Real Danger of Being Too Conservative?

    Look, protecting your nest egg is absolutely critical, especially as you near the finish line. But being too conservative comes with its own hidden risk. If you’re sitting on a pile of cash or low-yield bonds, you’re almost certainly losing ground to inflation.

    Over 20 or 30 years, inflation is a silent killer for your savings, drastically cutting down what your money can actually buy. Any recommended asset allocation based on age has to walk that tightrope—balancing safety with enough growth to make sure your lifestyle isn't just maintained, but can thrive for decades to come.


    Ready to build conviction in your investment strategy? The Investogy newsletter offers a transparent look into how a real-money portfolio is managed, sharing deep research and honest insights. Subscribe for free at https://investogy.com.

  • How to Invest Like Warren Buffett a Practical Guide

    How to Invest Like Warren Buffett a Practical Guide

    If you want to invest like Warren Buffett, you have to start thinking like a business owner, not a stock trader. It boils down to one core idea: buying shares in wonderful companies at a fair price and then holding on for the dear life, letting the power of compounding do the heavy lifting. His legendary success wasn't built on flashy trades or hot tips; it's a product of discipline, patience, and a genuine understanding of the businesses he owns.

    The Enduring Wisdom of Warren Buffett's Strategy

    Image

    So, why are we still talking about a strategy developed decades ago? Simple: it just works. Buffett's philosophy is all about cutting through the market noise, the rampant speculation, and the flavor-of-the-month trends. There are no complex algorithms or gut-wrenching risky bets here. It's just a logical, repeatable framework grounded in timeless business principles.

    This guide isn't just another puff piece about the "Oracle of Omaha." My goal is to give you a practical, actionable roadmap. We're not here to just admire his track record; we're going to dissect the very methods he used to build it. The point is to show you that his success isn't some kind of magic. It's the result of a consistent process you can learn.

    Core Tenets of the Buffett Approach

    At its heart, Buffett's entire approach is shaped by three foundational ideas. Getting these into your head is the first step toward building real, sustainable wealth instead of just chasing quick, fleeting gains.

    • Simplicity and Understanding: Buffett has famously said, "never invest in a business you cannot understand." This is all about staying within your "circle of competence." If you can't explain how a company makes money to a fifth-grader, you probably shouldn't own it. Avoid industries that are just too complex or wildly unpredictable for you.
    • Discipline and Patience: Let's face it, the market is a rollercoaster of fear and greed. Buffett's real genius is his emotional control. He has the discipline to buy when everyone else is panicking and the patience to sit on his hands when they're getting greedy. For him, the ideal holding period is "forever."
    • Long-Term Value Focus: He doesn't see stocks as little tickers blinking on a screen. He sees them as what they are: partial ownership of a real business. This mindset completely changes the game. Your focus shifts from what the price is doing today to what the company's earning power will be over the next decade.

    "Rule No. 1: Never lose money. Rule No. 2: Never forget rule No. 1."

    Now, this famous quote isn't about avoiding risk entirely—that's impossible. It's a mindset focused on protecting your capital. You do that by doing your homework, demanding a margin of safety (which just means buying a stock for significantly less than you think it's truly worth), and steering clear of catastrophic mistakes. It’s a defensive strategy that, over time, produces some seriously powerful offensive results.

    Adopt the Mindset of a Business Owner

    If you want to invest like Warren Buffett, the biggest change you need to make has nothing to do with fancy spreadsheets or financial models. It starts between your ears. It’s a complete shift in perspective.

    You have to stop seeing stocks as blinking tickers on a screen and start viewing them for what they are: fractional ownership stakes in real, operating businesses. That stock symbol represents a piece of a company with actual employees, products, customers, and a future.

    This isn’t just a cute saying; it changes everything. When you truly think like a business owner, your focus moves away from the daily noise of price swings and toward long-term business performance. You start asking the right questions:

    • Does this company have a real, durable competitive advantage?
    • Is the management team both honest and competent?
    • Is it realistic to believe this business will be earning significantly more money a decade from now?

    This approach forces you to do your homework and genuinely understand what you’re buying. And that brings us to the heart of Buffett's strategy: his famous "Circle of Competence."

    Define Your Circle of Competence

    Buffett has said it a thousand times: "Never invest in a business you cannot understand." This simple idea, the Circle of Competence, is one of the most powerful risk-management tools you’ll ever find.

    It’s not about being an expert in everything. Quite the opposite. It’s about knowing the precise boundaries of what you do understand and staying firmly inside them.

    Let's get practical. Imagine you're a software engineer. You probably have a gut-level understanding of cloud computing, cybersecurity, or AI. This gives you a massive head start when analyzing tech companies. On the other hand, if you have no clue how a mining company extracts ore from the ground or navigates complex global regulations, that industry is probably outside your circle.

    To figure out your own circle, think about this:

    • Your Day Job and Hobbies: What industries do you live and breathe every day? Your career or even a serious hobby can be a fantastic foundation for investment knowledge.
    • Products You Use and Love: Companies whose products you get as a consumer—like Apple or Coca-Cola—are often great places to start your research. You already have a feel for the customer experience.
    • Simple Business Models: Look for companies you can explain to a fifth-grader. If you can't articulate how a business makes money in a few simple sentences, that's a big red flag.

    Sticking to your circle is really just a form of intellectual humility. It stops you from wandering into territory where other investors have a massive, unassailable edge. If you want to dive deeper into this business-owner mindset, there are some great resources that cover crucial financial planning for business owners.

    Master Your Emotions

    Maybe the most famous Buffett-ism of all is to "be fearful when others are greedy and greedy when others are fearful." This is the ultimate test of emotional discipline. The market is a pendulum, constantly swinging between irrational exuberance and unjustified pessimism. Your greatest enemy as an investor is often the person in the mirror.

    During a roaring bull market, stories of overnight crypto millionaires are everywhere. The fear of missing out (FOMO) is intense. This is when others are greedy. A business-owner mindset keeps you grounded, forcing you to ask if the sky-high valuations actually make sense. You can also dig into how to maintain this mindset to strengthen your resolve.

    Then comes the crash. Panic and fear take over. Headlines scream about recessions and financial collapse. This is when others are fearful. A true business owner doesn’t see a catastrophe; they see a sale. It’s a chance to buy wonderful companies at a discount.

    "The stock market is a device for transferring money from the impatient to the patient." – Warren Buffett

    Think back to the 2008 financial crisis. As the market was in a freefall, countless investors sold everything in a panic, locking in devastating losses. What was Buffett doing? He was on a buying spree. Berkshire Hathaway plowed billions into companies like Goldman Sachs and General Electric when they were radioactive to everyone else.

    He wasn't trying to time the bottom. He just understood their long-term value and used the widespread fear as his entry point. Adopting this contrarian-but-rational approach is absolutely essential if you want to emulate his success.

    Find Companies with an Economic Moat

    Image

    Alright, once you've started thinking like a business owner, the next step is to put on your business analyst hat. This is where the real magic of Warren Buffett's philosophy comes into play, and it all boils down to one powerful concept: the economic moat.

    Picture a medieval castle. What kept invaders out? A massive, deep moat. That single defense made the castle incredibly difficult to attack. In the business world, an economic moat does the exact same thing—it’s a durable competitive advantage that shields a company’s profits from the competition.

    Without a moat, even a wildly profitable company is a sitting duck. Big profits are like a beacon, attracting swarms of competitors who will do anything to get a piece of the action. They'll copy the business model, slash prices, and try to poach customers. A strong moat makes this almost impossible, allowing a great company to keep challengers at bay and churn out high returns on capital for years, sometimes even decades.

    Identifying the Different Types of Moats

    Learning to spot these moats is the core of Buffett's strategy. They aren't always glaringly obvious, but they tend to fall into a few key categories. If you get a handle on these, you'll have a solid framework for sizing up just about any business.

    You'll see these moats all over Berkshire Hathaway's portfolio:

    • Intangible Assets: This is one of the most powerful moats out there. It covers things like brand power, patents, and special regulatory licenses. Think of Coca-Cola. Its brand is so deeply ingrained in our culture globally that it gives them pricing power and a level of customer loyalty that some new soda startup could only dream of.
    • Switching Costs: This moat is all about making it a pain for customers to leave. If it’s too expensive, complicated, or just plain risky to switch to a competitor, you've got a sticky business. For instance, once a big company has its entire operation running on Microsoft’s software, the sheer cost and disruption of switching to something else is a massive deterrent.
    • Network Effects: A business with a network effect gets stronger and more valuable every time a new person uses it. American Express is a classic example. Merchants want to accept the card because so many customers use it, and customers carry the card because so many merchants accept it. It's a self-feeding loop that is incredibly tough for a new player to break into.
    • Cost Advantages: Some businesses are just built to do things cheaper than anyone else. This allows them to either crush competitors on price or just enjoy much fatter profit margins. GEICO, one of Buffett's crown jewels, was built from the ground up on a low-cost, direct-to-consumer model that consistently undercut the old-school, agent-based insurance companies.

    "The key to investing is not assessing how much an industry is going to affect society, or how much it will grow, but rather determining the competitive advantage of any given company and, above all, the durability of that advantage." – Warren Buffett

    This quote absolutely nails it. It’s not about chasing the next hot trend. It's about finding a fantastic business with a protective barrier that can truly stand the test of time.

    How to Spot a Durable Moat in the Wild

    So, how do you actually find these companies? You won't find them with a simple stock screener. It takes some real detective work, both on the numbers and the story behind them.

    First, check the financial statements for clues. A long history of consistently high profit margins and returns on equity is a huge tell. If a company can maintain those numbers through recessions and booms, it’s a good bet they have some kind of structural advantage.

    Next, zoom out and look at the industry. Is it a bloodbath with dozens of companies fighting for scraps? Or is it a more rational space dominated by a few big players? A stable, predictable industry is often where the strongest moats are found.

    Finally, think about the company's relationship with its customers. Does it have pricing power? If the company jacked up its prices by 10%, would customers walk, or would they grumble and pay up? A company like See's Candies, another Berkshire favorite, can raise its prices every year like clockwork because people love the brand. That's a clear sign of a powerful moat.

    Being able to spot these durable advantages is what separates a good investment from a truly great one. It's the secret sauce behind Buffett's incredible long-term track record. Since 1965, Berkshire Hathaway has generated an annualized return of around 27%, a figure that absolutely dwarfs the S&P 500's average. That kind of outperformance comes directly from a disciplined focus on buying wonderful businesses protected by strong, sustainable moats. You can explore more about his portfolio's historical success and strategy.

    Calculate Value and Demand a Margin of Safety

    So you've found a fantastic business with a real, durable economic moat. Great. Now comes the part where you have to put on your analyst hat and separate emotion from the equation. This is where the true discipline of Warren Buffett’s approach really makes a difference.

    Finding a wonderful company is only half the battle. You have to buy it at a fair price—or even better, a wonderful price.

    This all comes down to two concepts that are absolutely non-negotiable in Buffett's world: figuring out a company's intrinsic value and then demanding a serious margin of safety. As he famously says, "Price is what you pay; value is what you get." These two steps are how you make sure you’re getting a lot more value than you’re paying for.

    Understanding Intrinsic Value

    At its core, intrinsic value is just the "real" worth of a business. Think of it as the sum of all the cash that business will spit out for its owners over its entire life, discounted back to what that cash is worth today.

    This number has absolutely nothing to do with the stock price you see flashing on your screen, which can bounce around like a yo-yo based on fear, greed, or the news of the day. A stock might be trading at $50, but its actual intrinsic value could be closer to $80.

    Pinning down this number with perfect accuracy is impossible—it requires you to estimate future cash flows, after all. But perfection isn't the goal here. The aim is to land on a reasonable, conservative estimate. A popular way to do this is with a Discounted Cash Flow (DCF) analysis, which involves projecting a company's future free cash flow and then discounting it to its present value. You can take a deeper dive into how to determine intrinsic value in our detailed guide on the subject.

    The real key is to think like you're buying the whole company, not just a little piece of it. If you bought the entire business today, how much cash would it generate for you over the next 10, 20, or even 30 years? Answering that question gets you mighty close to its true worth.

    The Non-Negotiable Margin of Safety

    Once you have a conservative estimate of a company’s intrinsic value, you get to the most crucial step of them all: demanding a margin of safety. This is the bedrock principle that shields your capital from bad luck, your own miscalculations, and the general chaos the market loves to throw at us.

    "The three most important words in investing are margin of safety." – Warren Buffett

    In plain English, this means you only buy a stock when it's trading for significantly less than what you've calculated it's worth. If you figure out a company's intrinsic value is $100 per share, you don't jump in at $95. You patiently wait. You watch from the sidelines until it's on sale for $70, $60, or maybe even less during a market panic.

    That gap between the value ($100) and your purchase price ($60) is your margin of safety. It's your buffer against being wrong.

    Image

    As you can see, the concept isn't rocket science. It’s just a disciplined buffer you build between what a business is actually worth and what you're willing to pay for it.

    Applying This Concept in the Real World

    Let's walk through a quick, practical example. Imagine you've analyzed a solid, predictable company—we'll call it "Durable Goods Inc." After pouring over its financials and growth prospects, you conservatively estimate its intrinsic value to be $150 per share.

    Now, it's time to apply your margin of safety. To be conservative, let's say you insist on a 30% discount from your intrinsic value estimate before you'll even consider buying.

    The table below breaks down what that looks like in practice.

    Applying a Margin of Safety Example

    Metric Calculation/Rationale Example Value
    Intrinsic Value Per Share Your conservative estimate of the company's true worth based on future cash flows. $150
    Required Margin of Safety The percentage discount you demand for protection against errors and market volatility. 30%
    Dollar Value of Safety Margin The actual dollar amount of your discount. Calculated as $150 * 0.30. $45
    Maximum Buy Price The highest price you're willing to pay. Calculated as $150 – $45. $105

    Your job is now crystal clear. You will only consider buying shares of Durable Goods Inc. if the stock price drops to $105 or below. If it’s trading at $120, you wait. If it’s at $140, you patiently watch. This simple discipline is what prevents you from overpaying, which is easily the number one killer of investment returns.

    Build and Manage Your Portfolio for the Long Term

    Image

    Picking wonderful companies at fair prices is a huge win, but honestly, that’s only half the battle. How you assemble and manage those holdings—your portfolio strategy—is every bit as crucial to your long-term success.

    Warren Buffett’s approach to building a portfolio is famously simple and, frankly, profoundly effective.

    It all boils down to one core belief that flies in the face of today’s hyperactive financial world: doing nothing is often the most profitable action you can take. If you really want to invest like Buffett, you have to get comfortable with patience and strategic inactivity.

    His ideal holding period is famously "forever." This isn't just a snappy quote; it's a philosophy built on the mathematical magic of compounding.

    "Only buy something that you'd be perfectly happy to hold if the market shut down for 10 years."

    This single idea forces you to ignore the short-term noise of the stock market and focus entirely on the long-term earning power of the business. It’s your best defense against making emotional, knee-jerk decisions driven by scary headlines.

    Concentration vs. Diversification

    One of the most debated parts of Buffett's strategy is his take on diversification. Most financial advisors preach spreading your money far and wide to lower your risk, but Buffett charts a different course. He believes that for investors who've really done their homework, concentration is the key to building extraordinary wealth.

    His logic is simple. Why would you sprinkle your money across dozens of so-so ideas when you could make large, meaningful bets on your absolute best ones? Just look at Berkshire Hathaway's portfolio. It's a classic example, often having a massive chunk of its equity value tied up in just a handful of companies like Apple and Coca-Cola.

    But—and this is a big but—Buffett offers completely different advice for the average person who doesn't have the time or expertise for deep-dive business analysis. For them, he’s a huge fan of a simple, diversified approach.

    The Famous 90/10 Portfolio

    For most people, Buffett has recommended a straightforward, low-cost strategy that anyone can follow. His advice? Put 90% of your money in a low-cost S&P 500 index fund and the other 10% in short-term government bonds.

    This simple setup lets you ride the long-term growth of America's best companies without the pressure of picking individual stocks.

    The 90/10 split strikes a great balance, aiming for aggressive growth while keeping a small cushion for stability. Looking back, a portfolio with this allocation from 2005 to 2025 delivered positive returns in 62% of months, showing it can hold its own through different market cycles.

    The Power of Doing Nothing

    Whether you go with a concentrated or diversified portfolio, the underlying principle is the same: let your investments do the heavy lifting over decades. The real enemy of great returns isn’t a market crash—it’s unnecessary activity.

    Constantly buying and selling racks up trading fees, triggers taxes, and, more often than not, leads to the classic mistake of buying high and selling low.

    Resisting the urge to constantly tinker with your portfolio is a superpower. When you own a piece of a wonderful business, your job is to sit back and let the management team work their magic. Compounding needs time to work, and interrupting it is one of the most expensive mistakes you can make. If you're looking for a solid starting point, our guide on how to build an investment portfolio lays out a great foundation.

    Your Top Buffett Investing Questions, Answered

    Jumping into value investing can feel a bit like learning a new language. The core ideas are simple enough, but when you actually try to apply them, a million questions pop up. It's totally normal. Let's walk through some of the most common ones that come up when people decide to get serious about investing like Warren Buffett.

    This isn't about finding some magic shortcut. It’s about building the kind of deep-seated clarity and confidence you’ll need to stick with this strategy when things get tough—because they will.

    How Much Money Do I Need to Start?

    This is, without a doubt, the question I hear most often. The answer is incredibly freeing: you need way less than you imagine. The sheer beauty of Buffett's approach is that the principles scale perfectly. The same logic you'd use to invest $100 is the exact same logic you'd use for $100,000.

    These days, with the rise of fractional shares, you can own a slice of even the priciest stocks, like Berkshire Hathaway itself. You absolutely do not need a giant pile of cash to get in the game.

    In fact, starting small is a massive advantage. It gives you room to learn the ropes, make a few of those inevitable early mistakes in analysis, and build your emotional discipline without having significant capital on the line. The key isn't the starting amount; it's the consistency. Methodically investing small, manageable sums into wonderful businesses is infinitely more powerful than waiting for a big lump sum that you’re too terrified to actually invest.

    "The most important investment you can make is in yourself." – Warren Buffett

    That quote has never been more true. Your first "investment" shouldn't even be in a stock; it should be in your own education. Read everything you can, analyze companies for practice, and truly internalize the principles. The money will take care of itself.

    Can I Apply Buffett's Principles to Technology Stocks?

    A fantastic and incredibly relevant question. For decades, Buffett was famous for sidestepping tech stocks. His reasoning was simple: they were outside his "circle of competence." He just couldn't confidently predict what the tech landscape would look like in 10 or 20 years.

    But then he made a massive bet on Apple, and it showed that the principles are what matter, not the industry label. The game hasn't changed; the players on the field just look different now.

    Many of today's tech behemoths have morphed from speculative growth stories into mature, cash-gushing giants with some of the deepest economic moats the world has ever seen. Just think about it:

    • Microsoft: Its grip on enterprise software and cloud services creates monumental switching costs for its customers.
    • Apple: The brand loyalty and closed-loop ecosystem form an intangible asset moat that is the envy of the business world.
    • Google: Its utter dominance in search creates a network effect so powerful it's nearly impossible for a competitor to challenge.

    So, the answer is a resounding yes. You can absolutely apply Buffett's framework to tech stocks, but there's a huge caveat. You must genuinely understand the business and be able to pinpoint a durable competitive advantage. Don't just buy a trendy software company because of the hype. Ask yourself if it has the true hallmarks of a dominant, long-lasting business.

    What Are the Biggest Mistakes to Avoid?

    Trying to be like Buffett is as much about what you don't do as what you do. The biggest mistakes are almost always a result of straying from the core philosophy, which is designed to protect you from the most common ways investors blow themselves up.

    The single biggest mistake? Impatience. Value investing is not a get-rich-quick scheme. It's a get-rich-slowly-but-surely machine. When you try to rush it, you open the door to a whole host of other errors.

    Here are a few critical traps to actively watch out for:

    1. Overpaying for a Great Company: Finding a wonderful business is only half the job. If you get star-struck and pay any price for it, you’ve already lost. Your future returns get vaporized by your entry price. Always, always demand a margin of safety.
    2. Straying Outside Your Circle of Competence: Getting sucked in by a "hot tip" on a biotech or crypto company you don't understand is a classic blunder. If you can't explain the business model to a ten-year-old, just stay away. It’s that simple.
    3. Letting Emotions Call the Shots: Panicking and selling a great business during a market crash is the cardinal sin of investing. On the flip side, getting greedy during a bull run and buying overhyped junk is just as destructive. Your emotions are your worst enemy.

    How Long Does It Take to See Results?

    Ah, the million-dollar question. The honest answer is this: it takes longer than you want it to, but the results are more than worth the wait. This is a long-term game, measured in years and decades, not quarters and months.

    You won't see fireworks overnight. There will be long stretches, sometimes a year or two, where the market couldn't care less about the incredible value you’ve uncovered. Your portfolio might even trail the S&P 500, and you’ll feel the intense pressure to give up and do something else.

    This is the ultimate test. This is where conviction is forged. Remember, you're buying pieces of actual businesses, not just renting tickers. Eventually, the market wakes up and recognizes the true value of a company that is consistently growing its earnings. The "results" come from the quiet, relentless power of compounding. When you own a piece of a truly great business, you're letting its success become your own. Be patient. Let time be your greatest ally.


    Ready to stop guessing and start building real conviction in your investments? The Investogy newsletter offers deep-dive research and transparent insights into a real-money portfolio, showing you the "why" behind every decision. Subscribe for free and see how we apply these principles every week.

  • What Is Book Value Per Share and How to Use It

    What Is Book Value Per Share and How to Use It

    Let's be honest, the world of investing is filled with jargon. Book Value Per Share (BVPS) is one of those terms that gets thrown around a lot, but what does it actually mean for you and your portfolio?

    Think of it this way: if a company had to close up shop tomorrow, sell every last asset, and pay back every single penny it owed, BVPS is what would be left over for each person holding a common share. It’s the liquidation value, on a per-share basis, straight from the company's official books.

    What Is Book Value Per Share Explained Simply

    Image

    Let’s use a simple analogy. Imagine you own a small coffee shop. The value of everything in that shop—the espresso machine, the bags of beans, the furniture, and the cash in the register—adds up to $150,000. These are your assets.

    Now, you also have some debts. Let's say you owe $50,000 in loans for the equipment and outstanding invoices to your suppliers. These are your liabilities.

    If you subtract what you owe from what you own ($150,000 – $50,000), you're left with $100,000. That's your shop's "book value," or its equity. It’s the on-paper, tangible worth of your business.

    Book Value Per Share just scales this idea up to a massive, publicly-traded company and boils it down to a single share. It’s a foundational metric for investors trying to figure out a company's real value, away from all the market noise and daily price swings.

    The Foundation Of BVPS

    At its core, BVPS gives you a valuation baseline. It answers a simple but powerful question: "What is the net asset value backing each share I own?" This is a world away from the stock's market price, which is just what other investors are willing to pay based on feelings, future hopes, and the mood of the market.

    To get the BVPS, you look at the company’s balance sheet. The formula is pretty straightforward: you take the total shareholders' equity, subtract any preferred equity, and then divide that number by the total number of common shares out there.

    For instance, say a company has $10 million in total equity, $1 million of which is preferred stock, and there are 3 million common shares. The book value per share would be $3.00 ($9 million ÷ 3 million shares). You can find more practical examples of how investors use BVPS over on SoFi.com.

    Key Takeaway: Book Value Per Share is a no-nonsense accounting metric. It represents a company's net asset value on a per-share basis, giving investors a tangible anchor point for assessing a stock's underlying worth.

    This metric is a go-to tool for a couple of key investor types:

    • Value Investors: These are the bargain hunters of the stock market. They actively search for companies trading at or even below their book value, seeing it as a sign that the stock might be undervalued.
    • Financial Health Analysts: A steadily increasing BVPS over the years is a great sign. It often indicates that a company is successfully growing its net asset base, which is another way of saying it's creating real, tangible value for its shareholders.

    For a quick summary, this table breaks down the core components of BVPS and what they signal to an investor.

    Key BVPS Components at a Glance

    Component What It Means for Investors
    Shareholders' Equity This is the company's total assets minus its total liabilities—the net worth on the books. A higher number is generally better.
    Preferred Equity This portion of equity belongs to preferred shareholders and must be subtracted to find the value available to common stockholders.
    Outstanding Shares The total number of a company's common shares held by all its shareholders. This is the number we divide by to get the per-share value.

    Ultimately, understanding these pieces helps you see BVPS not just as a number, but as a story about the company's financial stability and its ability to build wealth from the ground up.

    How to Calculate Book Value Per Share Step by Step

    Alright, let's get into the nuts and bolts. Calculating a company's Book Value Per Share (BVPS) might sound like something reserved for Wall Street analysts, but it’s actually something you can absolutely do yourself. You don't need a fancy finance degree—just a company's financial reports and one simple formula.

    At its core, the formula is this:

    (Shareholders' Equity – Preferred Equity) / Common Shares Outstanding = Book Value Per Share

    We'll walk through exactly where to find each of these numbers and what they mean. Think of it as a treasure map leading you to the real value behind each share of a company.

    Image

    As you can see, it’s a clear, methodical process. You just need to grab a few key figures and plug them in.

    Step 1: Find Total Shareholders Equity

    Your first stop is the company’s balance sheet. This document is a snapshot of everything a company owns (its assets) and everything it owes (its liabilities). Shareholders' Equity is simply the difference between the two, and it’s always listed right there on the balance sheet.

    Think of it as the company's net worth on paper, according to its accounting books. If you’re not totally comfortable digging through these reports yet, our guide on how to read company financial statements is a great place to build up your confidence.

    Step 2: Subtract Preferred Equity

    Next up, we need to make an important adjustment. In the corporate food chain, preferred shareholders have a higher claim on the company's assets than common shareholders like us. So, to figure out what’s really left for the common stockholders, we have to subtract the value of any Preferred Equity.

    This is a crucial step to get an accurate picture. The number you're left with is sometimes called the "Book Value of Common Equity." If the company doesn't have any preferred stock issued, you can just skip this step entirely.

    Step 3: Divide by Common Shares Outstanding

    The last piece of the puzzle is to bring this total value down to a per-share basis. You'll need to find the total number of Common Shares Outstanding. This figure is also in the company’s financial reports, usually tucked away in the notes section or sometimes listed directly on the balance sheet.

    Once you have that, just divide the Book Value of Common Equity by the share count, and—voilà—you’ve got your Book Value Per Share.

    Let's run through an example:
    Imagine a company we'll call "Innovate Corp." It reports $500 million in Shareholders' Equity and has $50 million in Preferred Equity. It also has 100 million common shares floating around.

    1. First, we find the equity available to common shareholders: $500M – $50M = $450M
    2. Then, we divide that by the number of shares: $450M / 100M shares = $4.50

    In this scenario, Innovate Corp's Book Value Per Share is $4.50. Easy as that.

    What BVPS Actually Tells You About a Stock

    Image

    So, you've calculated a company's Book Value Per Share. That's a great starting point, but the number itself doesn't tell you much on its own. A BVPS of $20 is pretty meaningless in a vacuum. The real magic happens when you hold that number up against the stock's current market price—what investors are actually paying for it right now.

    This comparison is the whole idea behind the Price-to-Book (P/B) ratio, a classic tool in any value investor's toolkit. Think of BVPS as the Kelly Blue Book value for a used car, based strictly on its make, model, and mileage. The market price is what a buyer is actually willing to pay for it on the lot, which could be way higher or lower depending on its reputation, cool features, or even just the color.

    Reading the Signals: A Stock Above or Below Book Value

    When you compare these two prices—the "sticker price" from the books and what the market is willing to pay—you start to uncover the story the market is telling about that company.

    A stock’s market price can be:

    • Lower than its BVPS: For a value investor, this is often a flashing light. It hints that the stock might be undervalued because you could theoretically buy the company's assets for less than they're worth on paper. But it can also be a red flag. It might mean investors have lost faith and don't believe those assets will generate decent profits down the road.
    • Higher than its BVPS: This is far more common, especially with successful, growing companies. It shows that investors believe the company can crank out future earnings that go way beyond the value of its current assets. This premium you're paying is for things you can't see on the balance sheet, like brand power, brilliant management, and massive growth potential. Our guide on what is intrinsic value digs deeper into how you can start to size up that future potential.

    Key Insight: The gap between book value and market price is really just a measure of investor expectation. A huge gap often means the market has sky-high hopes for growth. A tiny gap, or a stock trading below book, signals a whole lot of doubt.

    Why Context Is Everything

    You can't just apply this logic blindly, because the meaning of BVPS changes wildly from one industry to the next.

    Capital-heavy businesses, like big manufacturers or banks, are packed with physical assets, so they naturally have high BVPS figures. A giant like ExxonMobil, for instance, might have a BVPS somewhere around $47.60.

    On the flip side, a tech powerhouse like Apple, whose real value is tied up in its iconic brand and intellectual property, might have a BVPS around $5 or $6. This is true even when its stock is trading for over $150 a share.

    At the end of the day, BVPS isn't a simple "buy" or "sell" signal. Think of it as a solid, tangible anchor for your valuation. By comparing it to the market price and, just as importantly, considering the industry it operates in, you can get a much richer, more nuanced understanding of a stock's true worth and its potential.

    Like any tool in an investor's toolkit, Book Value Per Share (BVPS) has its moments to shine and other times when it can be flat-out misleading.

    Figuring out this dual nature is the key to using the metric wisely. No single number ever tells the whole story, and BVPS is certainly no exception. Its real power comes from knowing exactly when to lean on it and when to look for other clues.

    Where BVPS Shines

    A huge plus for BVPS is its stability. Think about it: a stock's market price can swing like a pendulum on any given day based on news, rumors, or just the market's mood. Book value, on the other hand, is anchored to the company's balance sheet.

    This makes it a much calmer, more grounded reference point for a company’s underlying worth. It's updated quarterly, not second-by-second.

    Because of this, BVPS is a cornerstone of value investing. It’s how investors find their "margin of safety," hunting for stocks trading near or even below their book value. The idea is to build in a buffer against all that market craziness.

    The Major Blind Spot: Intangible Assets

    But here’s the biggest knock against BVPS: it’s kind of stuck in the past. The metric was designed for an industrial age of factories, machinery, and physical inventory. That's not the world we live in anymore. Today, many of the world's most valuable companies build their empires on assets you can't touch or easily count.

    The core limitation of book value is that it often fails to capture the immense worth of intangible assets. A company's brand reputation, its patented technology, or its brilliant software code might be its most powerful drivers of profit, yet they have little to no value on the balance sheet.

    This creates a serious disconnect. For a hot tech company or a powerful consumer brand, the BVPS can be almost comically low compared to its market value. If you only looked at BVPS, you'd think the company was ridiculously overvalued, when in reality its true strength lies in those invisible assets.

    Other Important Limitations to Keep in Mind

    Beyond its struggle with intangible assets, a few other accounting quirks can throw off the accuracy of BVPS. It's crucial to know about these potential traps before you start drawing any firm conclusions.

    • Historical Cost Accounting: Assets get recorded on the balance sheet at whatever the company originally paid for them. A piece of prime real estate bought for $1 million twenty years ago might be worth $10 million today, but its book value doesn't reflect any of that appreciation.
    • Depreciation's Impact: Accounting rules force companies to depreciate tangible assets over time. This systematically lowers an asset's book value on paper, even if the asset is still chugging along just fine and holding its real-world value.
    • Industry Relevance Varies Wildly: BVPS is super relevant when you're looking at banks, insurance companies, or industrial manufacturers—businesses whose assets are mostly tangible. For software, biotech, or service-based companies? Not so much.

    At the end of the day, BVPS offers a conservative, tangible floor for a company's valuation. It’s a fantastic starting point for your research, but it absolutely must be paired with other metrics to get the full picture of a company’s financial health and future potential.

    Relying on it in isolation is like trying to judge a car's performance by only looking at its weight. It's a piece of the puzzle, but it's not the whole puzzle.

    When to Trust BVPS and When to Be Cautious

    So, how do you know when BVPS is a reliable guide versus a potential trap? This table breaks down its core strengths and weaknesses to help you decide when to put it to work in your analysis.

    Strengths of BVPS Weaknesses of BVPS
    Provides a Stable Baseline: Anchored to the balance sheet, not volatile market sentiment. Ignores Intangible Assets: Fails to value brands, patents, and intellectual property.
    Excellent for Value Investing: Helps identify potentially undervalued stocks with a margin of safety. Uses Outdated Asset Values: Historical cost accounting doesn't reflect current market prices.
    Offers a Conservative "Floor": Represents a company's tangible, liquidation value. Can Be Misleading for Modern Industries: Less relevant for tech, software, and service companies.
    Simple and Easy to Calculate: The data is readily available in quarterly financial reports. Depreciation Skews the Numbers: Accounting rules can artificially reduce asset values.

    Understanding both sides of this equation is what separates a novice from an experienced investor. It helps you use BVPS as the sharp, effective tool it can be, rather than a blunt instrument that leads you astray.

    BVPS in the Real World: Comparing Different Industries

    Theory is one thing, but seeing Book Value Per Share in action is where it really clicks. You quickly learn that BVPS isn't a one-size-fits-all metric. Its usefulness can swing wildly depending on what kind of business you're looking at.

    Let’s take two completely different companies: a classic, old-school industrial manufacturer and a modern software company.

    For the manufacturer, BVPS is often a rock-solid, incredibly relevant number. Think about it—this kind of company is all about tangible, physical stuff. We're talking factories, heavy machinery, and warehouses full of inventory. All these assets are neatly tallied up on the balance sheet, creating a substantial and meaningful book value.

    In this world, BVPS can act as a realistic floor for the company's stock price. If the market price starts flirting with the book value per share, value investors' ears perk up. It could be a screaming buy signal, suggesting the market is overlooking a massive base of hard assets.

    The Software Company Conundrum

    Now, let's flip the script and look at a software company. Here, the story is turned completely on its head.

    The most valuable assets this company owns aren't things you can touch. They're intangible—proprietary code, powerful brand recognition, patents, and the viral network effect of millions of users. These are the real engines of growth and profit.

    But here’s the problem: under traditional accounting rules, these incredibly valuable assets barely show up on the balance sheet, if at all. This means the software company's BVPS is often ridiculously low compared to its stock price. An investor who only looks at this metric would probably dismiss the stock as absurdly overvalued and move on.

    The Key Takeaway: BVPS is a superstar when it comes to valuing companies loaded with tangible assets. But it really struggles to capture the true worth of businesses built on intellectual property and brand loyalty. That huge gap you often see between market price and book value? That's the market putting a price tag on all those "invisible" assets.

    Why This Comparison Matters for Investors

    This contrast gets to the heart of why context is everything in investing. A low Price-to-Book ratio might lead you straight to an undervalued manufacturer, but it could also make you completely miss out on the next big thing in tech.

    Learning to spot which industries are "book value friendly" is a massive advantage for anyone figuring out how to identify undervalued stocks.

    History backs this up. Just look at what happened during the 2008 financial crisis. Banks, which are heavy on tangible assets (loans, securities), saw their BVPS get crushed as those assets were written down. Citigroup, for example, saw its BVPS crater from around $40 to under $10 as its capital base vanished. That number was a direct reflection of its deteriorating financial health. It shows just how powerful BVPS can be as a gauge of stability—in the right sectors.

    Common Questions About Book Value Per Share

    As you start to get the hang of using book value per share, a few questions always seem to pop up. Think of it as leveling up—you've got the basics down, and now you're running into the trickier real-world scenarios.

    Let's walk through a few of the most common ones. Getting these sorted will help you analyze companies with a lot more confidence.

    Can a Company Have a Negative Book Value Per Share?

    Absolutely, and it's almost always a massive red flag. A company lands in negative BVPS territory when its total liabilities balloon past its total assets.

    Put simply, this means that even if the company liquidated everything—sold off every desk, computer, and factory—it still wouldn't have enough cash to pay back its debts. The common shareholders would be left with nothing.

    This is often the sign of a business in serious financial distress, usually after years of losing money have completely eroded its equity. While there are rare turnaround stories, a negative book value per share is typically screaming "high-risk investment."

    Is a Low Price-to-Book Ratio Always a Good Sign?

    Not necessarily. A Price-to-Book (P/B) ratio under 1.0 is the classic signal of a potentially undervalued stock, but it can just as easily be a "value trap." The market isn't dumb; sometimes a stock is cheap for a very good reason.

    Think about it: that low price could be reflecting some deep, underlying problems. Maybe profits are in a free fall, the entire industry is facing headwinds, or the management team is making poor decisions. A real bargain is usually a company with a low P/B ratio and other signs of health, like steady earnings or a solid competitive moat.

    The key is to ask why the P/B ratio is so low.

    A low P/B ratio isn't an automatic buy signal; it's a signal to start digging deeper. It tells you where to look for potential opportunities, but the real work is figuring out if you've found a hidden gem or a falling knife.

    What Is the Difference Between BVPS and Tangible BVPS?

    This is a great question because it gets into a more refined way of looking at a company's assets. Tangible Book Value Per Share (TBVPS) is a stricter, more conservative version of the standard calculation.

    It takes the formula a step further by stripping out all intangible assets before doing the division. We're talking about things like goodwill, patents, trademarks, and brand recognition—assets that are often subjective and tricky to value accurately.

    By focusing only on a company's physical, touchable assets, TBVPS gives you a "harder" number. It's especially useful when you're looking at banks or heavy industrial companies, where the value of physical assets is paramount. It’s a way of asking, "In a true worst-case liquidation, what could we really sell off?"


    Ready to move beyond theory and see how these concepts apply to a real-world portfolio? The Investogy newsletter offers a transparent look at how our team manages a real-money portfolio, explaining the "why" behind every decision. Subscribe for free at Investogy to start building your conviction.

  • What Is Free Cash Flow? Key Insights for Investors

    What Is Free Cash Flow? Key Insights for Investors

    When you hear about a company's financial performance, you'll often see big numbers like revenue and net income thrown around. But if you want to know what's really going on under the hood, you need to look at Free Cash Flow (FCF).

    FCF is the actual, spendable cash a business has left over after paying for everything it needs to run and grow. It's the company's "take-home pay"—the money that’s truly free to be used for things like paying down debt, rewarding shareholders with dividends, or snapping up a competitor, all without needing to borrow a dime.

    Why Free Cash Flow Is a Big Deal for Business Health

    Image

    Let’s bring this home for a second. Think about your own finances. Your salary is your revenue, but that’s not what you can actually spend on fun stuff. First, you have to cover the essentials—your mortgage, groceries, car repairs, and all the other bills.

    Whatever is left after paying for those necessities is your real financial surplus. It's the cash you can use to invest, save for a vacation, or just have as a safety net.

    Free cash flow is the exact same concept, just for a business. It gives you a brutally honest look at a company's financial strength because it’s all about cold, hard cash, not just accounting profits. While net income is a decent metric, it can sometimes be misleading because it includes non-cash expenses like depreciation. FCF cuts through the noise.

    Cash Is King: The Investor's Perspective

    For investors and analysts, FCF is where the rubber meets the road. It answers the most important questions about a company's ability to survive and thrive. A business that consistently spits out a lot of free cash is a business with options. It proves the company isn't just profitable on paper—it's also incredibly efficient at turning those profits into actual cash in the bank.

    "The value of any business is the cash it’s going to produce from now until kingdom come, discounted back to today."

    That's a philosophy famously championed by investing legends like Warren Buffett, and it gets right to the heart of why FCF is so critical. A company with healthy free cash flow can do a lot of powerful things:

    • Fuel its own growth: It can pour money into new projects, upgrade equipment, and fund R&D without begging the bank for a loan.
    • Reward its owners: It has the cash to pay dividends to shareholders or buy back its own stock, both of which can boost shareholder value.
    • Survive the tough times: When the economy gets rocky, a big pile of cash is the ultimate safety net. It allows a company to keep the lights on when less-prepared competitors are struggling.
    • Go on the offensive: Strong cash flow is the war chest a company uses to acquire other businesses, expanding its reach and capabilities.

    Whether you're an investor sizing up a stock or a business owner assessing a competitor, understanding FCF is non-negotiable. It's a key part of the puzzle, especially when it comes to things like the role of a business broker in buying or selling a company.

    If you want to get comfortable digging into the reports where these numbers live, our guide on how to read company financial statements is the perfect next step.


    Free Cash Flow at a Glance

    To make this even clearer, here's a quick table breaking down the core ideas behind Free Cash Flow. Think of it as your cheat sheet for understanding this crucial metric.

    Concept Brief Explanation
    Definition The cash a company has left after paying for operations and capital expenditures.
    Why It's Important Measures a company's true ability to generate cash, not just accounting profit.
    Investor View Seen as a sign of financial health and operational efficiency.
    Positive FCF Indicates the company has surplus cash to repay debt, pay dividends, or invest.
    Negative FCF May signal that a company is investing heavily in growth or facing financial issues.
    Key Use Valuing a business, assessing financial flexibility, and predicting future performance.

    This table sums it up nicely: Free Cash Flow isn't just another number on a spreadsheet. It's a direct indicator of a company's real-world financial power and flexibility.

    How to Calculate Free Cash Flow

    Figuring out a company's free cash flow is way more straightforward than it sounds. You definitely don't need a finance degree to get a handle on it. While there are a couple of ways to do the math, they both tell the same core story about a company's real financial muscle.

    Let's break them down.

    The most common path starts with a number called Cash Flow from Operations (CFO). You can grab this figure directly from a company's Statement of Cash Flows. Think of it as the total cash a company's main business—selling widgets, providing a service, whatever it is they do—actually brought in the door.

    From that starting point, you just subtract Capital Expenditures (CapEx). This is the money a company sinks into buying or upgrading its physical assets, like new factories, better computers, or a fleet of delivery trucks. It's the cost of keeping the lights on and, hopefully, investing in future growth.

    This infographic lays it out visually, showing how the key numbers from the financial statements all funnel into the final FCF calculation.

    Image

    As you can see, the big idea is simple: start with all the cash the business generates, then take away the cash it had to spend just to maintain its operations and equipment.

    The Standard FCF Formula

    The classic formula for FCF is clean and to the point. All you need are two numbers from the Statement of Cash Flows.

    Free Cash Flow = Cash Flow from Operations – Capital Expenditures

    Let's walk through a quick example. Imagine a local coffee chain, "Morning Brew Inc."

    • Cash Flow from Operations: Over the past year, Morning Brew generated $20 million in cash from selling coffee, pastries, and merch.
    • Capital Expenditures: During that same time, they spent $5 million on new, high-tech espresso machines and a major renovation for three of their busiest cafes.

    Plugging those numbers into the formula, their free cash flow is $20 million – $5 million = $15 million. That $15 million is the actual, spendable cash the company has left. They can use it to pay down loans, buy back stock, pay dividends to shareholders, or just stash it away for a rainy day.

    An Alternative Calculation Method

    There's another way to get to FCF that starts with Net Income. This route is a bit more involved because you have to add back some non-cash expenses (like depreciation) and adjust for changes in working capital.

    The formula looks a little more complex:

    FCF = Net Income + Depreciation/Amortization – Change in Working Capital – Capital Expenditures

    While this version has more moving parts, it ultimately gets you to the same place. For most everyday investors, sticking with the first formula is simpler and gives you a perfectly clear picture of a company's ability to mint cash.

    Getting comfortable with FCF is also your ticket to understanding more advanced valuation methods. To see how investors use FCF to figure out what a company is really worth, check out our guide on what is discounted cash flow. It's a powerful technique for estimating a business's true value based on the cash it’s expected to generate in the future.

    Why Investors Focus on Free Cash Flow

    Image

    There’s a classic saying on Wall Street that savvy investors live by: profit is an opinion, but cash is a fact. This gets right to the heart of why they zero in on free cash flow (FCF). It’s the ultimate truth-teller, slicing through accounting jargon to show you what a business really has left in the bank.

    A company that consistently churns out a ton of free cash flow is a company in the driver’s seat. It has the financial muscle to handle unexpected problems or jump on new opportunities without needing to take out loans or issue more stock—a move that waters down the value of your shares.

    At the end of the day, strong FCF is the truest sign of a healthy business. It’s proof that the company’s model isn't just making money on paper; it's actually stacking up real, spendable cash.

    The Power of Financial Self-Sufficiency

    Think of a business with hefty free cash flow as being financially independent. This strength gives it a whole toolbox of options for creating value, all of which benefit shareholders and lock in its future success.

    When a company is flush with cash, it can make some serious moves:

    • Fund Growth Initiatives: It can pour money into R&D, break into new markets, or overhaul its technology, all without asking a bank for permission.
    • Weather Economic Storms: When a recession hits, cash-rich companies don't just survive; they often gobble up market share from weaker competitors who are drowning in debt.
    • Reward Shareholders Directly: A pile of extra cash is what fuels consistent dividend checks and share buyback programs, both of which put money directly back into investors' pockets.
    • Reduce Debt: Paying down loans cleans up the balance sheet, cuts down on interest payments, and dials down the company's overall financial risk.

    This kind of self-reliance is what separates a good company from a great one. It’s a bright, flashing signal to investors that the business isn't just getting by—it's thriving and built to last.

    Translating Cash Flow into Investor Returns

    This focus on FCF isn't just some abstract theory; it has a long, documented history of delivering fantastic results for investors. Because free cash flow is a direct line to a company's ability to generate surplus cash, it often acts as a crystal ball for future stock performance.

    A business's true worth is its ability to generate cash for its owners over the long term. FCF gives investors the clearest view of this capability, making it an indispensable tool for valuation and risk assessment.

    History shows that companies with high and growing free cash flow have been incredibly rewarding investments. For instance, one landmark study revealed that over a 50-year period, a portfolio of high-cash-flow companies delivered an annualized return of 17.7%. That absolutely crushed the broader market, which returned just 11.1% annually during the same stretch. You can dig into the data yourself by exploring more about these historical findings and the power of cash flow kings.

    This performance gap teaches a crucial lesson for anyone trying to understand what is free cash flow and why it’s such a big deal. By focusing on this number, you align yourself with businesses that have a proven knack for creating real, tangible value, year after year.

    So, What Do the FCF Numbers Actually Mean?

    A positive free cash flow (FCF) number looks great on paper, but it doesn't tell you the whole story. To really get a handle on a company’s financial health, you’ve got to learn to read between the lines. A single FCF figure is just a snapshot in time; the real gems are found when you understand the context and trends driving that number.

    Think about a mature, stable company—say, a big utility or a household consumer brand. If you see their FCF growing steadily year after year, that's a classic sign of a healthy, efficient business with a solid grip on its market. But what if that same company suddenly reports declining FCF for a few quarters in a row? That could be a huge red flag, maybe signaling that demand is drying up or costs are spiraling out of control.

    The Story Behind Negative FCF

    On the flip side, negative FCF isn't automatically a disaster. In fact, for a young, high-growth tech startup or a biotech firm deep in the R&D phase, negative FCF is often part of the game plan. It means the company is plowing every dollar it can get back into the business—hiring top talent, building out its products, and grabbing as much market share as possible.

    In these situations, negative FCF is a strategic move, a bet on long-term dominance at the expense of short-term cash. The trick is to figure out why the FCF is negative. Is the company funding a rocket ship to the moon, or is it just a sign of a business model that's fundamentally broken?

    The context behind the numbers is everything. A positive FCF might be hiding some serious problems, while a negative FCF could be a deliberate investment in massive future growth. Your job as an investor is to dig in and find the real story.

    Advanced Metrics for Deeper Insights

    To get past the surface-level number and make some real, meaningful comparisons, smart investors turn to some powerful ratio metrics. These tools help you standardize FCF, so you can compare a small, scrappy business to an industry behemoth on an apples-to-apples basis.

    Two of the most useful ones you'll come across are:

    • FCF Margin: You get this by dividing free cash flow by total revenue. It shows you what percentage of every single dollar in sales the company gets to keep as pure cash. A higher margin is a great sign of profitability and efficiency.
    • FCF Yield: This is calculated by dividing the free cash flow per share by the stock's current price. It gives you a sense of how much cash the company is churning out relative to what the market thinks it's worth. A higher yield can sometimes suggest a stock is undervalued.

    Using these metrics helps you paint a much more detailed picture. You can see not just how much cash a company is making, but how efficiently it’s making it. This is the kind of detail that separates casual stock pickers from serious investors.

    If you’re ready to build on these skills, our guide on performing a complete cash flow analysis is the perfect next step. Adding these tools to your arsenal will completely change how you look at a company's financials.

    Don't Put All Your Eggs in the FCF Basket

    Relying on just one metric, even a powerhouse like free cash flow, is a risky game. I’ve seen it trip up even seasoned investors. The smartest folks I know build a much more complete picture by combining FCF with other signals. One of the absolute best pairings? Free cash flow and price momentum.

    Think of this combo as your secret weapon. Strong FCF tells you a company is fundamentally healthy—a real cash machine. But positive price momentum tells you something equally important: the rest of the market is finally starting to notice that value and is pushing the stock price up.

    When you demand both, you sidestep one of the oldest traps in the book: the "value trap." This is a stock that looks cheap for a very good reason. Maybe its core business is slowly dying. It might still be spitting out decent cash now, but the market’s negative momentum is a huge red flag screaming, "Stay away!"

    The Magic of Mixing Fundamentals with Market Vibe

    Bringing these two factors together is like getting a confirmation from two different, reliable sources. The signal you get is so much stronger than either one could be on its own. You're not just looking for great companies; you're looking for great companies that are getting rewarded by the market right now.

    • Strong FCF: This is your proof of a solid business foundation. It has financial breathing room.
    • Positive Momentum: This shows that other investors are getting on board, creating that sweet upward price pressure.

    This two-pronged approach helps you zero in on businesses that are both well-run and gaining traction. The logic is dead simple: you want to own fantastic companies that everyone else is just starting to fall in love with. This is how you find potential market leaders, not just dusty old bargains nobody wants.

    When strong fundamentals meet positive market sentiment, you identify companies with both a solid foundation and a clear runway for growth. It's the difference between buying a healthy business and buying a cheap one.

    And this isn't just a gut feeling; the research backs it up. Study after study has shown that blending FCF analysis with momentum trading can give portfolio returns a serious boost. By hunting for stocks with high cash flows that are also momentum winners, you’re playing both sides of the coin—the company's real-world performance and its market perception. You can dive deeper into how this powerful combo boosts profits in the full research on momentum and cash flow.

    A Few Lingering Questions About Free Cash Flow

    Once you get the hang of the basics, a few practical questions always seem to pop up. It's one thing to understand the formula, but another thing entirely to apply it in the real world with confidence.

    Let's tackle a few of the most common points of confusion. Think of this as the FAQ section for one of the most important numbers in finance.

    Isn't Free Cash Flow Just the Same as Net Income?

    Absolutely not. If you remember only one thing, let it be this. This is probably the most critical distinction for any investor to grasp.

    Net income is what you see at the bottom of the income statement. It’s an accounting figure, meaning it includes all sorts of non-cash expenses, like depreciation. A company’s profit might look great on paper, but that doesn't mean the cash is actually sitting in its bank account.

    Free cash flow, on the other hand, is the real, cold, hard cash left over after a company pays for everything it needs to run and grow its business. Because it's pure cash, many veteran investors see FCF as a more honest measure of a company’s financial health. After all, you can't pay dividends or buy back stock with accounting profits—only with cash.

    Can a Company with Negative FCF Be a Good Investment?

    Yes, but the context is everything. A young, fast-growing company in a hot sector might have negative FCF for years. Why? Because it’s strategically pouring every single dollar it makes (and then some) back into the business—hiring developers, building new factories, or launching aggressive marketing campaigns to grab market share. For a company in its growth phase, this is often a smart, forward-thinking move.

    A mature company with negative FCF is a potential red flag, while a startup with negative FCF could be a sign of ambitious investment. The story behind the number is what matters.

    Now, if a mature, stable company—think a blue-chip stock that’s been around for decades—suddenly starts bleeding cash and posting negative FCF, that’s a different story. That could signal serious trouble under the hood. You have to dig deeper and ask why the cash is disappearing.

    Where Can I Find the Numbers to Calculate FCF?

    Good news: you don't need a secret decoder ring or an expensive subscription. Everything you need is available for free in a company's public financial reports. The single most important document for this is the Statement of Cash Flows.

    This statement cuts right to the chase and gives you the two main ingredients for the FCF formula:

    1. Cash Flow from Operations (CFO)
    2. Capital Expenditures (This is often listed under a line item like "Purchases of property, plant, and equipment")

    You can find these reports, like the annual 10-K and quarterly 10-Q, directly on a company’s investor relations website. They are also available to the public through the SEC's EDGAR database.


    At Investogy, we cut through the noise by focusing on what truly matters, like free cash flow, to build a real-money portfolio with full transparency. See the "why" behind every investment decision. Subscribe for free to follow our journey and learn with us.

  • How to Read Company Financial Statements

    How to Read Company Financial Statements

    To really get a handle on a company's financial health, you need to look at three core reports: the balance sheet, the income statement, and the cash flow statement. I like to think of it like checking a car before a long road trip. You'd check the engine, the fuel, and the electrical systems, right? Each one tells you something different, but you need all three pieces of information to know if the car is road-worthy. It's the same with a company's financials.

    Why Financial Statements Are Your Investment Roadmap

    Think of these statements as a company's official report card. They’re the real story, cutting through the daily noise of stock price swings and analyst hype to show you how the business is actually performing.

    Learning to read them is a non-negotiable skill for any serious investor. It's the bedrock of an approach called fundamental analysis, which is all about making decisions based on a business's actual performance, not just its stock price.

    These documents aren't just for Wall Street quants. They're a transparent look under the hood, answering critical questions for investors, managers, and lenders alike. The magic is that they all work together.

    To put it simply:

    • The Income Statement tells you if the company made money over a certain period.
    • The Balance Sheet gives you a snapshot of what the company owns and what it owes at a specific point in time.
    • The Cash Flow Statement tracks the actual cash moving in and out of the business.

    Let’s take a quick look at how these three reports work together to give you a complete financial picture.

    The Three Core Financial Statements at a Glance

    This table breaks down what each statement tells you and the main question it helps you, as an investor, answer.

    Statement Type What It Shows Key Question Answered
    Income Statement Profitability over a specific period (e.g., a quarter or a year). Is the company profitable?
    Balance Sheet A snapshot of assets, liabilities, and equity at a single point in time. What does the company own and owe?
    Cash Flow Statement The movement of cash from operating, investing, and financing activities. Where is the cash coming from and where is it going?

    Getting comfortable with these documents has never been more crucial. Companies are facing tougher regulations, which means they're disclosing more detailed information than ever before. In fact, the global market for Financial Statement Services was valued at around $50 billion and is expected to keep growing. This just shows how complex and important this data has become. You can dig into more stats about this growing market on archivemarketresearch.com.

    The real skill isn't just reading the numbers; it's using them to develop insights into what's actually happening with the business. In isolation, each report only tells you part of the story.

    Ultimately, mastering these reports is what separates informed investing from pure speculation. You'll start spotting opportunities that others miss and—just as important—recognizing red flags before they turn into full-blown disasters. This guide will walk you through each statement, breaking down the jargon and showing you exactly what to look for, so you can analyze any company with confidence.

    Decoding the Balance Sheet: What a Company Owns vs. Owes

    Image

    If you only look at one financial statement, make it the balance sheet. Think of it as a financial snapshot, capturing a company's health at a single moment in time. It’s all built on one simple, foundational truth of accounting: Assets = Liabilities + Shareholder Equity.

    What does that really mean? It just means that everything a company owns (its assets) had to be paid for somehow. It either borrowed the money (creating liabilities) or it was funded by its owners and the profits it has saved up over the years (equity). That's it. This simple formula is the framework for understanding a company’s entire financial structure.

    But let's get past the textbook definitions. The real skill is knowing what these categories tell you about a business's stability and where the hidden risks might be lurking.

    Assets: What a Company Owns

    Assets are simply the economic resources a company controls. On the balance sheet, you'll see them listed in order of liquidity—basically, how fast they can be turned into cold, hard cash.

    • Current Assets: These are the resources expected to be used up or converted to cash within a year. We're talking about things like cash and cash equivalents, accounts receivable (money that customers owe them), and inventory sitting in a warehouse.
    • Non-Current Assets: This is the long-term stuff that isn't easily sold off. This includes property, plant, and equipment (PP&E)—think factories, machinery, and office buildings—as well as intangible assets like patents and brand trademarks.

    A healthy company needs a good mix of both. You want enough current assets to cover the day-to-day bills, but you also need those long-term assets to fuel future growth.

    Liabilities and Equity: What a Company Owes

    Now for the other side of the equation. Liabilities and equity show you where the money came from to buy all those assets.

    Liabilities are the company’s debts and financial obligations. Just like assets, they are split up based on when they're due.

    • Current Liabilities: These are the bills due within one year. This includes accounts payable (money owed to suppliers) and any short-term debt.
    • Non-Current Liabilities: These are obligations that don't have to be paid back for more than a year, like long-term debt from bank loans and pension liabilities.

    Shareholder Equity is what's left over for the owners. It’s the residual value after you subtract all the liabilities from all the assets. Its main components are the initial investment from stockholders (common stock) and retained earnings—all the net income the company has piled up over its lifetime.

    A rising retained earnings balance is one of my favorite green flags. It shows the company is not only profitable but is choosing to reinvest those profits back into the business to grow even more, instead of just handing it all out to shareholders.

    Putting It All Together with Key Ratios

    Just looking at the raw numbers doesn't tell you much. The real magic happens when you start comparing them to each other. One of the first and most useful metrics you can pull from the balance sheet is the Current Ratio.

    Current Ratio = Current Assets / Current Liabilities

    This simple calculation instantly tells you if a company has enough short-term cash and assets to cover its short-term bills. A ratio above 1.0 is a good sign, suggesting it can meet its obligations. A ratio below 1.0 can be a major red flag, pointing to potential cash flow problems down the road.

    For example, if a company has $500,000 in current assets and $250,000 in current liabilities, its current ratio is a healthy 2.0. This means it has $2 in liquid assets for every $1 of debt coming due in the next year. It's a crucial first check for financial stability.

    Gauging Profitability With The Income Statement

    Image

    If the balance sheet is a snapshot in time, think of the income statement as the highlight reel of a company's performance. It tells you the story of how much money a company made (or lost) over a specific period, like a quarter or a full year.

    This is why it's often called the Profit and Loss (P&L) statement. Its whole job is to show you whether a business is actually making money, from its very first sale all the way down to the final profit.

    It all kicks off with Revenue—sometimes called Sales. This is the top-line number, representing every dollar the company brought in from selling its products or services. But what a company makes is rarely what it keeps. From here, we start peeling back the layers by subtracting costs.

    From Gross Profit to Operating Income

    The first big chunk to come out is the Cost of Goods Sold (COGS). These are the direct expenses tied to producing whatever the company sells—think raw materials for a car manufacturer or the ingredients for a restaurant. Getting a handle on understanding business expense categories is key to seeing what gets counted here versus what comes later.

    When you subtract COGS from Revenue, you get Gross Profit. This is a powerful metric. It tells you exactly how efficient a company is at its core function of creating and selling its products, before any administrative or marketing costs muddy the waters. A healthy, consistent Gross Profit Margin (Gross Profit / Revenue) is always a great sign.

    Next up, we deduct the Operating Expenses. These are the costs of keeping the lights on and the business running, even if they aren't directly part of the product itself. This bucket usually includes:

    • Selling, General & Administrative (SG&A): This covers everything from the sales team's salaries and marketing campaigns to the rent for the corporate headquarters.
    • Research & Development (R&D): For many companies, especially in tech and pharma, this is a huge expense that fuels future growth and innovation.

    Once those are subtracted, we land on Operating Income. I pay close attention to this number because it shows the profit a company generates purely from its main business activities. It’s a clean look at performance, free from the noise of financing decisions or tax strategies.

    The All-Important Bottom Line

    We're almost there. After accounting for any non-operating items, like interest paid on debt, and finally, income taxes, we arrive at the famous "bottom line": Net Income.

    This is it—the company's total profit after every single expense has been paid. Seeing this number grow consistently year after year is the classic sign of a well-oiled, successful business.

    To really put this number into perspective, we calculate the Net Profit Margin.

    Net Profit Margin = (Net Income / Revenue) x 100

    This simple ratio is incredibly insightful. It tells you what percentage of every single dollar in sales the company actually pockets as pure profit. For instance, a company with a 20% net profit margin is banking $0.20 for every $1.00 in revenue.

    Comparing a company's net profit margin to its own history and, more importantly, to its direct competitors, gives you an instant read on its operational efficiency and standing in the market. Is it a lean operator, or is it struggling to keep costs in check? The bottom line always tells the truth.

    Following the Money with the Cash Flow Statement

    Image

    Profit on paper is one thing, but actual cash in the bank is what keeps the lights on. That's where the cash flow statement comes in. I think of it as the ultimate reality check, showing you exactly where a company's money came from and where it went.

    This statement is the crucial bridge connecting the income statement and the balance sheet. It cuts through the accounting noise and shows how a company's day-to-day operations and big-picture decisions actually affect its cash balance.

    It’s surprisingly common for a business to post a huge profit on its income statement but be teetering on the edge of bankruptcy. How? Because accounting rules include all sorts of non-cash revenues and expenses. The cash flow statement ignores all that and focuses only on what matters for survival: cold, hard cash.

    The Three Core Activities

    This statement is neatly organized into three sections, and each tells a critical part of the company's story. To do a proper cash flow analysis, you really need to understand what each one is telling you.

    • Cash Flow from Operating Activities (CFO): This is the engine room of the business. It shows the cash generated from a company’s main gigs, like selling products or services. A consistently strong, positive CFO is a fantastic sign of a healthy, self-sustaining business.

    • Cash Flow from Investing Activities (CFI): This section tracks the cash a company spends to maintain and grow its operations. Think of it as investing in the future—buying or selling assets like new machinery, buildings, or even acquiring other companies.

    • Cash Flow from Financing Activities (CFF): This part details how a company raises money and pays it back to investors. You’ll see things like issuing or buying back stock, taking on new loans, paying down debt, and, of course, paying out dividends to shareholders.

    Interpreting the Flow of Cash

    When you look at these three sections together, you start to see the full picture. For example, a young, high-growth company might show a big negative number for its investing cash flow. That’s because it’s pouring money into new equipment and facilities to expand. That’s not a red flag; it’s a sign of ambition.

    But here's the catch. If that same company has a negative operating cash flow, it means its core business isn't actually making any money. It's likely relying on loans (financing activities) just to stay afloat. That's a business model that rarely ends well.

    A classic mistake I see investors make is freaking out over any negative number. Context is everything. A huge negative CFI could signal smart, long-term investments, while a huge positive CFF might just mean the company is drowning itself in debt.

    Discovering Free Cash Flow

    One of the most powerful metrics you can pull from this statement is Free Cash Flow (FCF). It’s not always explicitly listed, but it’s simple to calculate yourself:

    FCF = Cash Flow from Operations – Capital Expenditures

    You'll find Capital Expenditures (or CapEx) in the investing activities section—it's the money spent on physical assets. FCF shows you how much cash a company has left over after paying for everything it needs to run and grow. This is the good stuff, the surplus cash it can use to pay dividends, buy back shares, or pay down debt.

    For me, a company that consistently grows its Free Cash Flow is one of the strongest signs of a high-quality, durable business.

    Weaving the Statements into a Single Story

    Looking at a single financial statement is like trying to understand a movie by watching only one scene. You get a snapshot, but you miss the entire plot. The real magic happens when you see how the income statement, balance sheet, and cash flow statement all talk to each other. They're not just separate reports; they're three acts of the same financial drama.

    These connections aren't abstract—they're direct and logical. For instance, the Net Income you see at the bottom of the income statement doesn't just disappear into thin air. It flows straight into the Shareholder Equity section of the balance sheet, usually as an increase in Retained Earnings. This shows you exactly how much profit is being plowed back into the business to fund future growth.

    At the same time, that very same Net Income is the starting line for the cash flow statement. It's the first number you see in the Cash Flow from Operations section, which then adjusts for non-cash expenses (like depreciation) to show you how much actual cash the company generated.

    Seeing the Ripple Effect in Action

    Let’s walk through a simple, everyday business transaction to see how this works. Imagine a company decides to upgrade its equipment and buys a new machine for $100,000, paying in cash.

    Here’s how that one purchase sends ripples across all three statements:

    • On the Cash Flow Statement: You'll see a $100,000 reduction under Cash Flow from Investing. It’s a cash outflow, plain and simple.
    • On the Balance Sheet: The company's cash balance (a current asset) drops by $100,000. But, its property, plant, and equipment (a non-current asset) increases by the same $100,000. The company’s total assets don’t change—the value just shifted from cash to machinery.
    • On the Income Statement: Nothing happens immediately. The cost of the machine will be recognized gradually over its useful life through depreciation, not all at once.

    This single purchase demonstrates the dynamic link between the statements. Grasping these relationships is what allows you to build a complete narrative and, more importantly, spot red flags or inconsistencies that others might miss.

    The infographic below gives a great high-level view of how to put these pieces together to judge a company's financial strength.

    Image

    As the graphic shows, just gathering the data is step one. The real insight comes from calculating the key ratios and figuring out what they mean in the real world.

    The goal is to get past just reading the numbers. You want to weave them into a coherent story about where the business has been and where it's likely heading. This deeper level of understanding is non-negotiable before you can even begin to think about what the business is truly worth.

    Key Ratios from Each Financial Statement

    To help you get started, here's a quick-reference table that pulls together some of the most critical ratios from each statement. Think of it as your cheat sheet for quickly diagnosing a company's health.

    Financial Ratio Source Statement(s) What It Measures Formula
    Current Ratio Balance Sheet A company's ability to pay its short-term debts. Current Assets / Current Liabilities
    Debt-to-Equity Ratio Balance Sheet How much debt a company uses to finance its assets. Total Liabilities / Shareholder Equity
    Gross Profit Margin Income Statement The profitability of a company's core business activities. (Revenue – COGS) / Revenue
    Net Profit Margin Income Statement The percentage of revenue left after all expenses are paid. Net Income / Revenue
    Return on Equity (ROE) Balance Sheet & Income Statement How effectively management is using equity to generate profits. Net Income / Shareholder Equity
    Operating Cash Flow Ratio Cash Flow Statement & Balance Sheet How well current liabilities are covered by cash flow. Operating Cash Flow / Current Liabilities

    This table isn't exhaustive, of course, but it's a solid foundation. Mastering these ratios will put you well on your way to making more informed investment decisions.

    The skills you build by analyzing these statements are universal. They are just as crucial for analyzing real estate investment deals as they are for picking stocks.

    Once you’re comfortable connecting these dots, you’ll be ready for the next step. To truly elevate your analysis, you can learn to master stock valuation methods and pinpoint a company’s intrinsic worth.

    Got Questions? Let's Clear a Few Things Up.

    As you start digging into real-world financial statements, you're bound to run into a few questions. I know I did. These are the sticking points that trip up a lot of people when they're first starting out.

    Let's tackle some of the most common ones head-on. Getting these sorted will make the whole process feel much less intimidating.

    "Great, But Where Do I Actually Find These Statements?"

    Good question. For any public company in the U.S., your official source is the SEC’s EDGAR database. Think of it as the government's massive filing cabinet for all corporate reports. It’s the definitive place to go.

    • The 10-K Report: This is the big one. It's the annual, audited, deep-dive report that gives you the most comprehensive picture of a company's financial year. If you only read one document, make it this one.
    • The 10-Q Report: This is a quarterly update. It's unaudited and less detailed than the 10-K, but it keeps you up to speed on the company's progress throughout the year.

    Pro tip: While EDGAR is the official source, I usually start on the company's own website. Look for an "Investor Relations" section. Most companies post their 10-Ks and 10-Qs there, and the sites are often much easier to navigate.

    "If I Only Look at One Thing, What Should It Be?"

    Tough question, because no single number tells the whole story. But if you put me on the spot, I’d say a consistent history of positive and growing free cash flow (FCF).

    Why? Because cash is king. It's the ultimate sign of a healthy, self-sufficient business. A company with strong FCF is a money-making machine, generating more than enough cash to run its operations. It can then use that extra cash to pay down debt, hand out dividends, or pour it back into growing the business—all without needing outside help. That, right there, is the engine of long-term shareholder value.

    "How in the World Do I Analyze a Company That's Losing Money?"

    This is a great one, especially when you're looking at young tech or biotech companies that are burning through cash to fuel growth. When a business isn't profitable yet, the game changes. You're not buying current earnings; you're betting on future potential.

    Instead of focusing on net income, you have to analyze the company's growth trajectory and its ability to survive until it reaches profitability. The key is understanding their 'cash runway'—how long they can operate before needing more funding.

    Forget net income for a moment. Instead, you need to become a bit of a financial detective and look for these clues:

    • Strong revenue growth on the income statement. Is the top line growing at a healthy clip?
    • A healthy cash balance on the balance sheet. Do they have a war chest to weather the storm?
    • A manageable operational cash burn rate on the cash flow statement. How fast are they spending money, and is it sustainable?

    "What Are the Biggest Red Flags I Should Watch Out For?"

    Spotting trouble early is just as crucial as finding a winner. As you get comfortable reading financial statements, your spidey-senses will start to tingle when something's off. Here are a few major warning signs I always keep an eye on:

    • Consistently negative cash flow from operations: This is a huge one. It means the core business itself is bleeding money, year after year.
    • Rapidly increasing debt: A company piling on debt can be a sign of desperation, especially if profits and assets aren't growing alongside it.
    • Declining revenue or shrinking profit margins: These can be early indicators that a company is losing its competitive edge or facing pricing pressure.
    • Frequent changes in accounting methods: This is a sneaky one. If a company keeps changing how it counts things, it might be trying to paper over poor performance. Be very wary of this.

    Ready to see how all this theory gets put into practice? The Investogy newsletter gives you a transparent, real-money portfolio where I share the research and logic behind every single investment decision. It's a great way to see these principles in action. Join our community of smart investors by subscribing for free at https://investogy.com.

  • How to Identify Undervalued Stocks for Your Portfolio

    How to Identify Undervalued Stocks for Your Portfolio

    Finding truly undervalued stocks is an art, a blend of hard numbers (quantitative analysis) and gut feeling (qualitative judgment). The whole point is to uncover fantastic companies that are trading for less than they're really worth. It's a game plan that champions long-term value over the flashy, short-term hype that dominates the headlines.

    Searching for Value Beyond the Market Hype

    Image

    It's way too easy to get swept up in the latest high-flying growth stock. But the real, lasting growth in your portfolio often comes from digging up those hidden gems. This is all about learning to see what everyone else is missing—spotting a great business whose stock price just hasn't caught up to its true potential yet.

    This mindset is the absolute bedrock of value investing, the philosophy made famous by legends like Warren Buffett. At its core is one simple but incredibly powerful idea: the margin of safety.

    The margin of safety is that critical gap between a stock's market price and what you calculate its intrinsic value to be. This buffer is your shield against bad luck, mistakes in your own analysis, or just a random market downturn.

    Think of it as buying a dollar's worth of a business for fifty cents.

    Now, this doesn't mean you just go out and buy "cheap" stocks. You're looking to buy wonderful businesses at a fair price. That distinction is everything. A stock might be cheap for a very good reason—terrible management, a dying industry, or a mountain of debt. An undervalued stock, on the other hand, is a solid company that the market has temporarily overlooked.

    The Power of a Systematic Approach

    To pull this off consistently, you need a repeatable process, something that marries the numbers with the story of the business. This guide lays out a clear framework to help you do just that. You'll learn how to:

    • Dig into the financials: Go beyond the surface-level numbers to really get a feel for a company's health.
    • Size up the soft stuff: Learn to evaluate things like competitive moats and the quality of the management team.
    • Build real conviction: Develop the confidence to pull the trigger and invest when others are running for the exits.

    This isn't about trying to time the market perfectly. It’s about patiently finding and investing in businesses built for the long haul.

    And history is on our side with this strategy. In the United States, value stocks have historically beaten growth stocks by an average of about 4.4% annually since 1927. That's nearly a century of data showing a persistent value premium. You can learn more about this historical performance from the research at Dimensional Fund Advisors.

    Mastering the Key Metrics for Stock Valuation

    Image

    If you want to find genuinely undervalued stocks, you have to get comfortable with the numbers. Think of these key metrics as your financial compass—they help you cut through the market noise and see if a company's price tag actually matches its real worth.

    Let's dive into the essential ratios that every serious investor needs to have in their toolkit. These are the bedrock of any solid valuation process.

    Decoding the Price-to-Earnings Ratio

    The Price-to-Earnings (P/E) ratio is probably the most famous valuation metric out there, and for good reason. It’s a quick-and-dirty way to see how much other investors are willing to shell out for every dollar of a company's profit. A lower P/E can be a flashing sign that a stock is on sale compared to its peers.

    But—and this is a big but—context is everything. A low P/E ratio is never an automatic "buy" signal. You need to stack it up against two critical benchmarks:

    • Its industry average: A P/E of 12 might look sky-high for a slow-and-steady utility company, but it could be an absolute steal for a high-growth tech firm.
    • Its own history: If a company has consistently traded at a P/E of 25 for years and suddenly dips to 15, that’s your cue to start digging deeper.

    Image

    As the image from Investopedia shows, the P/E gives you an initial read on valuation, but its true power is in comparison. It forces you to ask the right questions about whether the market's expectations are in line with the company's actual performance.

    To help you get a handle on these foundational metrics, I've put together a quick reference table. It's a cheat sheet for what each ratio tells you and what to look for at a glance.

    Essential Valuation Ratios at a Glance

    Metric What It Measures What to Look For Investor Takeaway
    Price-to-Earnings (P/E) The market price per share relative to the company's annual earnings per share. Lower than its industry and historical averages. A low P/E can suggest a stock is undervalued, but always needs context. It's a starting point, not a conclusion.
    Price-to-Book (P/B) Compares a company's market value to its book value (net assets). A ratio below 1.0 is a classic value investing signal. Excellent for asset-heavy industries. It shows what you're paying for the company's tangible assets.
    Debt-to-Equity (D/E) A company’s total liabilities compared to its shareholder equity. Generally, a ratio below 1.0 is considered healthy. This is your financial stability check. High debt can sink a company in tough times.
    Dividend Yield The annual dividend per share as a percentage of the stock's current price. A consistently high and sustainable yield. A solid yield can indicate a mature, stable business that might be undervalued by the market.

    These are the tools of the trade. Getting familiar with them is the first step toward making smarter, more informed investment decisions instead of just following the herd.

    Assessing Tangible Worth with Price-to-Book

    Next on the list is the Price-to-Book (P/B) ratio. This one compares the company's market price to its book value—basically, what would be left for shareholders if the company sold off all its assets and paid every last one of its debts.

    For value investors, a P/B ratio below 1.0 is often seen as a holy grail. It suggests you could be buying the company for less than its net assets are worth.

    This metric really shines when you're looking at asset-heavy industries like banking, insurance, or manufacturing. It gives you a real sense of the hard, tangible value propping up your investment. On the flip side, it's not nearly as useful for businesses light on physical assets, like a software company whose main value is in its code and brand.

    These numbers are all just different ways to get closer to a company's true worth, a concept we often call its intrinsic value. Understanding that core idea is what separates speculation from true investing.

    Gauging Financial Health with Debt-to-Equity

    A company's debt load can tell you a lot about its risk profile. The Debt-to-Equity (D/E) ratio is the metric for this job, measuring total liabilities against shareholder equity. In plain English, it shows you how much the business is running on borrowed money versus its own capital.

    A high D/E ratio can be a major red flag. It might mean the company is leaning too heavily on debt to fund its growth, which ramps up the financial risk, especially when the economy hits a rough patch.

    While the "right" D/E ratio can differ between industries, a figure below 1.0 is generally a good sign of financial prudence. A company with low debt has more breathing room to survive downturns and pounce on growth opportunities.

    Finally, don't forget the Dividend Yield. You calculate it by dividing the annual dividend per share by the stock's price. A high, consistent yield can signal two positive things: the stock might be flying under the market's radar, and management is disciplined about returning cash to its owners. That’s often the mark of a well-run, mature business.

    How to Use Stock Screeners to Find Opportunities

    Trying to sort through thousands of publicly traded companies one by one is a fool's errand. It's an impossible task for any single investor, and honestly, a massive waste of time.

    This is where a good stock screener becomes your secret weapon. Think of it as a powerful search engine for the entire market. It lets you apply a set of filters to sift through the noise and zero in on a manageable list of companies that actually meet your specific criteria.

    Instead of hunting blindly, you can tell the screener exactly what you're looking for, building a list of businesses that already fit your value investing philosophy. This first pass lets you focus your real, deep-dive research efforts where they’ll have the most impact.

    Setting Up Your First Value Screen

    Getting started is pretty straightforward, especially with powerful and free tools like Finviz or Yahoo Finance. The goal here isn't to find the "perfect" company right out of the gate. It's to build a high-quality watchlist that deserves a closer look.

    A great starting point for a classic value screen might include these three filters:

    • Price-to-Earnings (P/E) Ratio: Set this to "Under 15." This helps find companies that aren't priced for perfection and have some room to grow.
    • Price-to-Book (P/B) Ratio: Filter for "Under 1." This targets businesses potentially trading for less than the value of their net assets. It's a classic deep-value metric.
    • Debt-to-Equity (D/E) Ratio: Use "Under 0.5." This weeds out companies that are drowning in debt, giving you a list with healthier balance sheets.

    That simple combination immediately narrows your focus to profitable, asset-rich companies that aren't dangerously leveraged. A universe of over 8,000 stocks might shrink down to a focused list of just 50 or so companies to investigate. Now we're getting somewhere.

    A stock screener is a starting point, not an oracle. Its job is to generate ideas for deeper research, not to give you a final buy list. The real work of analysis begins after the screen is complete.

    This infographic lays out the decision-making process that comes next, turning a simple list of names into a potential investment.

    Image

    As you can see, finding truly undervalued stocks is a systematic process. It involves calculation, comparison, and ultimately, a decisive action based on a solid margin of safety.

    The Art of Screening Beyond the Basics

    Be careful not to set your criteria in stone. A fantastic company might have a P/E of 16 and just barely miss your filter. Another might have a slightly higher D/E ratio because it's investing aggressively in a project with incredible returns.

    The best approach I've found is to run several different screens.

    Try one for "cheap" stocks like the one above. Then, run another for "high-quality" businesses with strong returns on equity. Maybe even create a third screen for "neglected" small-cap companies that the big funds ignore. Each one will unearth a different flavor of opportunity.

    Ultimately, your screener results are just names on a page. The next, and most crucial, step is to take that curated list and begin the real work: the qualitative analysis. That means understanding the business model, its competitive advantages, and the quality of its management team. That’s how you separate the genuine bargains from the value traps.

    Looking Beyond the Numbers with Qualitative Analysis

    Image

    So, your stock screener spat out a tidy little list of potential investments. Great. But that was the easy part. The real work—the stuff that separates the savvy investors from the crowd—begins now.

    Think of it this way: the numbers got you into the right neighborhood, but now you have to knock on some doors. You need to shift from being a data analyst to a business investigator, digging into the qualitative factors that truly define a company's staying power. This is where you find the difference between a genuine bargain and a classic value trap.

    Your first and most important mission is to find the economic moat. It’s a term Warren Buffett coined, and it’s brilliant. He’s talking about a company’s sustainable competitive advantage—that invisible shield that protects its profits year after year from hungry competitors. Without a strong moat, even a great company is vulnerable.

    This advantage can take a few different forms, and your job is to sniff it out. Maybe the company has a powerhouse brand that people are fiercely loyal to, like Coca-Cola. Or perhaps it's protected by unique intellectual property, like a crucial pharmaceutical patent or some piece of software that rivals simply can't copy. Sometimes, the moat is just a brutally efficient, low-cost production model that lets them consistently undercut everyone else on price.

    Identifying a company's economic moat is central to understanding its long-term viability. A business without a durable advantage is like a castle without walls—it’s only a matter of time before it's overrun.

    This deep dive into the business itself is the very essence of fundamental analysis. If you want to go deeper on this core investing discipline, you should check out our detailed guide on what is fundamental analysis.

    Evaluating Management and Industry Position

    A great business can be driven right into the ground by bad leadership. It happens all the time. That’s why your next move is to put the management team under the microscope. You're looking for leaders who aren't just experienced, but who genuinely act like owners with the shareholders' best interests at heart.

    I always look for a few key traits:

    • A history of smart capital allocation: How do they spend the company’s money? Do they reinvest profits wisely to generate killer returns, or do they blow cash on flashy, overpriced acquisitions that go nowhere?
    • Transparency and honesty: Crack open some past annual reports and shareholder letters. Does the CEO speak candidly about both the wins and the losses? Or is it all corporate jargon and sunshine?
    • Significant ownership stakes: This is a big one for me. When the executives own a huge chunk of the company's stock, their interests are perfectly aligned with yours. They feel the pain when the stock drops and celebrate when it rises.

    Finally, you need to zoom out and look at the industry itself. A fantastic company in a shrinking pond is going to struggle, period. You want to find businesses that have a dominant position in an industry that is, at the very least, stable, if not growing.

    The holy grail for an undervalued stock is often a great company dealing with a temporary, fixable problem—some issue that has spooked the market but doesn't actually damage the long-term health of the business.

    Lessons from Market History

    Looking at real-world examples can make this all click. Take Tesla's wild ride after its IPO back in June 2010. The stock debuted at $17 per share. But within about nine months, it had plummeted to roughly $4.

    At that moment, based on its massive growth potential in the budding electric vehicle market, the stock was incredibly undervalued. Investors who did their homework and recognized Tesla's long-term vision had a golden opportunity to buy shares at a massive discount. Of course, hindsight is 20/20, but the signs were there for those willing to look past the short-term noise.

    Ultimately, this qualitative digging adds the essential context to your numbers. It’s the art that completes the science. It’s how you build genuine conviction in an investment before you put your hard-earned money on the line.

    Uncovering Value in Different Market Segments

    True value isn't confined to a single corner of the market. It can pop up anywhere, from booming tech sectors to forgotten industrial giants, but you have to be willing to look where others aren't. Your job as a value investor is to get comfortable applying the same core principles to different market segments to find those hidden opportunities.

    This means being just as ready to analyze a forgotten small-cap company as you are a blue-chip behemoth that has fallen on hard times. The key is adapting your lens to the specific landscape you're exploring. A low P/E ratio, for example, might be a screaming buy signal in one sector but completely normal in another. If you want to get a better handle on this, our guide on understanding the price-to-earnings ratio is a great place to start.

    Hunting for Gems in Small-Cap Territory

    The small-cap space is often fertile ground for finding mispriced assets. These smaller companies, typically with market capitalizations under $2 billion, fly completely under the radar of Wall Street analysts and large institutional funds. Their lower trading volume and lack of media coverage create the exact kind of market inefficiencies a diligent retail investor can exploit.

    Think of it this way: a massive mutual fund often has rules that prevent it from buying tiny companies. This lack of big-money attention means prices can drift far from their intrinsic value, creating the margin of safety we’re always looking for.

    Identifying Temporarily Unloved Sectors

    Another powerful strategy is to hunt for entire industries that have fallen out of favor. This requires a bit of a contrarian streak. When the market sours on a whole sector—like financials during a recession or energy stocks during an oil glut—it often throws the good companies out with the bad.

    This is your chance to pick up industry leaders at bargain-bin prices. The key questions to ask yourself are:

    • Is the industry's downturn cyclical or structural? A temporary headwind is an opportunity; a dying industry is a value trap.
    • Which companies have the strongest balance sheets to weather the storm? Look for low debt and healthy cash flow.
    • What is the long-term outlook for the sector once the current pessimism fades?

    One practical way to do this is by focusing on small-value stocks, which often trade at significant discounts. For instance, as of mid-2025, small-value stocks in the US market were trading roughly 25% below their fair value estimates, making them the most undervalued segment of the market. You can find more insights on these kinds of market segment valuations on Morningstar.com.

    Adopting this flexible, segment-aware approach dramatically expands your hunting ground. It trains you to see value not just in individual stocks, but in broader market trends and overlooked corners where fear has temporarily trumped fundamentals.

    Common Questions About Finding Undervalued Stocks

    Once you start digging for value, a few questions always seem to pop up. Answering them now builds the conviction you'll need to stick with it, especially when the market gets choppy and tries to shake you out of a perfectly good position.

    Let's tackle a few of the big ones.

    How Long Should I Wait for an Undervalued Stock to Rebound?

    This is the million-dollar question, isn't it? The only honest answer is: it depends. I’ve seen the market ignore a screaming bargain for months, and in some cases, years. There’s just no predictable timeline.

    The legendary Benjamin Graham had a great way of putting it: in the short run, the market is a voting machine, but in the long run, it's a weighing machine. Sooner or later, a company's true weight—its fundamental value—will be recognized.

    Your job isn't to stare at the calendar. It’s to keep your eyes on the business itself. Are things still on track?

    • Is the company still executing its strategy and hitting its numbers?
    • Has something fundamentally broken my original investment thesis?
    • Are there new, scary risks threatening its competitive edge?

    If the business is still solid, patience is your best friend. Value investing is a long game. If you're looking for a quick pop, you're in the wrong playground.

    Is a Cheap Stock Always an Undervalued Stock?

    No. And this is probably the most important lesson in value investing. A stock can be cheap for some very good reasons—profits are in a death spiral, the entire industry is becoming obsolete, or management is just plain awful. This is what we call a value trap, and it will burn your capital.

    An undervalued stock is completely different. It’s a quality business that is temporarily on sale. The market might be panicking over a bad quarter, writing off an entire sector, or simply overlooking a solid but unsexy company.

    The key difference between a value trap and a true bargain is a credible path forward. A genuinely undervalued company has a catalyst on the horizon that will force the market to re-evaluate its worth—maybe it's a new product launch, improving profit margins, or a change in leadership.

    Always dig into why a stock is cheap. If you can't build a solid case for a rebound based on the quality of the business, walk away.

    What If My Analysis Is Wrong?

    You will be. I’ve been wrong plenty of times, and so has every great investor you can name. Nobody bats a thousand. This is exactly why the concept of a margin of safety is the absolute bedrock of this entire strategy.

    When you buy a stock for much less than you think it's actually worth, you're building in a buffer against bad luck or your own mistakes. It's a cushion that protects you when your growth estimates are a little too rosy or the company hits an unexpected speed bump.

    Think of it this way: if your analysis says a stock’s intrinsic value is $50 a share, buying it at $30 gives you a $20 margin of safety. If it turns out you were a bit optimistic and the company is really only worth $40, you’re still in a great position.

    Getting comfortable with the fact that you won't always be right is part of becoming a better investor. A disciplined process and a healthy margin of safety are your best defenses against your own human error.


    Ready to build conviction in your investment decisions? Investogy is a free weekly newsletter that shares the real-world research and strategy behind our public, real-money portfolio. See the "why" behind every trade and learn from our successes and mistakes. Subscribe for free at https://investogy.com.