Category: Articles

  • How to Analyze the Stock Market: Expert Tips & Strategies

    How to Analyze the Stock Market: Expert Tips & Strategies

    When you get down to it, analyzing the stock market really boils down to two key questions: Is this a good business (fundamental analysis), and is now a good time to buy it (technical analysis)? If you can get a handle on both, you’ve got a powerful framework for making smarter investment decisions.

    Your Starting Point for Stock Market Analysis

    Diving into stock analysis can feel like a lot at first, but the core idea is pretty simple. You're basically a business detective. Your job is to figure out what a company is really worth and then try to predict how other investors will value it down the road.

    The best investors I know don't just pick one method over the other; they learn to blend them. This creates a much more robust, two-part strategy.

    • Fundamental Analysis: This is all about the 'what.' You’re digging into the company’s health—poring over financial statements, sizing up the management team, and understanding its competitive edge. This helps you decide if the company is even worth owning in the first place.
    • Technical Analysis: This is the 'when.' Here, you're looking at price charts and trading volumes to spot trends and patterns. The goal is to get a better sense of market sentiment to help you time your entries and exits.

    Blending the 'What' and the 'When'

    I like to think of it like buying a house. Fundamental analysis is like getting a home inspection—you're checking the foundation, looking for leaks, and making sure it's in a good neighborhood. You're assessing its real, intrinsic value.

    Technical analysis, on the other hand, is like looking at recent sales in the area and market trends to see if it’s a buyer's or seller's market. You're all about the timing. You really need both to make a smart buy.

    By combining these methods, you move from just picking stocks to building a repeatable investment process. This disciplined approach is what separates long-term success from short-term gambling.

    To get a feel for the bigger picture, it helps to look at benchmarks. For instance, when we talk about the stock market historically, we're often looking at indexes like the S&P 500. It's a huge deal because it tracks about 80% of the total U.S. equity market value.

    Over the last decade, the S&P 500 has delivered an average annual return of roughly 13.6%, which really shows the power of staying invested in the market over the long haul. If you want to dive deeper, S&P Global offers some great insights into the index's performance.

    This is a perfect example of how an index like the S&P 500 is used to gauge the overall health of the market.

    Image

    Keeping an eye on these major indexes gives you crucial context. It helps you understand whether a single stock's movement is part of a broader market trend or something specific to that company.

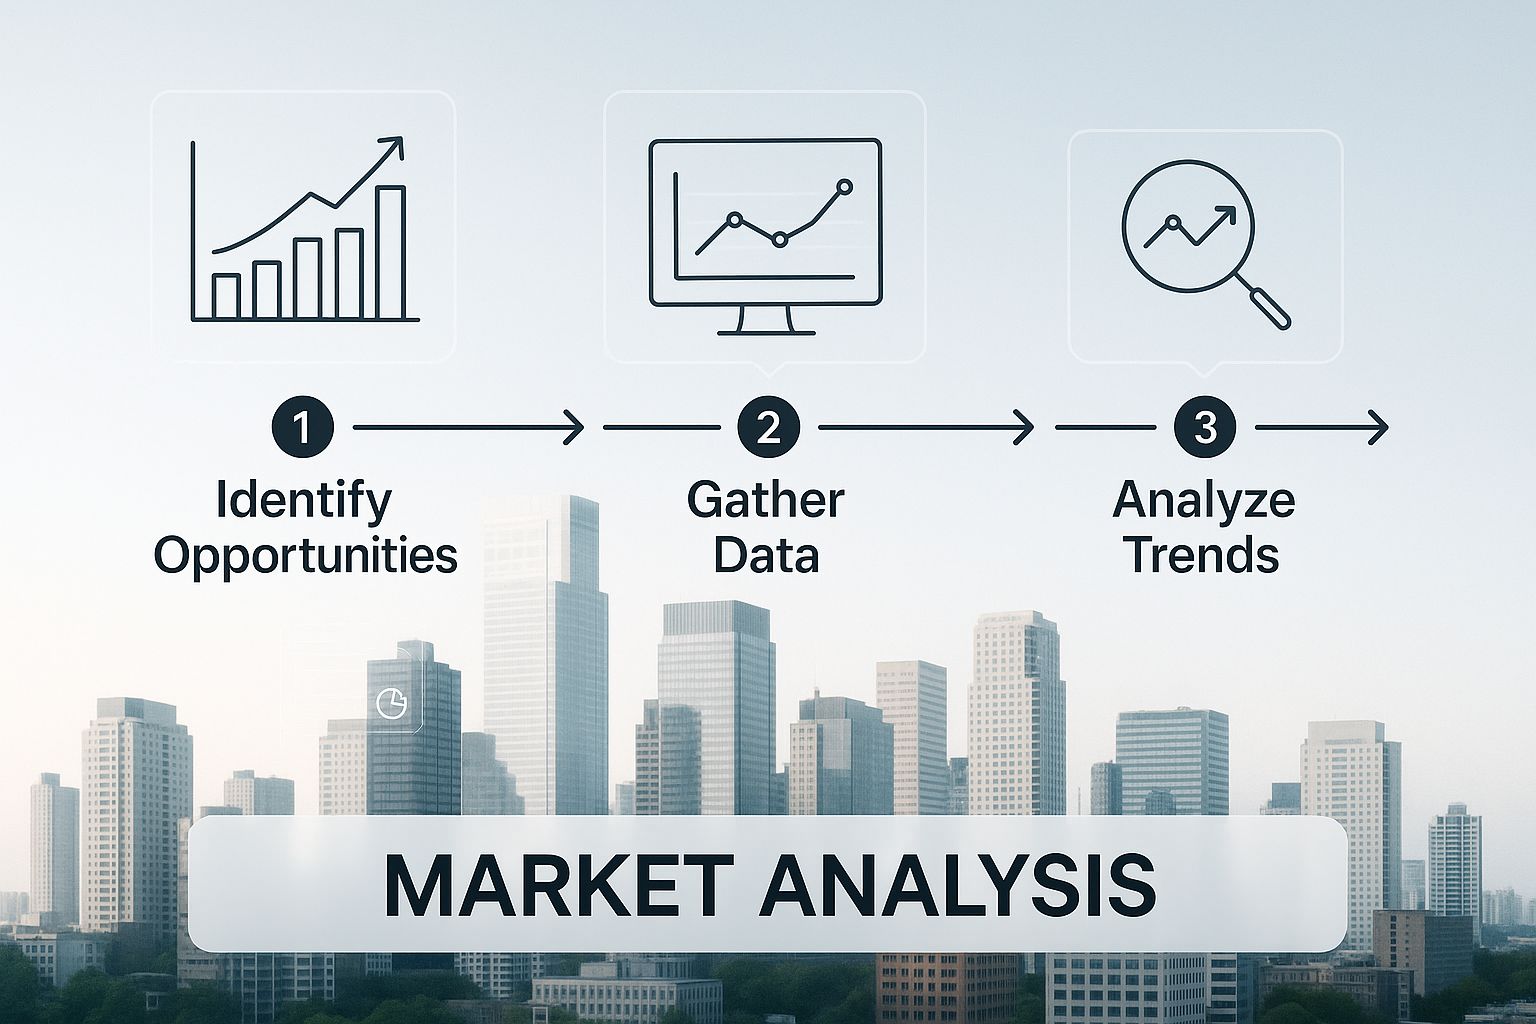
    Before we dive into the nitty-gritty of each method, let's break them down side-by-side. Seeing them compared directly can make it much clearer when and why you'd use each one.

    Core Stock Analysis Methods at a Glance

    Aspect Fundamental Analysis Technical Analysis
    Primary Goal Determine a company's intrinsic value. Identify trading opportunities based on price patterns.
    Key Metrics Earnings per share (EPS), P/E ratio, cash flow, debt. Moving averages, support/resistance levels, RSI.
    Time Horizon Long-term (months to years). Short-term (days to weeks).
    Core Question "What to buy?" "When to buy?"
    Use Case Finding undervalued companies for long-term holds. Timing entry and exit points for trades.

    This table gives you a quick snapshot, but the real power comes from knowing how to use both sets of tools together. Let’s get into the specifics of how you can start doing just that.

    Decoding Company Health with Fundamental Analysis

    Image

    Alright, let's talk about looking under the hood of a business. This is what fundamental analysis is all about. Forget the daily drama of stock price swings for a minute. Instead, you're putting on your business owner hat and trying to figure out what a company is actually worth. It's the only way to gauge its true financial health and long-term potential.

    To pull this off, you have to get comfortable with a company's core financial documents. Think of these as the company's report card. They tell you pretty much everything you need to know about its performance if you know where to look.

    The Three Key Financial Statements

    You don't need an accounting degree, I promise. But getting a handle on these three statements is non-negotiable for anyone serious about analyzing stocks. Each one tells a crucial part of the company's financial story.

    • The Income Statement: This is where you see a company's profitability over a set period, like a quarter or a full year. It adds up all the revenue and subtracts all the expenses to give you the all-important net income—the famous "bottom line."
    • The Balance Sheet: This gives you a snapshot of a company’s financial standing at one specific moment. It’s built on a simple formula: Assets = Liabilities + Shareholders' Equity. In plain English, it shows you what the company owns versus what it owes.
    • The Cash Flow Statement: This one is critical. It tracks every dollar moving in and out of the company. A business can look profitable on its income statement but still go belly-up if it runs out of cash. This statement keeps you from getting fooled.

    These documents are the bedrock of fundamental analysis. If you really want to build a solid framework for evaluating companies, it pays to go deeper. You might want to check out our full guide on what is fundamental analysis for a more detailed breakdown.

    Unpacking Important Financial Ratios

    Once you've got the raw numbers from those statements, the real fun begins. Calculating key financial ratios is how you turn data into insight. These metrics are what let you stack a company up against its competitors—and against its own past performance—to see how it really measures up.

    A business that makes nothing but money is a poor business.
    – Henry Ford

    Henry Ford nailed it. Strong fundamentals are what create lasting value, not just a temporary spike in profits. Ratios help you see past the headline numbers to understand the quality and sustainability of a company's earnings.

    Here are a few of the big ones you'll want to start with:

    1. Price-to-Earnings (P/E) Ratio: This is probably the most common valuation metric out there. You calculate it by dividing the stock price by its earnings per share (EPS). A high P/E might mean a stock is overvalued, while a low one could signal a bargain—but you always need more context.
    2. Debt-to-Equity (D/E) Ratio: This tells you how much a company relies on debt to run its business. It’s calculated by dividing total liabilities by shareholder equity. A high D/E ratio can be a major red flag, showing the company might be overleveraged.
    3. Return on Equity (ROE): This measures how efficiently a company uses its shareholders' money to churn out profits. A consistently high ROE is often the mark of a well-managed, high-quality business.

    The connection between a company's earnings and its stock price is direct and powerful. History shows that corporate earnings growth is one of the biggest drivers of the U.S. stock market. When S&P 500 companies crush their earnings reports, the market often rallies. This is why digging into the numbers is so incredibly important for any serious long-term investor.

    Reading Market Sentiment with Technical Analysis

    Image

    If fundamental analysis tells you what to buy, technical analysis helps you figure out when. Forget the balance sheets and earnings reports for a minute. Technical analysis is all about reading the market's collective mood by digging into price charts and trading volume.

    The core idea here is that all the news, opinions, and fundamental data are already baked into a stock's price. So, instead of re-analyzing that info, technicians look at historical price action to spot patterns and trends that could give clues about what's next. It’s a fantastic tool for getting a better handle on your entry and exit timing.

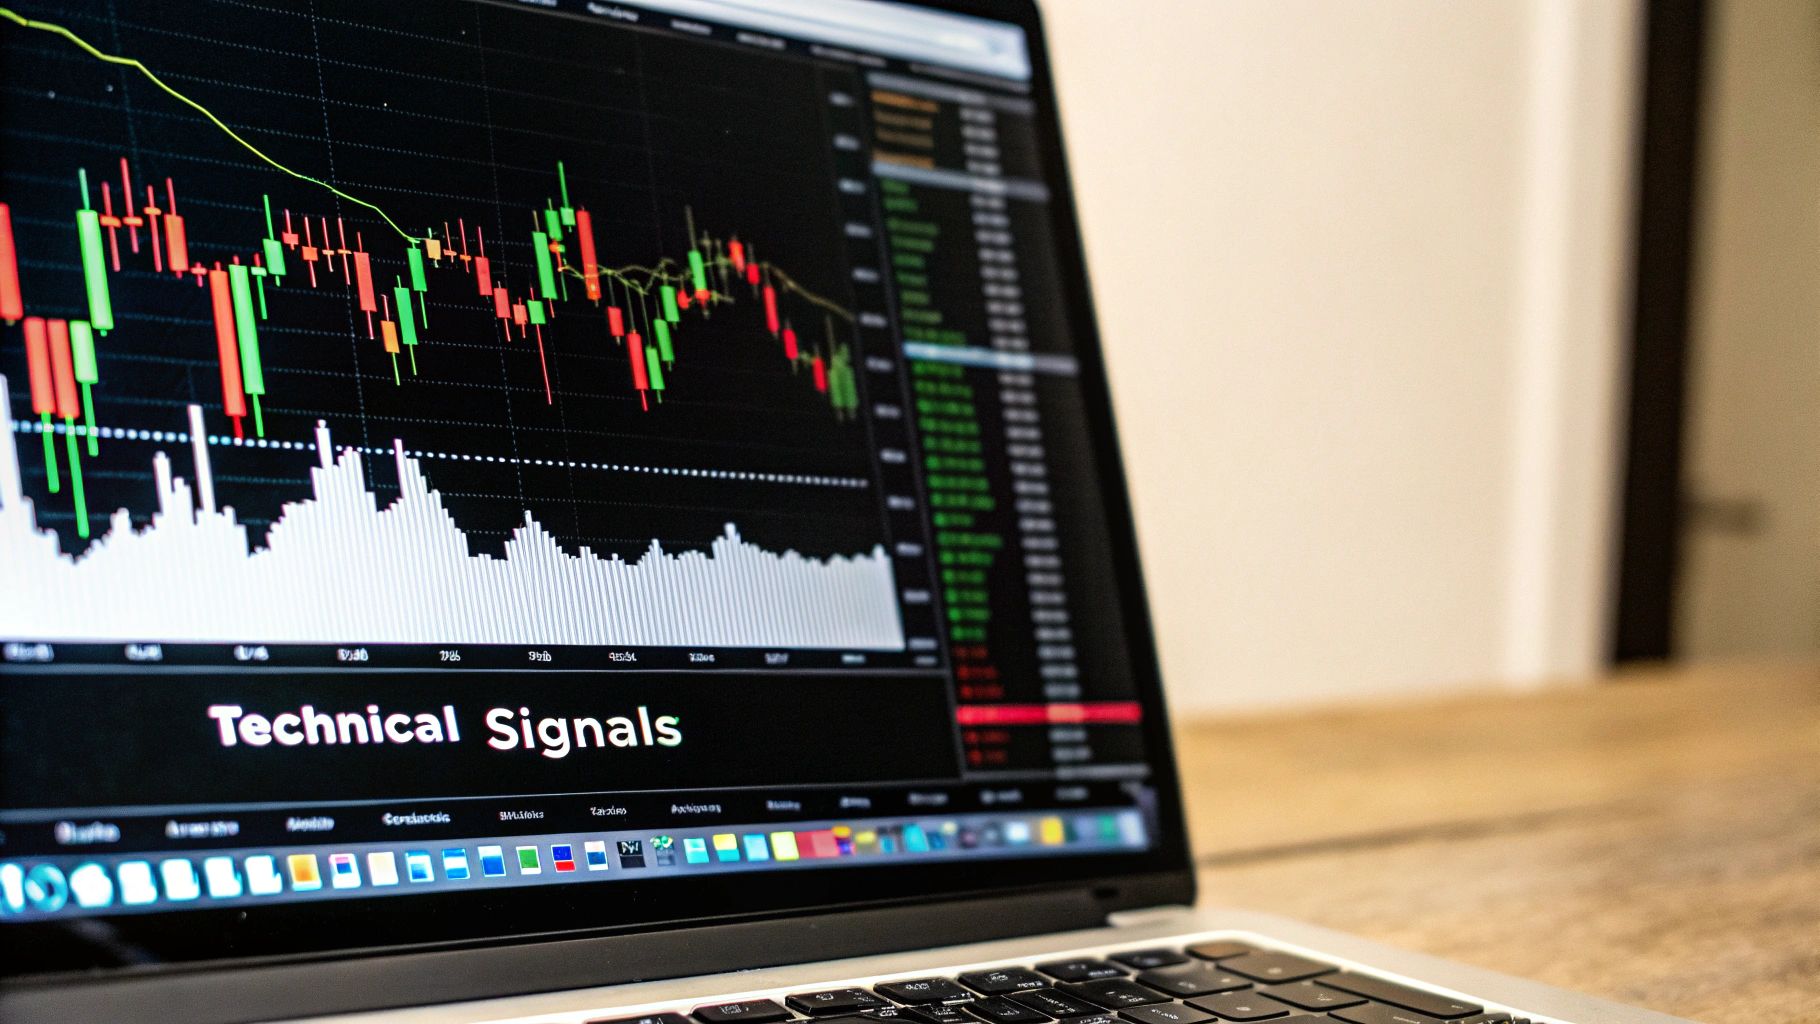
    Mastering the Basics of Chart Reading

    The price chart is the technician's playground, and the candlestick chart is king. I think of each candlestick as telling a story—a little snapshot of the battle between buyers and sellers over a set period, whether it's a day, an hour, or even just a minute.

    Each candle gives you four critical data points:

    • The open: Where the price started.
    • The close: Where the price ended.
    • The high: The peak price it hit.
    • The low: The bottom price it touched.

    The thick part, or "body," of the candle shows you the distance between the open and close. The thin lines, or "wicks," show the full high-to-low range. Typically, a green candle means the price closed higher than it opened (buyers won that round). A red candle means it closed lower (sellers were in control).

    Once you get the hang of it, you can start spotting patterns. For example, a "bullish engulfing" pattern—where a big green candle completely swallows the previous smaller red one—can be a strong hint that momentum is about to shift upward.

    Technical analysis is essentially the art of identifying trend changes at an early stage. It’s a game of probabilities, not certainties, aimed at stacking the odds in your favor.

    Using Key Indicators to Spot Trends

    Beyond just looking at raw candlesticks, we use indicators to smooth things out and get a clearer view of the underlying trend. One of the first indicators most traders learn is the moving average. It's simple: it just calculates the average price over a specific number of days, like 50 or 200.

    When a stock’s price punches through its moving average to the upside, that's often seen as a bullish sign. If it breaks below, that could signal a downturn. It’s a great way to filter out the day-to-day "noise" and see the bigger picture.

    Another go-to indicator is the Relative Strength Index (RSI). This is a momentum tool that measures how quickly prices are moving, on a scale of 0 to 100.

    • A reading above 70 often suggests a stock is overbought and might be due for a breather.
    • A reading below 30 suggests it could be oversold and ready for a bounce.

    Now, these aren't crystal balls. But they give you objective data points to work with. For instance, when a big index like the US500 hits an all-time high, you'll see analysts using these tools to forecast future movements. They watch for pullbacks and use moving averages and volume to pinpoint support levels and gauge the market's real strength. You can see these market dynamics in action on Trading Economics.

    At the end of the day, technical analysis gives you a visual language to understand what the market is doing and, just as importantly, to manage your risk with a bit more precision.

    Putting the Right Tools in Your Investor Toolbox

    You don't need a six-figure Wall Street subscription to do high-quality stock analysis. Seriously. Some of the most powerful tools are available to every single investor for free, giving you everything you need for deep fundamental and technical research right from your laptop.

    Knowing which tools to use—and more importantly, how to use them together—is what separates successful investors from those just guessing.

    Let's walk through a real-world scenario. Say you're on the hunt for some undervalued tech stocks. Where do you even begin? You start with a stock screener, a tool designed to sift through thousands of companies to find the handful that meet your specific criteria.

    Finding Great Companies with Stock Screeners

    My go-to starting point is often Finviz. Its free screener is surprisingly robust. In just a few clicks, you can tell it to only show you companies with a P/E ratio under 15, a debt-to-equity ratio below 0.5, and positive sales growth for the past five years.

    Just like that, a universe of thousands of stocks shrinks to a manageable list of potential winners. This is how you build a repeatable process, ensuring every stock you look at has already passed your initial quality check before you invest any serious time.

    Once you have a shortlist, the next step is to get your hands dirty with the financials. For that, Yahoo Finance is an absolute workhorse. Plug in a stock ticker, click over to the "Financials" tab, and you've got years of income statements, balance sheets, and cash flow statements right there.

    You can quickly track revenue growth, check on profit margins, and see how the company is managing its debt. It's the perfect way to dig into the fundamental analysis and really understand the story the numbers are telling.

    Charting Your Next Move

    After a company passes the fundamental test, it's time to look at the chart and see what the market is thinking. This is where a great charting platform like TradingView becomes essential. Even with a free account, you can pull up any stock and start layering on key technical indicators.

    For instance, you can add the 50-day and 200-day moving averages to get an instant read on the stock's long-term trend. Are the bulls or the bears in control? You can also draw your own support and resistance lines to identify critical price levels where the stock has pivoted in the past.

    Then, add an indicator like the Relative Strength Index (RSI) below the price chart. This will help you gauge whether the stock is looking overbought or oversold, giving you clues about a potential entry point.

    The real magic happens when you combine these tools into a workflow. You use a screener to generate ideas, a financial data site to vet the business, and a charting platform to nail your timing. It's a systematic approach that builds both discipline and confidence.

    For investors looking for the right platform, here is a quick comparison of some of the top tools accessible to everyone.

    Top Stock Analysis Tools for Investors

    Tool Best For Key Feature Cost
    Finviz Stock Screening & Idea Generation Powerful free screener with dozens of fundamental and technical filters. Free (with ads), Paid tiers
    Yahoo Finance Fundamental Data & Financials Easy access to years of financial statements and key company news. Free, Paid tiers
    TradingView Charting & Technical Analysis Best-in-class charting tools and a massive community of traders. Free, Paid tiers
    Seeking Alpha Crowdsourced Research & Opinion Access to analysis from thousands of individual investors and experts. Free (limited), Paid tiers

    Each of these platforms offers a unique strength, and using them together creates a comprehensive analysis toolkit without breaking the bank.

    Mastering these platforms is a fundamental skill for anyone serious about analyzing stocks. To explore even more options, check out our complete guide to the best stock market analysis tools available for investors today.

    Putting It All Together with Smart Risk Management

    Image

    Finding what you think is a high-quality stock feels great, but that’s only half the job. Honestly, the best analysis in the world means nothing if you don't have a plan to protect your hard-earned capital. This is where smart risk management comes in, turning your research from a simple project into a sustainable, long-term investment strategy.

    Without it, you could land a string of winners and still get wiped out by one bad trade. Managing risk is the discipline that separates consistent investors from short-term gamblers, plain and simple.

    A huge part of this is not putting all your eggs in one basket. But real diversification is more nuanced than just buying a handful of different stocks. It’s about spreading your investments across various sectors and industries that don’t always move in lockstep. For example, when tech stocks are taking a beating, your holdings in consumer staples or healthcare might be holding steady or even climbing.

    Building Your Defensive Playbook

    To really analyze the market effectively, you have to analyze your own portfolio's weak spots. This means setting up practical rules that take emotion out of the equation and protect your downside.

    Here are the non-negotiables I live by:

    • Position Sizing: This is probably the most critical rule of all. Never, ever allocate so much capital to a single stock that its failure could cripple your entire portfolio. A good rule of thumb is to not risk more than 1-2% of your total portfolio on any single trade.

    • Setting Stop-Loss Orders: Think of a stop-loss as your eject button. It's an automated order to sell a stock if it drops to a predetermined price. This creates a safety net, making sure a losing position doesn’t spiral into a catastrophic one. It's your exit strategy, planned before things go wrong.

    If you want to go deeper on balancing your holdings, check out our guide on how to diversify an investment portfolio. Getting this right is absolutely fundamental to long-term success.

    The essence of investment management is the management of risks, not the management of returns.
    – Benjamin Graham

    This piece of wisdom from the father of value investing gets to the core of it all. Long-term gains are built on a foundation of preserving your capital. Your number one job is to stay in the game long enough for your analysis to bear fruit.

    Turning Analysis Into Action

    So, let's say you've done your homework on a company and you're ready to pull the trigger. Your risk management plan is what dictates your next move.

    Instead of jumping in with your full intended amount, you might start with a smaller, initial position. If the stock starts behaving the way your analysis predicted, you can add to your position over time. This approach lets you test your theory in the real world while limiting your initial risk.

    When you combine thorough fundamental and technical analysis with a disciplined risk management framework, you build a repeatable process you can rely on. This system gives you the confidence to act on your research while shielding you from the market's inevitable chaos. It’s the final, and most essential, piece of the puzzle.

    Got Questions About Stock Market Analysis?

    When you first dive into stock market analysis, a million questions pop into your head. That's totally normal. Getting some straight answers is the first step toward building a process that actually works for you, so let's clear up a few of the most common ones I hear.

    Fundamental or Technical Analysis? Where Do I Even Start?

    This is the big one. Everyone wants to know if they should be buried in financial reports or staring at squiggly lines on a chart. Honestly, there's no single "right" answer, but most people find it easier to start with fundamental analysis.

    It’s just more intuitive. You're looking at a company's health—its sales, its profits, what it sells, and whether it has a solid footing in its industry. It's business logic, and that feels a lot more tangible than trying to decipher chart patterns right out of the gate.

    But here’s the thing: completely ignoring technical analysis is like driving with one eye closed. You might be on the right road, but you can’t see the traffic right in front of you. Learning the basics of reading a price chart gives you crucial context on market timing. It can help you sidestep classic blunders, like finally buying that great company you researched after its stock has already shot up 100% and is screaming for a breather.

    How Much Time Does This Actually Take?

    Another huge concern I hear is about the time commitment. Let's be clear: you do not need to be chained to a monitor all day. Effective analysis is about quality over quantity. For anyone who isn't a professional day trader, a few focused hours a week is plenty to stay on top of things and scout for new ideas.

    What does that look like in practice?

    • Your weekend review: Maybe you set aside an hour or two on a Saturday morning. You can check in on your current holdings, read up on any news, and maybe run a screen for new stocks that fit your criteria.
    • Quick mid-week check-ins: A couple of times during the week, you could spend 15-20 minutes catching up on headlines for your companies or glancing at their charts to see if any key price levels are being tested.

    The goal isn't to react to every little market wiggle. It's to build a consistent, informed habit. Trust me, once you get in a rhythm, you'll get much faster at filtering out the noise and zeroing in on what truly matters.

    Can I Just Pick One and Ignore the Other?

    It's tempting, right? Just become a "fundamentals guy" or a "charts guru" and call it a day. But relying on just one of these methods is a massive risk. Each approach has its own blind spots, and they happen to be the exact spots the other one covers beautifully. A blended strategy isn't just better; it's exponentially more powerful.

    Think about it. A pure fundamental investor might find a stock that's an absolute bargain on paper, buy it, and then watch in frustration as it gets even cheaper for the next six months. On the flip side, a pure technical trader might jump on a hot trend without realizing the company is a financial dumpster fire about to go bust.

    Here’s a simple but powerful way to combine them: use fundamental analysis to find what to buy, and use technical analysis to decide when to buy it.

    This two-step process helps you invest in solid businesses at prices that actually make sense. For example, once your fundamental research flags an undervalued company, you can patiently watch its chart. Instead of buying immediately, you wait for a technical signal—like the stock breaking out of a downtrend—before pulling the trigger. This simple combo can dramatically improve your results.


    Ready to see how this all comes together in a real portfolio? The Investogy newsletter is where I pull back the curtain on my own real-money portfolio, sharing the deep-dive research and the "why" behind every single move I make. Subscribe for free at https://investogy.com.

  • Your Guide to Margin of Safety Calculation

    Your Guide to Margin of Safety Calculation

    The margin of safety is one of the absolute cornerstones of value investing. At its core, it's pretty simple: it's the gap between what you believe a stock is truly worth (its intrinsic value) and what you can actually buy it for on the market.

    Think of it as your built-in financial cushion. It’s the buffer that protects your hard-earned capital when things go wrong—and they inevitably do. You might whiff on a forecast, get blindsided by bad luck, or just get caught in a volatile market tantrum. Your margin of safety is your primary defense against paying too much for an investment.

    Understanding the Foundation of Value Investing

    Image

    Let's use a real-world analogy. Imagine an engineer designing a bridge. If that bridge absolutely must support 10 tons of traffic, she isn’t going to design it to hold exactly 10 tons. No way. She'll design it to handle 15, maybe even 20 tons. That extra capacity is the bridge's margin of safety. It's what ensures the bridge won’t collapse under unexpected stress like gale-force winds, a sudden traffic surge, or just the slow fatigue of materials over time.

    Investing works exactly the same way. The margin of safety is the "shock absorber" for your portfolio. This isn't some newfangled idea; it's a concept that has been championed for decades by investing legends like Benjamin Graham and his star student, Warren Buffett. It’s a deliberate, disciplined strategy of buying a business for significantly less than your homework says it's actually worth.

    Its Dual Role in Business and Investing

    What’s interesting is that this principle isn't just for stock pickers—it's deeply rooted in business operations, too. For a company, its margin of safety is a measure of how much sales can drop before the business tips from making a profit to losing money. This single metric reveals a company's resilience to a recession or a sudden shift in what customers want. A fat margin of safety means the company has a strong buffer to weather storms.

    For us as investors, the application is a little different but born from the same protective spirit. It helps answer the most critical question you can ask yourself: "How wrong can my analysis be before I start losing money?"

    By demanding a discount upfront, you build a buffer against some very real dangers:

    • Valuation Errors: Let's be honest, no one has a crystal ball. Predicting a company's future earnings with perfect accuracy is impossible. A margin of safety gives you wiggle room for the inevitable miscalculations in your analysis.
    • Market Volatility: Stock markets can be wildly irrational. Prices swing on fear and greed all the time. A wide margin protects your investment from getting hammered by sudden, panic-driven price drops that have nothing to do with the underlying business.
    • Unforeseen Business Challenges: Even a fantastic company can hit unexpected turbulence. A new competitor could emerge, or a change in regulations could throw a wrench in the works.

    "The three most important words in investing are margin of safety." – Warren Buffett

    When you get right down to it, this isn't just a formula; it's a whole mindset. It forces you to be disciplined, to be patient, and to obsess about risk before you even think about the potential reward.

    By making it a non-negotiable rule to buy assets for less than their intrinsic value, you create a powerful, built-in advantage. This buffer is what separates disciplined investing from pure speculation, giving you a solid foundation for long-term success and, just as importantly, peace of mind. Getting this concept down is the first real step toward building a portfolio that's both profitable and resilient.

    Calculating Margin of Safety for Business Health

    Before we dive into using margin of safety to pick stocks, it helps to understand where the concept comes from: the world of business operations. For a company, this isn't some abstract theory—it’s a critical health metric, a kind of early warning system. It tells a business owner exactly how much sales can drop before the company starts bleeding cash.

    The margin of safety calculation for a business is refreshingly simple. It’s the gap between a company's current sales and its breakeven point. Think of it as the financial cushion that protects a business from unexpected downturns.

    The Business Formula Explained

    Here’s the formula in its most basic form:

    Margin of Safety = (Current Sales – Breakeven Sales) / Current Sales

    Let's unpack what each part means using a relatable example: a local neighborhood bakery.

    To really get a handle on this, the table below breaks down each part of the formula and applies it to our bakery example, making the calculation crystal clear.

    Component Definition Example (Local Bakery)
    Current Sales The total revenue a business is generating at the present moment. The bakery brings in $20,000 in sales this month.
    Breakeven Sales The point where total revenue equals total costs. The business isn't making a profit, but it's not losing money either. It's the "survival" number. After adding up rent, salaries, flour, sugar, and everything else, the bakery needs $15,000 a month to cover all its costs.
    Margin of Safety The percentage drop in sales a business can withstand before it becomes unprofitable. The financial buffer that lets the owner sleep at night.

    As you can see, figuring out the breakeven point is the most important step. It’s where you roll up your sleeves and add up all the fixed costs (like rent and salaries) and variable costs (flour, sugar, packaging) to see how much revenue you absolutely need to cover everything.

    The infographic below gives a great visual of the steps involved in running this calculation.

    Image

    This really drives home that the process is a methodical way to measure a business's financial buffer against hard times.

    Putting the Numbers to Work

    With our bakery's figures in hand, let's plug them into the formula:

    1. Subtract Breakeven from Current Sales: $20,000 – $15,000 = $5,000
    2. Divide by Current Sales: $5,000 / $20,000 = 0.25
    3. Convert to a Percentage: 0.25 x 100 = 25%

    What does this 25% really mean? It means the bakery’s sales could fall by a full quarter before it would start losing money. That's its cushion against a slow month, a new competitor opening up down the street, or the price of flour suddenly spiking. For analysts dealing with huge financial reports, using tools for AI for financial analysis can be a massive help in pulling the necessary data together quickly.

    A higher percentage is always better—it signals a healthier, more resilient business. A low number is a red flag. Take a company with $880,000 in sales and a breakeven point of $800,000. Its margin of safety is only 9.09%. That's a much tighter rope to walk, and it tells management they probably need to cut costs or find ways to boost sales before something goes wrong.

    Grasping this operational calculation gives you the perfect foundation for applying the same defensive thinking to investing. The numbers change from sales figures to stock prices, but the core idea of building in a protective buffer is exactly the same. The way we assess risk here is closely tied to how investors think about their portfolios, which is a big part of learning /blog/how-to-calculate-stock-returns/ properly. Next up, we’ll shift gears and see how this vital concept works in the world of stock valuation.

    Using Margin of Safety for Smarter Stock Picks

    Image

    Alright, let's take this idea from the factory floor to the stock market. The exact same protective mindset works wonders for picking investments. For investors, the margin of safety calculation is the tool that can turn a good company into a great investment, simply by making sure you don't overpay.

    The formula is pretty similar to the business version, just with different inputs. It’s all about measuring the discount between what you think a stock is truly worth and what everyone else is currently paying for it.

    Margin of Safety = (Intrinsic Value – Market Price) / Intrinsic Value

    This simple equation is the absolute bedrock of value investing. It forces you to answer one critical question before you ever click "buy": Am I getting this for less than it's really worth?

    The Tricky Part: Finding Intrinsic Value

    Now, the formula looks easy enough, but the real sweat equity comes from figuring out a stock's intrinsic value. This isn't some number you can just look up on Yahoo Finance. It’s your own educated estimate of a company's true, underlying worth based on how much cash it can spit out over its lifetime.

    Think of it like appraising a house. You could have two expert appraisers look at the exact same property and come back with slightly different values. One might weigh recent sales in the neighborhood more heavily, while the other might focus on the cost to rebuild. It's the same with stocks. Two smart investors can analyze the same company and land on different intrinsic values.

    Your goal isn't to find some magic, perfect number. It's to arrive at a reasonable, conservative estimate. And that means you’ve got to roll up your sleeves and do a little homework.

    How Investors Estimate a Company's True Worth

    So how do you actually come up with that number? Investors have a few go-to methods. One of the most common—and for my money, one of the most thorough—is the Discounted Cash Flow (DCF) analysis. It sounds a little intimidating, but the core idea is dead simple: a business is worth all the cash it will ever generate for its owners in the future, just adjusted to what that cash is worth today.

    Here are a few popular approaches:

    • Discounted Cash Flow (DCF): This is where you project a company's future cash flows and then "discount" them back to the present day. It's a structured way to value a company based on its future earning power.
    • Asset-Based Valuation: This one is more straightforward. You just add up all the company's assets and subtract its liabilities. It's especially useful for businesses heavy with tangible stuff, like real estate firms or old-school manufacturing companies.
    • Comparable Company Analysis (Comps): This is the "what are the neighbors selling for?" method. You look at what similar companies are valued at (using metrics like Price-to-Earnings ratios) to get a ballpark figure for your target.

    Using a method like DCF forces you to think like a business owner, not just a stock trader. You're focused on the long-term health and potential of the company, not just the daily squiggles of its stock price. This is exactly the kind of thinking that legendary investors like Warren Buffett have built their fortunes on. If you really want to get inside this mindset, digging into the core Warren Buffett's investing principles is a fantastic starting point.

    Let's Run the Numbers: A Quick Example

    Let's walk through a hypothetical to see this in action. Say we're looking at a steady, predictable company we'll call "Reliable Robotics Co."

    Step 1: Estimate the Intrinsic Value
    You've done your DCF analysis, crunched the numbers, and you come to a conservative estimate that Reliable Robotics is fundamentally worth $100 per share.

    Step 2: Check the Current Market Price
    You pull up your brokerage account and see the stock is trading on the open market for $70 per share. Interesting.

    Step 3: Calculate Your Margin of Safety
    Time to plug those numbers into our formula:

    • (Intrinsic Value – Market Price) / Intrinsic Value
    • ($100 – $70) / $100
    • $30 / $100 = 0.30

    Multiply that by 100, and you get a margin of safety of 30%.

    That 30% is your buffer. It's your protection against being wrong. It means your valuation could be off by a whopping 30% before the market price even catches up to what you think it’s worth. If the company hits an unexpected rough patch or the whole market freaks out, this discount acts as a cushion to protect your capital. On the flip side, if you're right, that gap between $70 and $100 represents your potential profit as the market eventually comes to its senses.

    How Big Should Your Margin of Safety Be?

    So, how much of a discount is enough? A 30% margin of safety sounds great, but is it the right number for every single investment?

    The honest answer is: it depends. Figuring out the right margin of safety is more art than science, and it forces you to think critically about the specific business you’re looking at. There's no magic, one-size-fits-all number here.

    The cushion you need should change based on the quality and predictability of the company you're analyzing. For example, a stable, established utility company with revenues you could set your watch to might only need a small margin of safety, maybe in the 15-20% range. Its future is pretty easy to map out.

    On the other hand, a volatile tech startup with an unproven business model is a whole different beast. For an investment like that, you'd demand a much larger discount—perhaps 50% or more—to make up for all the unknowns. Think of it like a tightrope walker: the windier the day and the higher the rope, the wider the net you want underneath you.

    Factors That Influence Your Margin

    Deciding on the right buffer means looking beyond the spreadsheet. A disciplined margin of safety calculation isn't just about the numbers; it’s about understanding the story behind them.

    Here are the main things I always consider:

    • Company Quality and Predictability: Is this a blue-chip company like Coca-Cola with a long history of steady earnings? Or is it a cyclical business, like an automaker, whose fortunes swing wildly with the economy? The more predictable its future, the smaller the margin you can get away with.
    • Industry Stability: Let's face it, some industries are just plain safer than others. Consumer staples—think toothpaste and toilet paper—are far less volatile than speculative sectors like biotechnology. A company in a rock-solid industry doesn't require as much of a discount.
    • Competitive Advantage (Moat): Does the company have a durable competitive advantage—a "moat"—that keeps rivals at bay? Things like a powerful brand, patent protection, or high switching costs for customers all reduce risk and can justify a lower margin of safety.
    • Management Quality: Do you trust the people running the show? A leadership team with a proven track record of smart decisions and honest communication is a huge plus, lowering the overall risk profile of your investment.

    "The key to investing is not assessing how much an industry is going to affect society, or how much it will grow, but rather determining the competitive advantage of any given company and, above all, the durability of that advantage." – Warren Buffett

    Buffett’s point is critical. A deep understanding of a company's staying power is central to figuring out how much of a discount you truly need. A strong, durable moat means the business is far less likely to face a catastrophic surprise that vaporizes your investment.

    Finding a Good Starting Point

    While every investment needs a custom-fit margin of safety, many value investors use a general range to get started. A common benchmark is to look for a discount of anywhere from 20% to 50%.

    A 20% margin might be perfectly fine for a high-quality, stable business. A 50% margin, however, gives you a massive buffer for a riskier or more complicated situation where a lot could go wrong.

    If you want to get more technical, this idea connects to a stock's volatility. In finance, the coefficient of variation (CV) is a way to measure a stock's price swings relative to its average price. A higher CV means more volatility and, therefore, higher risk. Logically, a stock that bounces around like a pogo stick demands a larger margin of safety to protect you from those wild fluctuations. You can dive deeper into the statistical side of the margin of safety at StableBread.com.

    Ultimately, these benchmarks are just guides. Your final decision should be a blend of hard numbers and your own judgment. By carefully weighing the factors above, you can move beyond a generic formula and develop the confidence to apply a margin of safety that's perfectly suited to the unique risks of each investment. That thoughtful approach is what separates disciplined investing from pure speculation.

    Learning from Real World Investment Scenarios

    Formulas and financial theory are a great starting point, but nothing drives a lesson home like a real story. Seeing the margin of safety play out in the wild—both in spectacular successes and painful failures—is where its true power clicks. These scenarios show how this single principle can mean the difference between a winning investment and a brutal loss.

    Let's walk through two very different stories. One investor sticks to their guns, while the other gets swept up in market hype. Their outcomes tell you everything you need to know about the importance of building a buffer.

    Success Story: The Patient Purchase of a Quality Company

    Imagine an investor named Sarah who has been watching "Stable Software Inc." for months. It’s a profitable, well-run company with a solid competitive moat. After digging into the numbers, she calculates its intrinsic value to be roughly $150 per share.

    The problem? The market is feeling optimistic, and the stock is trading at $140 per share. She runs the numbers:

    • ($150 Intrinsic Value – $140 Market Price) / $150 Intrinsic Value = 6.7%

    A 6.7% margin of safety is paper-thin. It offers almost no protection if she got her valuation wrong or if the company hits a rough patch. So, she does the hardest thing in investing: she waits.

    Months later, a market-wide downturn drags nearly every stock down, including Stable Software. The company's fundamentals are just as strong, but fear has taken over, pushing the stock price to $90 per share.

    Now, Sarah's calculation looks a whole lot better:

    • ($150 Intrinsic Value – $90 Market Price) / $150 Intrinsic Value = 40%

    A 40% discount is exactly what she was waiting for. She buys the stock, confident she has a massive cushion. Sure enough, over the next two years, the market recovers and Stable Software’s stock climbs to $160, blowing past her initial valuation. Sarah’s discipline didn't just protect her money; it set her up for a fantastic return.

    Cautionary Tale: Ignoring the Margin for Hype

    Now, let's look at Mark. He’s captivated by "FutureTech," an electric vehicle startup that’s all over the news. The company is innovative, sure, but it has yet to turn a profit, and its stock is soaring on pure speculation.

    Mark does a quick analysis and figures the company's intrinsic value is maybe $50 per share. The stock, however, is already trading at $80 per share. His margin of safety calculation is ugly:

    • ($50 Intrinsic Value – $80 Market Price) / $50 Intrinsic Value = -60%

    A negative margin of safety is a massive red flag. It’s a screaming signal that the market price has completely detached from the company's underlying worth, making the stock dangerously overvalued.

    Despite this, the fear of missing out (FOMO) is overwhelming. Mark ignores his own math and buys in at $80, hoping the momentum continues. It does… for a little while, even hitting $95. But then reality bites. The company misses its ambitious production targets, a competitor launches a better product, and the market’s love affair with FutureTech ends overnight.

    The stock price plummets to $30 per share. Mark is now sitting on a huge loss because he paid a price with no connection to reality. He had no buffer, no cushion to absorb the inevitable bad news.

    To really see the difference discipline makes, let's put these two scenarios side-by-side.

    Case Study Comparison Success vs Failure

    The table below breaks down the key decisions and outcomes for Sarah and Mark. It's a stark reminder of how a simple principle, applied with discipline, can lead to dramatically different results.

    Metric Investment A (With MoS) Investment B (Without MoS)
    Investor Sarah Mark
    Stock Stable Software Inc. FutureTech
    Intrinsic Value $150 / share $50 / share
    Initial Market Price $140 / share $80 / share
    Initial MoS 6.7% (Too low) -60% (Negative!)
    Decision at Initial Price Waited Bought due to hype
    Actual Purchase Price $90 / share $80 / share
    MoS at Purchase 40% -60%
    Final Outcome Significant profit Major loss

    As you can see, Sarah’s success wasn't about timing the market perfectly. It was about waiting for a price that gave her a substantial margin of safety. Mark’s failure was a direct result of ignoring his own valuation and chasing a hot stock.

    These stories hammer home that the margin of safety is more than just a formula; it's a vital risk management tool for investors. It’s the disciplined voice that helps you avoid expensive mistakes.

    Common Mistakes to Avoid When Calculating Your Margin of Safety

    Knowing the formula for a margin of safety is one thing. Applying it with real discipline out in the wild is something else entirely. Even investors who have been at this for years can fall into common traps that completely gut this powerful principle.

    Getting this right is crucial for protecting your capital and making sound decisions. Let's walk through the big mistakes I see people make time and time again.

    The "Garbage In, Garbage Out" Problem

    By far, the biggest mistake is what we call the "garbage in, garbage out" problem. Your margin of safety is only as good as the intrinsic value estimate it's built on. Simple as that.

    If you plug in wildly optimistic projections for a company's future growth or profitability, you’re just fooling yourself. You'll end up with an inflated intrinsic value that creates a false sense of security, making a risky investment look like a sure thing.

    Falling for Value Traps

    Another classic pitfall is mistaking a cheap stock for a good value. Look, some companies are in the bargain bin for a very good reason—their business is circling the drain. This is what's known as a value trap.

    Sure, a low price might signal a wide margin of safety on paper. But if the company's intrinsic value is also collapsing, that margin will evaporate before you know it.

    You always have to ask why a stock is cheap. Is the market just being pessimistic for a little while, or is there a fundamental, business-breaking flaw that justifies the low price? A true margin of safety exists when a good company is temporarily mispriced, not when a failing business is priced for disaster. To really nail this, you first need a solid handle on what a business is actually worth. You can learn more about finding a company's true worth by understanding intrinsic value in our detailed guide.

    Being Too Rigid and Static

    It's also a huge mistake to apply a one-size-fits-all margin of safety to every single stock. Think about it: a stable, predictable utility company simply doesn't require the same 50% discount as a high-flying, volatile tech firm. You have to tailor your required margin to the specific risks of the business and its industry.

    A margin of safety is not a static number you calculate once and then forget about. It is a dynamic buffer that must be re-evaluated as new information comes to light.

    Finally, so many investors cling to an old valuation like it's gospel. A company’s intrinsic value is not set in stone. When big things happen—a new competitor bursts onto the scene, the CEO resigns, or an entire industry gets upended—you must update your analysis.

    If you fail to adjust your intrinsic value estimate, your margin of safety calculation becomes irrelevant. You're left exposed to risks you no longer have a buffer for.

    Got Questions? We've Got Answers

    Even after you’ve got the formulas down, putting the margin of safety to work in the real world will throw a few curveballs your way. Let's tackle some of the most common questions that pop up.

    Is Margin of Safety Just a "Value Investor" Thing?

    While it’s definitely the bedrock of value investing, the idea of building a buffer against being wrong is just smart investing, period. Anyone can use it.

    A growth investor, for example, can apply the same principle by using conservative estimates for future growth. Instead of plugging in wildly optimistic numbers, they build in a cushion. This helps make sure they aren't overpaying for explosive earnings that might fizzle out—that’s their margin of safety.

    At the end of the day, demanding a discount to what you think something is worth is a powerful risk management tool, no matter your strategy. It forces you to think about what could go wrong before you start dreaming about what could go right.

    Can the Margin of Safety Be Negative?

    Absolutely, and when it is, you need to pay attention. A negative margin of safety is a flashing red light telling you the current market price is higher than your calculated intrinsic value.

    A negative number is a clear warning sign. From your perspective, the stock is overvalued. According to value investing principles, that’s an immediate signal to walk away. The investment offers zero cushion and comes with a whole lot of downside risk.

    How Often Should I Recalculate a Stock's Intrinsic Value?

    Your valuation isn’t a one-and-done deal. Think of it as a living number. You have to revisit your intrinsic value calculation whenever new, meaningful information comes out that could genuinely change the company's future.

    So, when should you pull up your spreadsheet again?

    • Quarterly Earnings Reports: These are non-negotiable. They give you fresh data on revenue, profits, and what management is seeing on the horizon.
    • Major Industry Shifts: A disruptive new technology or a big regulatory change can completely alter a company’s competitive moat overnight.
    • Competitor News: If a tough new rival enters the scene or a major competitor goes bust, the whole landscape changes.

    Recalculating keeps your margin of safety calculation from getting stale and ensures your original investment thesis still makes sense.


    At Investogy, we build conviction by showing our work. Our free weekly newsletter shares the "why" behind every move in our transparent, real-money portfolio, helping you learn from our successes and our mistakes. Subscribe to Investogy for free.

  • 12 Best Investing Newsletters for Smarter Picks in 2025

    12 Best Investing Newsletters for Smarter Picks in 2025

    Navigating the stock market can feel like trying to find a clear path through a dense, noisy jungle. Every day, you're bombarded with hot stock tips, complex market analysis, and conflicting financial news. The sheer volume of information is overwhelming, making it difficult to distinguish actionable insights from distracting noise. This is the core problem that a high-quality investing newsletter solves: it acts as your expert guide, curating research, providing structured analysis, and delivering a focused signal directly to your inbox.

    Finding the best investing newsletters for your specific goals, however, presents its own challenge. Are you a long-term value investor, a dividend-focused retiree, a growth-oriented speculator, or a passive index fund enthusiast? The right service for one person could be a costly mistake for another. A newsletter excelling at in-depth fundamental analysis might be useless to a trader who needs timely technical alerts.

    This guide is designed to cut through that second layer of noise. We have meticulously researched, subscribed to, and analyzed the top options available today to help you make an informed decision. Instead of generic marketing copy, you'll find a detailed breakdown of each service, including:

    • Core Investment Philosophy: What strategy does the newsletter follow?
    • Ideal Investor Profile: Who is this service built for?
    • Key Features & Performance: What do they offer, and how has it performed?
    • Pricing and Practical Considerations: What does it cost, and what are the limitations?

    Each profile includes direct links and screenshots to give you a clear view of the user experience. Our goal is to provide a comprehensive resource that helps you move from confusion to clarity, equipping you with the right tool to support your investment strategy.

    1. Investogy

    Best For: Actionable, transparent insights in a concise format

    Investogy has rapidly distinguished itself as one of the best investing newsletters for retail investors who value clarity and transparency over noise. It rejects the "firehose" approach of overwhelming readers with dozens of conflicting stock picks. Instead, it offers a single, meticulously researched investment thesis each week, delivered in a digestible 3-minute read.

    This platform's core strength lies in its radical transparency. Every investment idea is backed by a real-money portfolio, publicly tracked since its inception in 2022. This "skin in the game" model provides unparalleled accountability, allowing readers to see not just the winning picks but also the rationale behind losing positions and the lessons learned. This approach builds genuine trust and provides a real-world educational framework.

    Why It Stands Out

    Investogy excels by blending sophisticated, narrative-driven analysis with an accessible, no-jargon writing style. Each newsletter articulates a clear investment thesis inspired by value investing principles, explaining the "why" behind a decision rather than just presenting data. This methodology empowers readers to build their own conviction.

    The newsletter is trusted by a growing community of over 7,500 readers, including professionals from major tech firms like Google and OpenAI, yet it remains completely free. It is an ideal resource for investors seeking to supplement their research with high-quality, unbiased analysis without a hefty subscription fee.


    Key Features:

    • Public Real-Money Portfolio: Tracks a portfolio from $50,000 to over $60,000, offering full transparency on every buy, sell, and hold decision.
    • Concise Weekly Insights: Each issue is designed to be read in three minutes, respecting the reader's time while delivering impactful analysis.
    • Narrative-Driven Theses: Focuses on storytelling to explain complex investment concepts and the long-term vision for each stock pick.
    • Educational Focus: Candidly discusses both successful and unsuccessful investments, providing valuable lessons on risk management and strategy.

    Pros:

    • Completely free to subscribe.
    • Unmatched transparency with a publicly tracked, real-money portfolio.
    • Concise format delivers actionable insights quickly.
    • Builds investor confidence through well-articulated research.

    Cons:

    • Focuses on a single portfolio, offering a narrower range of ideas than larger services.
    • Content is for informational purposes and is not personalized financial advice.

    Website: https://investogy.com

    2. The Motley Fool

    The Motley Fool is a giant in the financial media space, and its premium newsletters are a cornerstone of its business. Their flagship service, Stock Advisor, is arguably one of the most well-known and best investing newsletters for both new and experienced investors focused on long-term growth. The core of the service is simple: members receive two new stock recommendations each month, complete with a detailed research report explaining the investment thesis.

    The Motley Fool

    Beyond the monthly picks, members get access to a list of “Best Buys Now,” which are timely opportunities selected from their universe of past recommendations. This feature is particularly useful for investors looking to deploy new capital immediately rather than waiting for the next official release. The Motley Fool's approach is designed for buy-and-hold investors, and their educational content often reinforces this philosophy. To learn more about this approach, you can explore some of the best long-term investment strategies.

    Key Features & User Experience

    The platform is straightforward to navigate. Once logged in, you can easily find current recommendations, performance trackers, and an extensive library of educational articles. The community forums are a significant value-add, allowing members to discuss picks and investing strategies with fellow subscribers.

    • Pricing: Stock Advisor is often available for an introductory price of $99 for the first year, renewing at $199/year. Higher-tier services can cost thousands.
    • Pros: The service has a long, transparent, and impressive track record. The recommendations are easy to understand and act on, making it accessible for beginners.
    • Cons: The marketing is aggressive, with frequent upsells to more expensive services. Some investors may find the two-pick-per-month cadence too slow.

    Visit The Motley Fool

    3. Seeking Alpha

    Seeking Alpha stands apart by crowdsourcing its investment analysis from thousands of contributors, creating a massive and diverse content library. While it offers traditional newsletters like its popular free daily briefing, Wall Street Breakfast, its core value lies in the depth of research available through its Premium subscription. This model makes it one of the best investing newsletters for those who prefer to conduct their own due diligence using a wide array of opinions and data points.

    The platform provides access to articles covering nearly every publicly traded stock, often from multiple perspectives. The Premium service unlocks powerful features like proprietary "Quant Ratings," which offer a data-driven score on a stock's potential, as well as access to author ratings and performance history. Subscribers can also read earnings call transcripts and use advanced stock screeners, positioning it as a comprehensive research hub. For a closer look at similar platforms, you can find a breakdown of the top stock market research tools.

    Key Features & User Experience

    Navigating Seeking Alpha is intuitive, with a powerful search function and the ability to follow specific authors or stocks to customize your feed. The user experience centers on empowering investors with information, from quick-glance ratings to in-depth, long-form analysis. Portfolio-syncing tools allow for customized alerts and a tailored news flow.

    • Pricing: A free "Basic" plan offers limited article access. Seeking Alpha Premium is often available for an introductory price of around $189 for the first year, renewing at $239/year.
    • Pros: Enormous breadth of coverage on thousands of stocks, including small-caps often ignored by larger firms. The blend of contributor analysis and quantitative data tools is unique.
    • Cons: The quality of contributor articles can vary widely. The renewal pricing is significantly higher than the promotional rate, and some users report issues with the billing process.

    Visit Seeking Alpha

    4. Morningstar Newsletters

    Morningstar is a heavyweight in the world of independent investment research, and its newsletters reflect that deep, analytical pedigree. Unlike services focused purely on hot stock picks, Morningstar offers a range of publications tailored to different investment styles, with a strong emphasis on mutual funds, ETFs, and long-term portfolio construction. Their approach is less about hype and more about providing the fundamental analysis needed for informed decision-making.

    Morningstar Newsletters

    This makes their newsletters an excellent choice for investors who prefer managing a diversified portfolio of funds rather than individual stocks. Publications like FundInvestor and StockInvestor provide analyst-driven commentary, model portfolios, and ratings that leverage Morningstar's iconic research framework. The content is designed to educate and guide, making it one of the best investing newsletters for those who want to understand the "why" behind their investment choices.

    Key Features & User Experience

    The platform delivers its content via clean, professional-looking PDF newsletters, which are easy to download and read. The information is dense but well-organized, with clear sections for market commentary, fund analysis, and portfolio updates. The experience is geared toward a more serious, research-oriented investor who appreciates data-driven insights.

    • Pricing: Pricing varies by publication. For example, StockInvestor is priced at $145/year, while others may have different subscription costs. A premium membership provides broader access.
    • Pros: Renowned for its unbiased, methodical, and independent research. It's an exceptional complementary resource for investors focused on funds and ETFs.
    • Cons: Less focused on high-growth individual stock "tips" and more on broad portfolio strategy. Some newsletters are best utilized when integrated with Morningstar’s broader premium ecosystem.

    Visit Morningstar Newsletters

    5. Zacks Investment Research

    Zacks Investment Research is a powerhouse for data-driven investors, building its reputation on a proprietary stock-rating system known as the Zacks Rank. This system, which heavily emphasizes earnings estimate revisions, provides a quantitative framework for identifying potentially strong performers. The premium service gives subscribers access to curated lists like the Zacks #1 Rank List and the Focus List portfolio, which is a collection of 50 stocks with long-term growth potential.

    Unlike narrative-driven newsletters, Zacks is all about the numbers. It provides extensive equity research reports, screening tools, and weekly market analysis that appeal to investors who prefer fundamental analysis. The platform is designed to help users systematically find stocks that meet specific criteria, making it a valuable resource for those learning how to build an investment portfolio from the ground up based on quantitative factors.

    Key Features & User Experience

    The Zacks platform is dense with information, which can be overwhelming for new users but is a treasure trove for experienced investors. The dashboard allows for deep dives into individual stock reports, portfolio tracking, and access to a wide array of powerful screeners. The weekly market analysis emails provide timely insights, keeping subscribers informed of broader economic trends that could impact their holdings.

    • Pricing: The Zacks Premium subscription is typically priced at $249/year, with a 30-day free trial often available. Higher tiers like Investor Collection and Ultimate exist at significantly higher price points.
    • Pros: The quantitative Zacks Rank system provides an objective, data-backed approach to stock selection. The screening tools are robust and excellent for fundamentals-oriented investors.
    • Cons: The platform features a complex, multi-tiered subscription model with frequent upsells. Some users report that the value proposition of the higher-cost tiers can be difficult to justify.

    Visit Zacks Investment Research

    6. InvestorPlace

    InvestorPlace has carved out a niche as a prolific publisher of financial research, offering a wide spectrum of both free and paid newsletters. This makes it an excellent entry point for investors wanting to sample different analytical styles before committing to a premium service. Their free offerings, such as Market 360 and Hypergrowth Investing, provide daily market commentary and stock ideas, which helps users get a feel for the company's approach to market analysis.

    InvestorPlace

    The platform's strength lies in its diverse roster of analysts, each focusing on specific sectors like technology, biotech, or macroeconomic trends. This allows subscribers to follow experts who align with their personal investment interests. For those ready to upgrade, InvestorPlace offers tiered premium advisories, such as Innovation Investor, which focus on high-growth, disruptive companies, making it one of the best investing newsletters for those with a higher risk tolerance.

    Key Features & User Experience

    The website is structured to funnel users from free content to paid subscriptions. While navigating the various product pages can feel a bit like a sales pitch, the core newsletter content is typically delivered directly via email, making it easy to consume. The experience is heavily focused on the specific analyst and their service, rather than a centralized platform.

    • Pricing: Free newsletters are available with an email sign-up. Paid services typically start from $49-$199 per year, with elite-tier packages costing several thousand dollars.
    • Pros: The large volume of free content provides a no-risk way to evaluate their analysts. They cover a broad range of investment themes, from conservative income strategies to speculative growth stocks.
    • Cons: The marketing can be aggressive, with frequent promotional emails and webinars. The sheer number of different services can be overwhelming for new users.

    Visit InvestorPlace

    7. Stansberry Research

    Stansberry Research is one of the largest independent financial research firms in the United States, offering a vast array of subscription-based newsletters. With a catalog spanning everything from conservative income and value investing to speculative growth, crypto, and trading strategies, it caters to nearly every type of investor. Their daily publication, the Stansberry Digest, provides market commentary and highlights key insights from across their various advisory services, making it a valuable resource for members.

    Stansberry Research

    The firm's sheer scale allows it to employ a deep roster of editors and analysts, each with a specific area of expertise. This results in highly specialized content that goes far beyond general market analysis. The member portal is robust, featuring watchlists, portfolio tracking tools, and access to an extensive archive of past reports and issues, making it a comprehensive platform for dedicated subscribers.

    Key Features & User Experience

    Navigating the Stansberry ecosystem can be overwhelming at first due to the sheer number of products, but the member dashboard is well-organized. It consolidates your subscriptions, provides access to special reports, and tracks the performance of recommended portfolios. The active content stream, which includes frequent newsletters and video updates, ensures that subscribers are kept well-informed on market movements and a service’s active positions.

    • Pricing: Varies dramatically, from entry-level services under $200/year to premier, all-access memberships costing thousands, plus annual maintenance fees. Many offers are presented through sales funnels.
    • Pros: An extremely broad catalog of newsletters covering diverse strategies, supported by a large and established team of editors. The content is frequently updated.
    • Cons: The complex pricing, frequent upselling, and confusing maintenance fee structures for lifetime memberships can be a significant drawback for new users.

    Visit Stansberry Research

    8. TheStreet

    TheStreet, founded by Jim Cramer, has evolved into a comprehensive financial news and analysis platform. It offers a wide range of content, from free daily market summaries to premium, high-conviction trade ideas. Its strength lies in blending timely news coverage with actionable investment commentary, making it a valuable resource for traders who want to stay on top of market-moving events. The free email newsletters provide a great entry point, offering daily insights and alerts on specific authors or stock tickers.

    TheStreet

    For those seeking more direct guidance, the premium service, TheStreet Pro, delivers expert-curated research, real-time trade alerts via email and SMS, and access to a community of like-minded investors. This tiered approach allows users to start with free, broad-market analysis and upgrade for more specialized strategies. The platform is designed for active engagement, with both its mobile and desktop experiences optimized for frequent updates, making it one of the best investing newsletters for those who follow the market closely.

    Key Features & User Experience

    Navigating TheStreet is straightforward, with a clear distinction between its free news content and premium Pro services. The sign-up process for free newsletters is simple, and the email preferences center gives users granular control over the content they receive. This customization helps filter out noise and focus on topics of interest.

    • Pricing: Free newsletters are available. TheStreet Pro has premium pricing, which often requires signing up or viewing a presentation to see the current offer.
    • Pros: Offers a robust free tier with customizable alerts. The platform is well-optimized for delivering frequent market news and updates on any device.
    • Cons: Premium pricing details can be opaque, often hidden behind sales pages. The content mix includes general financial news, which may not appeal to users seeking only pure investment tips.

    Visit TheStreet

    9. Bloomberg Newsletters

    Bloomberg is a titan in the world of financial news, and its collection of newsletters offers institutional-grade analysis delivered directly to your inbox. While not a stock-picking service, Bloomberg provides some of the best investing newsletters for understanding the macroeconomic forces, market dynamics, and corporate events that drive asset prices. The content ranges from daily market briefs to deep-dive weekly analysis, catering to sophisticated investors who want high-level context.

    A standout is the widely acclaimed Money Stuff by Matt Levine, which offers a witty and insightful take on the most complex stories in finance. Beyond free offerings, Bloomberg bundles premium newsletters for subscribers, covering specific beats like M&A (Deals), distressed debt (The Brink), and market anomalies (Odd Lots). This makes it a premier source for investors who value expert commentary and global financial intelligence over simple buy-or-sell recommendations.

    Key Features & User Experience

    Accessing the newsletters is straightforward through the Bloomberg website, with a clean interface for managing subscriptions. The daily and weekly cadences allow users to tailor their information flow, from quick morning updates to more thoughtful weekend reads. The true value lies in the editorial quality and the depth of expertise from its global team of journalists and analysts.

    • Pricing: Many top-tier newsletters, including Money Stuff, are free. Access to premium bundles like Deals and The Brink requires a Bloomberg.com digital subscription, which costs $34.99/month or $415/year.
    • Pros: Exceptional quality of writing and in-depth analysis of complex financial topics. Offers a mix of free and premium content, with newsletters covering a wide range of market sectors.
    • Cons: Not a stock recommendation service. The most valuable, niche newsletters are locked behind a relatively expensive subscription paywall.

    Visit Bloomberg Newsletters

    10. Financial Times Newsletters

    The Financial Times (FT) is a global authority on business and economics, and its suite of newsletters extends this reputation directly to your inbox. Rather than offering a single stock-picking service, the FT provides a broad range of briefings and premium analysis columns. Its flagship premium newsletter, Lex, is renowned for its sharp, agenda-setting commentary on corporate finance and global markets, making it a must-read for sophisticated investors. The FT's offerings cater to those who value high-level, institutional-quality analysis over specific buy/sell signals.

    Financial Times Newsletters

    From daily market briefings like FirstFT to specialized topics, the platform covers a wide spectrum. This makes the FT an excellent resource for investors who want to build their own macro-level thesis based on world-class journalism and data. The focus is less on hand-holding and more on providing the context and insight needed to make informed decisions across a global portfolio. This approach positions it as one of the best investing newsletters for those seeking depth and a worldwide perspective.

    Key Features & User Experience

    Managing your subscriptions is simple through a centralized FT account dashboard, allowing you to easily add or remove newsletters. The content is delivered in a clean, professional email format that is easy to read on any device. The user experience reflects the publication's high editorial standards, with a focus on delivering concise, impactful information without unnecessary fluff.

    • Pricing: Many newsletters are free, but premium content like Lex requires an FT Standard ($372/year) or Premium ($549/year) subscription.
    • Pros: Unparalleled global market coverage with exceptionally high editorial standards. A wide variety of free and premium newsletters caters to different needs.
    • Cons: Access to the most valuable investment analysis is locked behind a relatively expensive subscription paywall. The content is analytical rather than providing actionable stock picks.

    Visit Financial Times Newsletters

    11. TipRanks Pro Newsletters

    TipRanks leverages its massive data-aggregation engine to produce several of the best investing newsletters for data-driven investors. Rather than relying on a single guru, their newsletters like Value Investing Ideas and Smart Investor are powered by quantitative factors, aggregated analyst ratings, and insider transaction data. Each week, subscribers receive a new stock pick backed by the platform's proprietary "Smart Score" and a clear breakdown of why the stock was chosen.

    TipRanks Pro Newsletters

    This approach is ideal for investors who trust data over narrative and want to see the numbers behind each recommendation. The newsletters are fully integrated with the main TipRanks platform, allowing subscribers to seamlessly dive deeper into any stock's analyst consensus, hedge fund activity, or news sentiment. This creates a powerful research ecosystem where the newsletter acts as a starting point for further due diligence.

    Key Features & User Experience

    The newsletters are delivered via email in a clean, easy-to-digest format. The rationale for each pick is presented with charts and key data points, making it scannable and efficient. Existing TipRanks users will find the experience especially smooth, as the content links directly to familiar tools and dashboards on the main site.

    • Pricing: Newsletters like Value Investing Ideas are often introduced at around $29/month, billed annually. Pricing can vary based on promotions.
    • Pros: Recommendations are backed by a transparent, quantitative process. The integration with the broader TipRanks research platform is a major advantage.
    • Cons: The service is relatively new compared to legacy publishers with multi-decade track records. Pricing details are not always clear without starting the checkout process.

    Visit TipRanks Pro Newsletters

    12. Substack (Finance/Investing newsletters)

    Substack has become the de facto home for independent financial writers, transforming into a massive discovery platform for some of the best investing newsletters available today. Unlike traditional services, Substack is a marketplace where individual creators publish directly to their audience. This allows investors to find hyper-niche content covering everything from deep-dive value investing and quantitative analysis to options trading, crypto, and macroeconomic trends.

    Substack (Finance/Investing newsletters)

    The platform's strength lies in its sheer variety and the direct connection it fosters between writer and reader. You can subscribe to established financial minds or discover emerging analysts. Many of the top publications offer a mix of free and paid content, giving you a chance to sample the analysis and writing style before committing to a subscription. For investors seeking unique perspectives beyond mainstream financial media, Substack is an essential resource.

    Key Features & User Experience

    The platform is designed for discovery and consumption. The website and mobile app feature leaderboards and category tabs that help you find popular and rising newsletters in the finance space. Each publication has its own page, and subscribing is a simple, one-click process. Since each writer controls their own newsletter, the format, frequency, and quality can differ significantly from one to the next.

    • Pricing: Varies entirely by creator. Subscriptions can range from a few dollars per month to hundreds of dollars per year. Many offer free tiers.
    • Pros: Unmatched breadth of investing niches and expert voices. Many creators provide substantial free content, allowing you to "try before you buy."
    • Cons: Quality and consistency vary widely, making discovery a noisy process. There is no standardized publishing cadence or pricing structure.

    Visit Substack

    Top 12 Investing Newsletters Comparison

    Newsletter Provider Core Features/Focus User Experience & Quality ★ Value Proposition 💰 Target Audience 👥 Unique Selling Points ✨
    Investogy 🏆 Weekly 3-min narrative-driven analysis, 1 tracked real-money portfolio Concise, expert yet accessible ★★★★☆ Free subscription 💰 Data-driven novices & seasoned pros 👥 Transparent portfolio, “skin in the game” insights 🏆
    The Motley Fool Stock picks, monthly recommendations, model portfolios Established track record ★★★☆☆ Multiple paid tiers, money-back guarantee 💰 Long-term investors with varying budgets 👥 Tiered services + large community
    Seeking Alpha Free & premium newsletters, quant ratings, screeners Mixed reviews ★★★☆☆ Freemium + higher renewal pricing 💰 Active traders & research-oriented users 👥 Wide range, contributor research
    Morningstar Newsletters Fundamental analysis, funds focus, analyst-driven Methodical, independent ★★★★☆ Mostly paid, ecosystem integration 💰 Fund/ETF investors and portfolio managers 👥 Strong brand, focused research
    Zacks Investment Research Ranking system, weekly analysis, Focus Lists Strong research tools ★★★☆☆ Transparent pricing, multiple tiers 💰 Fundamentals-focused investors 👥 Zacks Rank system, free trials
    InvestorPlace Free daily plus tiered paid newsletters Broad coverage ★★★☆☆ Expensive top tiers, heavy marketing 💰 Growth and tech stock investors 👥 Multiple analyst perspectives
    Stansberry Research 30+ advisories, digest, watchlists Extensive content ★★★☆☆ Variable pricing, complex fees 💰 Diverse investor types seeking multiple insights 👥 Large catalog, member dashboards
    TheStreet Free newsletters plus expert Pro tier Easy signup, frequent updates ★★★☆☆ Premium tier pricing not always clear 💰 Frequent traders & news consumers 👥 SMS alerts, mobile optimized
    Bloomberg Newsletters Global markets focus, subscriber bundles High editorial quality ★★★★☆ Subscription required for premium 💰 Global investors & professionals 👥 Top macro & deal coverage
    Financial Times Newsletters Market briefs, premium Lex newsletter High editorial standards ★★★★☆ Premium subscription paywalls 💰 Global investors & finance professionals 👥 Agenda-setting analysis
    TipRanks Pro Newsletters Weekly stock picks with data, multiple styles Data-driven clarity ★★★☆☆ Pricing opaque 💰 TipRanks users and quantitative investors 👥 Integrated platform data
    Substack (Finance/Investing) Wide independent newsletter hosting, free & paid content Varied quality, discovery noise ★★★☆☆ Creator-controlled pricing 💰 Niche investors, wide range 👥 Large variety, independent voices

    Making Your Final Choice and Committing to a Process

    Navigating the crowded world of investment analysis can feel overwhelming, but as we've detailed, the right resource can fundamentally change your approach to the market. We've explored a wide spectrum of the best investing newsletters, from the established, stock-picking powerhouses like The Motley Fool and Zacks Investment Research to the comprehensive data platforms of Morningstar and Seeking Alpha. Each service offers a unique lens through which to view the market, tailored to different goals, risk tolerances, and levels of engagement.

    The core takeaway is that there is no single "best" newsletter for every person. The ideal choice is deeply personal and depends entirely on your individual investing philosophy. A long-term, buy-and-hold investor focused on dividend income will find immense value in Morningstar's deep-dive analysis, while a more active trader seeking short-term opportunities might gravitate toward the timely alerts from a service like TheStreet. Likewise, those who value independent, niche analysis might find their perfect match among the diverse voices on Substack.

    A Framework for Your Decision

    Before you commit your capital-both financial and intellectual-to a subscription, it’s crucial to step back and create a decision-making framework. The most effective way to leverage any of these tools is to align them with a pre-defined strategy, not the other way around.

    Consider these critical questions to guide your selection:

    • What is my primary investment goal? Are you aiming for rapid growth, steady income generation, capital preservation, or a balanced mix? Your answer will immediately filter the list. For example, growth-focused investors might lean towards InvestorPlace, while income seekers may prefer Stansberry Research's offerings.
    • How much time can I realistically commit? Be honest with yourself. If you have a full-time job and a family, a service that requires daily monitoring and quick trades is not a good fit. A weekly or monthly digest that provides high-conviction, long-term picks would be far more suitable.
    • What is my true risk tolerance? Many newsletters recommend speculative or high-volatility stocks. If market downturns make you anxious, look for services that prioritize blue-chip companies, ETFs, or established dividend payers.
    • Do I want ideas, data, or both? Some investors just want a few high-quality stock picks to research further. Others want access to a full suite of screeners, charting tools, and portfolio trackers to conduct their own analysis. Seeking Alpha and TipRanks serve the latter, while many others focus on the former.

    Implementing Your Chosen Resource

    Once you’ve made a selection, the work has just begun. Subscribing to one of the best investing newsletters is not a passive ticket to wealth; it’s a tool that requires active and disciplined implementation.

    Start by paper trading the recommendations for a month or two. This allows you to understand the newsletter's style, cadence, and typical performance without risking real money. It also helps you see if the advice aligns with your emotional comfort level during periods of market volatility.

    Furthermore, never follow any recommendation blindly. Use the newsletter's pick as the starting point for your own due diligence. Verify the thesis, understand the company's fundamentals, and ensure the investment fits within your established portfolio allocation. A newsletter should supplement your judgment, not replace it. By committing to this process, you transform a simple subscription into a powerful component of a well-oiled, strategic investment machine, empowering you to make more informed and confident decisions on your path to financial growth.


    Tired of sifting through conflicting opinions and dense reports? The Investogy platform distills insights from top analysts and sources into clear, actionable investment ideas, helping you build a smarter portfolio without the noise. Discover your next great investment by visiting Investogy to see how our data-driven approach simplifies your research process.

  • How to Invest 100k for Passive Income

    How to Invest 100k for Passive Income

    So you've got $100,000 ready to deploy. The goal? To turn that capital into a steady stream of passive income. Most people get this wrong right out of the gate. They jump straight into chasing hot stocks or trendy assets. The real secret is diversifying that cash across a mix of reliable, cash-flowing workhorses: think dividend stocks, Real Estate Investment Trusts (REITs), and even some high-yield bonds.

    Building a portfolio this way accomplishes two critical things. First, it balances out your risk so a dip in one area doesn't torpedo your entire plan. Second, it creates multiple, independent income streams. That’s how you truly break free from relying on a single paycheck. A well-designed portfolio built from $100k can realistically spin off thousands in annual income, all while your initial capital holds its ground or even grows.

    Laying the Groundwork for Your $100k Investment

    Before you invest a single dollar of that $100,000, the most important work needs to happen. Let's be clear: successful passive income investing isn't about timing the market or finding some secret loophole. It's a deeply personal journey that starts with a rock-solid foundation.

    This planning phase is what separates the disciplined, long-term investors from those who get spooked by headlines and make costly, emotional mistakes. What we're doing here is building your personal investment blueprint—a straightforward guide that will dictate every move you make from here on out. This ensures your strategy is perfectly tailored to your life, not someone else's.

    First, What Are Your Financial Goals and Timeline?

    "Passive income" is a great buzzword, but what does it actually mean for you? This isn't a trick question; it demands a specific answer. Are you trying to add a few hundred extra bucks to your monthly budget? Are you trying to replace your salary entirely and punch out of the 9-to-5 early? Or is this about building a financial safety net for the future?

    Your timeline is just as crucial. A 30-year-old has a multi-decade runway, which means they can afford to be a bit more aggressive. They might allocate a bigger chunk to growth-oriented REITs that promise both appreciation and dividends down the line.

    On the other hand, someone who is 55 and eyeing retirement is playing a different game entirely. Their priority is capital preservation. For them, stable, blue-chip dividend stocks that deliver reliable quarterly payments are going to look a lot more attractive.

    The best investment strategies aren't built on market predictions. They're built on a crystal-clear understanding of your personal goals and how much time you have. Your blueprint should be a reflection of your life, not the daily chaos of the news cycle.

    Second, Get Brutally Honest About Your Risk Tolerance

    Your stomach for risk is the other cornerstone of your plan. How would you really feel if your $100k portfolio took a hit and dropped to $80k during a rough market patch? An honest answer right now is what will stop you from panic-selling at the absolute worst moment later.

    To get a handle on this, think about a few things:

    • Your Gut Reaction: Do market swings make you anxious? Does checking your portfolio feel like a roller coaster?
    • Your Financial Cushion: Is your job secure? Do you have a healthy emergency fund tucked away?
    • Your Knowledge Base: How comfortable are you with the assets you plan on buying? Our guide on how to build a stock portfolio is a great place to start building that confidence.

    If you know you're risk-averse, your portfolio should reflect that. You'll lean more heavily into investment-grade bonds and diversified dividend ETFs. But if you're comfortable with more volatility for the chance at higher returns, you could explore things like real estate crowdfunding. And if physical real estate is part of your passive income plan, you'll definitely want to understand all the rental property financing options out there to make your $100k go further.

    This groundwork—setting goals, defining your timeline, and knowing your risk profile—is honestly the most valuable investment you'll make. It’s what transforms you from a gambler into a strategic, long-term income investor.


    Quick Guide to Investing $100k for Passive Income

    To give you a clearer picture of the landscape, here's a quick look at some of the most common passive income vehicles. This isn't exhaustive, but it shows how different options stack up in terms of potential returns, risk, and how easily you can access your cash.

    Investment Type Potential Annual Return Risk Level Liquidity
    High-Yield Savings Account 4% – 5% Very Low High
    Dividend Stocks (ETFs) 2% – 4% Medium High
    REITs (Real Estate) 4% – 8% Medium-High High
    Corporate/Municipal Bonds 3% – 6% Low-Medium Medium
    Real Estate Crowdfunding 6% – 10%+ High Low
    P2P Lending 5% – 9% High Low

    This table helps illustrate the classic trade-off: higher potential returns almost always come with higher risk and lower liquidity. The key is to build a balanced portfolio that aligns with the personal blueprint you just created.

    Charting a Course for Your $100k Income Portfolio

    Alright, you’ve got your financial house in order. Now for the fun part: building the engine that will power your passive income. The heart of any real income strategy is smart asset allocation—which is just a fancy way of saying you don't put all your eggs in one basket. This isn't about chasing the latest hot stock tip; it's about methodically splitting up your $100,000 to build a balanced, resilient portfolio that’s designed to spit out cash flow.

    A solid plan is what separates methodical investing from simple guesswork. For a $100k portfolio focused on income, a really effective approach is to spread the capital across a few different asset classes. This helps smooth out the inevitable bumps in the market and makes sure that if one area is having a tough time, the others can pick up the slack.

    The 40/30/20/10 Allocation Model

    I've found a proven framework for income investors is the 40/30/20/10 split. It's a powerful way to structure things because it balances stability with growth and even leaves a little room for some higher-yield plays.

    Here’s how it looks with your $100,000:

    • $40,000 (40%) in Dividend Stocks & ETFs: This is the bedrock. You're getting reliable income from established, blue-chip companies.
    • $30,000 (30%) in Real Estate (REITs): This slice gives you a piece of the property market's cash flow without the headaches of being a landlord.
    • $20,000 (20%) in High-Yield Bonds or Bond ETFs: Think of these as a stabilizing force, offering steady interest payments with less drama than the stock market.
    • $10,000 (10%) in Alternative Income Sources: This is your "explorer" fund—a smaller portion for dipping a toe into higher-yield opportunities like P2P lending.

    This allocation gives us a clear roadmap. So, let's get practical and talk about putting that capital to work in the two biggest chunks of this portfolio.

    Building Your Stock and Real Estate Foundation

    For the $40,000 you’ve earmarked for equities, the name of the game is dependability. Instead of trying to become a stock-picking genius overnight, a much smarter move is to use low-cost, high-quality dividend ETFs.

    The Schwab U.S. Dividend Equity ETF (SCHD) is a fantastic example. It tracks an index of about 100 financially solid U.S. companies that have a long, boring history of paying out dividends. It gives you instant diversification across proven winners. This automates your stock selection and lets you focus on businesses that are already proven income-generators. You get broad exposure and a steady stream of quarterly payments with almost zero effort.

    Next up is your $30,000 real estate allocation. You've got a couple of good options here, and your choice will come down to how much liquidity you want versus potential returns.

    • Publicly-Traded REITs: Investing in a REIT like Realty Income (O) or a diversified REIT ETF like VNQ is as simple as buying a stock. The big advantage is liquidity—you can sell your shares anytime the market is open.
    • Real Estate Crowdfunding: Platforms like Fundrise or CrowdStreet let you pool your money with other investors to buy into larger commercial or residential deals. The trade-off is that your money is often tied up for several years, but the potential returns are typically higher to compensate for that lack of liquidity.

    For most people starting out, a mix of liquid REIT ETFs and a smaller stake in a crowdfunding platform strikes a great balance. You get the immediate income and flexibility of public REITs while tapping into the higher-yield potential of private real estate.

    The infographic below really helps visualize how a physical property gets turned into a reliable, rent-earning asset—the core principle of what we're doing here.

    Image

    This visual gets to the heart of real estate investing for passive income: turning a tangible asset into a consistent cash flow machine.

    Fine-Tuning Your Fixed Income and Alternatives

    With the remaining $30,000, we'll focus on defense and a bit of offense. Your $20,000 in bonds acts as your portfolio’s defensive line. You could go for high-yield bond ETFs (often called "junk bonds") for attractive interest rates, but they come with more risk. A more balanced choice might be an aggregate bond ETF that holds a mix of government and corporate debt for stability.

    Finally, that last $10,000 is for exploring alternatives. This is where you can look into peer-to-peer lending platforms or other unique income funds that aren't directly tied to the stock market's daily whims. Since it’s a smaller part of your portfolio, you can take on a bit more calculated risk for potentially higher rewards without sinking the whole ship.

    This whole process is about building a structure that can weather different economic storms. To really get into the weeds on this critical concept, check out our detailed guide on how to diversify an investment portfolio. Honestly, getting this part right is the single most effective way to protect your capital while building a reliable passive income stream.

    Generating Cash Flow from Dividend Stocks and ETFs

    Dividend investing is a classic for a reason—it just plain works. This is where we build the equity engine of your portfolio, the rock-solid core designed to churn out predictable cash flow. We’re going to move past the theory and get our hands dirty with the nitty-gritty of picking quality dividend stocks and Exchange-Traded Funds (ETFs).

    Image

    This slice of your portfolio, the $40,000 we’ve set aside, is all about stability and consistency. Think of it this way: you’re becoming a part-owner in established, profitable companies that have decided to share their success directly with you, the shareholder, through regular payments.

    Analyzing for Sustainable Income

    Picking the right dividend stocks is about more than just chasing the highest yield. In fact, a sky-high yield can sometimes be a red flag signaling a company in trouble. True, sustainable income comes from digging a bit deeper into a company’s financial health.

    When I’m vetting a potential dividend investment, I zoom in on a few key metrics:

    • Dividend History: I want to see companies that not only pay a dividend but have a long, proven track record of increasing it year after year. This shows a real commitment to shareholder returns and tells me they have their financial house in order.
    • Payout Ratio: This number reveals what percentage of a company's earnings is being handed out as dividends. A ratio between 40% and 60% is often the sweet spot. It tells me the dividend is well-covered and the company is still keeping enough cash to reinvest in its own growth.
    • Financial Stability: A quick check of the balance sheet for manageable debt is crucial. A business drowning in debt might have to slash its dividend during a downturn, which is the exact opposite of what we’re looking for.

    The Power of Dividend ETFs

    Let's be honest, analyzing individual stocks can feel like a full-time job for anyone just figuring out how to invest 100k for passive income. This is where dividend ETFs become your best friend. An ETF bundles dozens, sometimes hundreds, of dividend-paying stocks into one simple investment.

    This approach gives you instant diversification, which massively lowers your risk. Instead of your income depending on the fortunes of one or two companies, it's supported by a whole basket of them. It's the smartest way to build a durable income portfolio without needing to become a Wall Street analyst.

    Key Takeaway: The goal isn't just finding stocks that pay dividends today. It's about finding financially solid businesses that can keep paying and—more importantly—growing those dividends for years to come. That’s the real foundation of a reliable passive income stream.

    Putting It Into Practice: A Real-World Scenario

    Let's make this tangible. You’ve got $40,000 earmarked for this strategy. By putting that capital into a diversified dividend ETF with an average yield of 4%, you're setting yourself up to generate $1,600 in annual passive income.

    That breaks down to over $130 a month hitting your account, no extra work required. While that might not sound like a life-altering amount by itself, it’s a crucial piece of your larger income puzzle. Dividend-paying stocks are still one of the most reliable and accessible ways to generate passive income. In major markets, you’ll typically see yields from established companies ranging between 2% and 6% annually.

    Compounding Your Wealth with DRIPs

    Here’s where the real magic kicks in. Most brokerage platforms offer something called a Dividend Reinvestment Plan (DRIP). When you enroll, instead of getting your dividend payments in cash, they're automatically used to buy more shares of that same stock or ETF.

    This creates a powerful compounding effect. Those new shares you just bought will start generating their own dividends, which then buy even more shares. It's a virtuous cycle of wealth creation that hums along entirely in the background. Over a decade or two, this automated process can dramatically accelerate your portfolio's growth, turning a steady trickle of income into a serious source of wealth. This is how you truly make your money work for you.

    Going Beyond the Basics: Alternative Passive Income Streams

    To really diversify, you have to look beyond the usual suspects of stocks and bonds. While your equity and real estate holdings are the dependable core of this strategy, carving out a small slice for alternative income can seriously juice your overall returns and make you less reliant on the whims of the public markets.

    This is where we put that final $10,000 piece of your $100k portfolio to work. We're going to zero in on two interesting—and very different—avenues that are picking up steam: peer-to-peer (P2P) lending and direct investments into recession-resistant businesses.

    What makes these so compelling is that their cash flow isn't tied to the daily rollercoaster of the stock market. That can be a huge stabilizing force for your income, especially when things get choppy.

    Becoming the Bank with Peer-to-Peer Lending

    Peer-to-peer lending is a pretty cool concept. You’re essentially cutting out the middleman and acting as the bank yourself. Platforms like LendingClub or Prosper connect you, the investor, directly with people looking for personal loans. You contribute a small amount to many different loans and, in return, you collect the interest payments as they’re paid back.

    The appeal is obvious: the interest rates are often way better than anything you'd see in a high-yield savings account. It’s not crazy to see targeted annual returns in the 5% to 9% ballpark.

    But—and this is a big but—that higher potential return comes with a real risk: borrower default. If someone stops paying their loan, you could lose the money you invested in that specific loan.

    This is exactly why you have to diversify within the platform. Don't throw all your eggs in one basket. Instead of funding one big $5,000 loan, a much smarter move is to spread that same amount across 200 different loans at $25 a pop. Thankfully, most of these platforms have automated tools that make this a breeze, which is absolutely critical for blunting the impact of any single default.

    Investing in Businesses That Just Keep Working

    Another powerful way to generate alternative income is by investing in businesses that people need, no matter what the economy is doing. I’m talking about services that are part of everyday life. A perfect example that’s become a favorite for passive income investors is the express car wash model.

    These businesses have a few things going for them:

    • Subscription Gold: Many run on a monthly membership model, which creates a wonderfully predictable and recurring cash flow stream.
    • Lean Operations: Modern car washes are heavily automated, so they don't need a huge staff to run smoothly.
    • An Everyday "Luxury": Keeping a car clean is a simple, affordable thing people continue to pay for, even when they're tightening their belts.

    People are flocking to these kinds of investments because they offer stable cash flow and a clear path to scale. Their predictable income is a direct result of being essential, having those subscription models, and keeping overhead low. For anyone looking for passive income that isn't tied to Wall Street, it's an attractive combination. You can get a deeper dive into why investors are making this shift toward stable cash-flow businesses in 2025.

    Look, you're not going to buy a car wash outright with $10,000. But you can often find opportunities to invest in private equity funds or syndicates that specialize in buying and operating these kinds of cash-flowing assets.

    If you're thinking about real estate alternatives, a short-term rental can be a cash cow, especially if you lean on expert Airbnb management strategies to boost revenue to make it a more hands-off operation. Whether it’s a business or a property, these types of investments give you a tangible link to your income that you just don't get from owning a stock. By carefully exploring these options, you can add a truly robust and unique layer to your income portfolio.

    Automating and Monitoring Your Income Portfolio

    The real magic of investing for passive income is right there in the name: passive. A truly passive portfolio shouldn't have you glued to a screen, sweating every market dip. It should just hum along in the background, quietly building your wealth while you go on with your life.

    That’s where a little bit of smart automation and a simple monitoring system come into play. We’re going to build a framework that makes investing practically effortless and keeps your portfolio on track, all without stealing hours of your time. The goal is a sustainable, almost set-it-and-forget-it system that lets your money do the real work.

    Build Your Financial Flywheel

    First things first, you need to get yourself out of the equation. Relying on sheer willpower to remember to transfer and invest money every month is a surefire way to fail. Life gets busy, motivation wanes. Instead, we'll create an automated financial flywheel that guarantees consistency.

    Here’s a simple but incredibly effective setup:

    • Automate Bank Transfers: Log into your main bank account and set up a recurring, automatic transfer to your brokerage account. Treat it just like your rent or mortgage—it's non-negotiable. Whether it’s $500 or $1,000 a month, this relentless consistency is what stacks up serious wealth over time.

    • Automate Your Investments: Most modern brokerage platforms let you set up automatic investments into specific ETFs or mutual funds. As soon as your cash transfer hits the account, you can have it automatically buy shares of your core holdings, like that dividend ETF we talked about. This completely removes emotion and hesitation from the investing process.

    This two-part automation is the bedrock of disciplined, long-term wealth building. It brilliantly turns market downturns into your friend. Your automated buys will simply scoop up more shares when prices are low—a powerful concept known as dollar-cost averaging.

    Your system is far more important than your timing. A consistent, automated investment plan will almost always crush an emotional, reactive approach. Let the machines handle the discipline so you don’t have to.

    Use Technology to Your Advantage

    Trying to manually track multiple accounts—your brokerage for stocks, a platform for REITs, another for P2P lending—is a massive headache and a waste of time. Thankfully, we have tools that can pull everything together into a single, clean dashboard, giving you a 30,000-foot view of your entire financial world.

    I’m a big fan of portfolio tracking tools like Empower Personal Dashboard (what used to be Personal Capital). You link all your accounts once, and from then on, you can see your total net worth, asset allocation, and income streams all in one spot. It takes just a few minutes to check and immediately flags if any part of your portfolio has drifted out of balance. That kind of clarity is what lets you make smart, unemotional decisions.

    The Simple Quarterly Check-In

    "Passive" doesn't mean you're completely absent. While checking your portfolio daily will drive you crazy and lead to bad decisions, a quick, disciplined check-in once a quarter is a smart move. This isn't about panicking over short-term news; it's about strategic maintenance.

    Your quarterly check-in should be fast—no more than 30 minutes—and focus on one primary task: rebalancing.

    Over time, your portfolio will naturally drift. Some assets will grow faster than others, throwing your carefully planned allocation out of whack. For example, if stocks have a monster quarter, your 40% stock allocation might creep up to 45%, while your bond allocation shrinks. This drift quietly dials up your portfolio's overall risk without you even noticing.

    Rebalancing is just the simple act of selling a small piece of your high-flyers and using the cash to buy more of your underperformers. This mechanically forces you to buy low and sell high, bringing your portfolio right back to its target allocation. It’s a disciplined process that keeps your risk level exactly where you want it. This simple habit is what keeps your passive income machine well-oiled and running smoothly for years to come.

    Answering Your Top Questions on Investing $100k

    Image

    Putting $100,000 to work is a big step, and it's completely natural for a bunch of questions to pop up. Getting confident, direct answers to those "what if" scenarios is what separates a successful plan from a stalled one. This is where we'll tackle the most common questions I hear from investors learning how to invest $100k for passive income.

    We're going to cover everything from the taxman's take to how quickly you can realistically expect those income streams to start hitting your bank account. Think of this as your final gut check before you pull the trigger on your new plan.

    What Are the Tax Implications of Passive Income?

    Ah, taxes. They're an unavoidable part of making money, but the key is understanding that the IRS treats different income sources… well, differently. Not all passive income gets the same tax treatment, and knowing the difference is huge.

    For example, dividends from your stocks and ETFs are often qualified dividends. The good news is these are taxed at the much friendlier long-term capital gains rates, which are a lot lower than typical income tax rates for most people.

    On the flip side, income from things like peer-to-peer lending or the interest you earn from bond ETFs is usually taxed as ordinary income, right at your personal marginal tax rate.

    A rookie mistake is to completely ignore taxes until April rolls around. Being strategic about which assets you hold in tax-advantaged accounts, like a Roth IRA, can save you a fortune over the long haul. It lets your money compound much more effectively without the government taking a big slice every year.

    How Quickly Can I Expect to See Returns?

    This is the question everyone wants to ask, and for some assets, the answer is almost instantly. The minute your cash is invested in dividend ETFs or REITs, you're officially in line for their next scheduled payout.

    Here’s a realistic timeline for what to expect from the different income streams we've discussed:

    • Dividend Stocks & ETFs: You'll typically start seeing cash deposits on a quarterly basis. So, within about three months of investing, that first payment should show up.
    • REITs: These are a lot like dividend stocks. Most of the big, publicly-traded REITs pay out quarterly, though a few awesome ones actually pay monthly.
    • P2P Lending: Income here starts to trickle in almost immediately. As soon as borrowers make their first monthly payments, a piece of that flows back to you.
    • Real Estate Crowdfunding: These are longer-term investments. While some projects might kick off distributions during the development phase, the big payday often comes when the property is sold, which could be several years down the road.

    The name of the game is setting realistic expectations. You're not going to get rich in a week, but you absolutely will see tangible cash flow from your $100,000 portfolio within the first quarter.

    Is It Better to Invest the Full $100k at Once?

    For a long-term passive income strategy, the data usually favors investing the full amount at once. This is called lump-sum investing. History has shown that markets generally trend up over time, so getting your money in the game sooner gives it more time to grow.

    But there's a massive psychological catch here. If you're new to this, watching your freshly invested $100,000 portfolio suddenly drop by 10% during a market dip can be absolutely terrifying. It's the kind of fear that makes people panic and sell at the worst possible moment.

    The alternative is dollar-cost averaging (DCA). This means you break up your investment into smaller chunks over a set period—say, investing $25,000 a month for four months. This approach smooths out your average purchase price and dramatically reduces the risk of going "all-in" right before a downturn.

    While a lump sum might be slightly more optimal on paper over decades, DCA is a fantastic strategy for managing your own emotions and helping you sleep at night. At the end of the day, the best strategy is the one you can actually stick with.


    Ready to stop just reading about investing and start building real conviction? The team at Investogy shares every move they make in their real-money portfolio, explaining the "why" behind each investment. Subscribe to the free weekly newsletter to see how a portfolio grows with transparency and deep-dive analysis. Join Investogy today.

  • What Is Compound Annual Growth Rate Explained

    What Is Compound Annual Growth Rate Explained

    If you've spent any time at all looking at investment returns, you've probably come across the term Compound Annual Growth Rate, or CAGR. On the surface, it sounds like more financial jargon, but it’s actually one of the most honest ways to look at how an investment has performed over time.

    Think of it as the average annual growth rate, but with a crucial twist: it assumes you reinvested all your profits each year. This gives you a "smoothed out" number that tells you the steady, consistent rate your money would have needed to grow each year to get from its starting point to its final value.

    What Compound Annual Growth Rate Really Means

    Image

    Let's use an analogy. Imagine you planted a small sapling. Over five years, it grew into a respectable tree. But its growth wasn't a perfect, straight line. Some years, with plenty of rain, it shot up. Other years, during a dry spell, it barely grew at all.

    If you wanted to describe its overall progress, just averaging the fast and slow years wouldn't tell the whole story. What you'd really want is a single, steady growth rate that explains how it got from a tiny sapling to its current height.

    That steady rate is exactly what CAGR does for your investments.

    Smoothing Out The Bumps

    The market rarely moves in a straight line. We all know it has incredible highs and gut-wrenching lows. A simple average of your yearly returns can be wildly misleading because it completely ignores the effect of compounding and the real-world impact of all that volatility.

    CAGR cuts right through that noise. It gives you a much more realistic picture by answering one simple question:

    What constant, year-over-year return would I have needed to turn my initial investment into its final value over this specific period?

    This makes it an incredibly powerful tool for comparing different investments on a level playing field. For example, a hot tech stock might have a wild ride—up 40% one year, down 10% the next. Meanwhile, a boring utility fund might just chug along at a steady 7% every year. CAGR lets you compare their true long-term performance, apples-to-apples.

    To really get a handle on your financial picture, it helps to pair CAGR with a solid understanding of calculating overall portfolio returns accurately, which takes other factors into account. But by mastering this one metric, you're already moving beyond surface-level numbers and gaining a clearer view of how your money is actually working for you.

    How To Calculate CAGR Step By Step

    Ready to roll up your sleeves and crunch the numbers? At first glance, the Compound Annual Growth Rate formula might look a little intimidating, but it’s actually pretty simple once you see what’s under the hood. Its whole purpose is to give you that single, smoothed-out growth rate we’ve been talking about.

    Here’s the core formula you’ll need:

    CAGR = (Ending Value / Beginning Value)^(1 / Number of Years) – 1

    Let's quickly break down each piece so it’s crystal clear.

    • Ending Value (EV): This is simply what your investment is worth at the end of the period you're measuring.
    • Beginning Value (BV): This is what your investment was worth when you started.
    • Number of Years (N): This is just the total time, in years, that you’re looking at.

    This handy visual shows how those three inputs come together to give you the final CAGR number.

    Image

    As you can see, you only need three key pieces of information. That’s it. With just those, you can figure out the smoothed annual growth for pretty much any investment over any time frame.

    A Practical Calculation Example

    Let's walk through a real-world scenario. Imagine you put $10,000 into a stock a few years back. You check your portfolio today, and that investment has grown to $15,000 over three years.

    So, what was your compound annual growth rate for that period?

    1. Identify Your Variables:

      • Beginning Value (BV) = $10,000
      • Ending Value (EV) = $15,000
      • Number of Years (N) = 3
    2. Plug the Numbers into the Formula:

      • CAGR = ($15,000 / $10,000)^(1 / 3) – 1
    3. Solve the Equation Step by Step:

      • First, divide the Ending Value by the Beginning Value: $15,000 / $10,000 = 1.5
      • Next, figure out the exponent: 1 / 3 = 0.3333…
      • Now, raise the result from the first step to the power of that exponent: 1.5 ^ 0.3333 = 1.1447
      • Finally, subtract 1: 1.1447 – 1 = 0.1447
    4. Convert to a Percentage:

      • Just multiply that final number by 100: 0.1447 * 100 = 14.47%

    Boom. Your investment had a Compound Annual Growth Rate of 14.47%. In simple terms, to get from $10,000 to $15,000 in three years, it behaved as if it grew by a steady 14.47% every single year. If you want to dig deeper into measuring performance, check out our guide on how to calculate stock returns.

    Using Tools For Faster Calculations

    Doing the math by hand is a great way to really get the concept, but let's be honest—for regular analysis, spreadsheets are your best friend.

    In both Microsoft Excel and Google Sheets, you can use the RRI function to calculate CAGR instantly. It's literally built for this, designed to return the equivalent interest rate for an investment's growth.

    And this metric isn't just for our stock portfolios; it's a fundamental tool for tracking economic health on a global scale. The same CAGR principle is used to measure and compare the growth of everything from a company's revenue to a country's entire economy. When you hear that India's GDP grew at 7.8%, China's at 5.2%, and the United States' at 2%, it's all based on this same concept of annualized growth.

    To get an even better handle on similar metrics, it's worth understanding how to calculate APY. It offers a related perspective on compounded returns, especially when you're looking at savings or other interest-bearing accounts.

    Why CAGR Is a Critical Tool for Investors

    Image

    Knowing how to punch the numbers for Compound Annual Growth Rate is one thing. But understanding why it’s such a game-changer is what separates a casual market-watcher from a savvy, strategic investor.

    CAGR isn't just another term to memorize. Think of it as a special lens that brings the often-blurry world of market performance into sharp focus.

    Its main job? To act as a great equalizer. It gives you a clean, apples-to-apples way to compare totally different investments, no matter how wild their individual journeys have been. This is absolutely essential for anyone serious about building a solid portfolio.

    Comparing Investment Performance

    Let's say you're sizing up two different investments from the past five years.

    • Investment A (Tech Stock): This one was a roller coaster. We're talking returns of +50%, -20%, +30%, -10%, and +25%.
    • Investment B (Utility Fund): A much calmer ride, with steady returns of +8%, +9%, +7%, +10%, and +8%.

    If you just looked at the simple average, the tech stock would seem like a rockstar. But that average completely hides the gut-wrenching volatility that came with it. CAGR cuts right through that noise. It boils everything down to a single, smooth growth rate for each investment.

    Suddenly, you can see which one actually delivered better, more consistent growth over the whole five-year stretch. It helps you judge the final result, not just the chaotic ride to get there. This kind of clear-headed analysis is the bedrock of good long-term investing strategies, where slow and steady often smokes the flashy, short-term bets.

    Cutting Through Market Volatility

    Let's be real: the market almost never moves in a straight line. Daily headlines and price swings create a constant racket that can easily trick you into making emotional, knee-jerk decisions.

    CAGR helps you zoom out and see the bigger picture. By smoothing out the peaks and valleys, it reveals the underlying growth trend of an asset.

    This perspective is crucial for keeping your cool and sticking with your strategy. Instead of freaking out over one bad year, you can use CAGR to see if the long-term growth story is still on track.

    For example, the pet health industry saw its CAGR jump to a whopping 10.9% between 2018 and 2022. That’s a huge leap from its old 5-7% rate, signaling a powerful underlying trend that would be easy to miss if you only focused on single-year bumps.

    Setting Realistic Financial Goals

    Finally, CAGR is a must-have tool for planning your future. No, it's not a crystal ball—it's based on past performance, not a guarantee of future returns. But it does give you a realistic baseline for what an asset or even the entire market might do over the long haul.

    If you're mapping out your retirement, for instance, you can use the historical CAGR of a broad market index to project how your portfolio might grow. This turns abstract goals into concrete numbers. It helps you set achievable savings targets and build a financial plan that's grounded in reality, not just wishful thinking. You're empowered to make smarter choices for your financial future.

    Seeing CAGR in the Real World

    Look, the Compound Annual Growth Rate is way more than just some stuffy formula for Wall Street analysts. It’s a super versatile metric that gets used all over the place, in countless industries, to get a standardized look at growth.

    Think of it as a universal translator for momentum. Whether you’re sizing up a hot new startup, a massive global industry, or even the economy of an entire country, CAGR gives you a straightforward way to see what's really going on. Its real power is in taking messy, fluctuating data and boiling it down to one single, easy-to-digest number.

    That number helps business leaders, economists, and everyday investors like us make smart comparisons and feel confident in our decisions. From the boardroom to the Beltway, CAGR is the lens people use to see performance clearly.

    Tracking Business Performance and User Growth

    For any company trying to grow, keeping score is everything. Let's say a tech startup launches a new mobile app. They could use CAGR to measure how quickly their active user base grew over five years.

    • Year 1: 50,000 users
    • Year 5: 500,000 users

    Plugging those numbers into the formula would spit out the steady, year-over-year growth rate it took to hit that tenfold increase. That one number helps the leadership team understand the true speed of adoption, set realistic goals for the future, and—crucially—show off their success to investors in a way that’s impossible to misunderstand. It answers the simple question: "Okay, but how fast are we really growing?"

    And it's not just about users. Companies use the exact same logic for crucial metrics like revenue, profit, and market share. A 15% CAGR in revenue is a flashing sign of a healthy, expanding business.

    Comparing Industries and Economic Trends

    Zooming out from a single company, CAGR becomes an indispensable tool for looking at entire sectors of the economy. An analyst might use it to compare the growth of the renewable energy sector against the old-school fossil fuel industry over the last ten years.

    Even if both industries had their share of ups and downs, their CAGRs would smooth out the volatility. You'd be left with a clear picture of their long-term growth paths, showing which one is truly expanding faster. This is where knowing what compound annual growth rate is becomes a secret weapon for spotting major economic shifts before everyone else does.

    Historically, analysts have leaned on CAGR to track sector-specific growth. For instance, the total stock market's compounded annual growth rate averaged about 9.08%. But if you dig deeper, you see fascinating stories. Niche sectors like water utilities blew that away with a 14.78% CAGR, while traditional industries like publishing limped along at just 0.41%. That's not just a number; that's massive disruption in action.

    These figures do more than just report the past; they signal huge shifts in technology, consumer habits, and where the smart money is heading next. You can dig into more detailed historical growth data and see these trends for yourself.

    Evaluating Global and National Economies

    On the biggest scale imaginable, economists use CAGR to get a handle on a country's Gross Domestic Product (GDP). Calculating the GDP's CAGR over a decade or two irons out the wrinkles from short-term recessions and boom cycles. What you're left with is a much clearer picture of a nation's long-term economic health and stability.

    For instance, comparing the 20-year GDP CAGR of an emerging market with that of a developed nation can instantly show you the difference in economic firepower and growth potential.

    So whether you’re sizing up a startup's user numbers, a major shift in industry dominance, or the economic pulse of an entire nation, CAGR is the tool that tells the real story behind the numbers.

    Understanding the Limitations of CAGR

    Image

    While CAGR is an incredibly powerful metric for investors, it’s absolutely essential to understand that it doesn't tell the whole story. Not even close.

    Think of it like looking at a gorgeous photograph of a mountain range from a distance. The picture shows you the impressive scale and the final destination, but it completely hides the treacherous valleys and jagged peaks you’d have to cross to actually get there.

    The greatest strength of CAGR—its ability to smooth out performance into a clean, easy-to-understand number—is also its biggest weakness. It presents a hypothetical, steady growth line from point A to point B, masking the real-world drama an investment might have gone through along the way.

    It Ignores Volatility and Risk

    An investment that delivers a 10% CAGR could have been a calm, steady climb or a stomach-churning roller coaster with huge swings up and down. To CAGR, those two very different journeys look exactly the same.

    For example, two mutual funds could both post a 12% CAGR over five years.

    • Fund A might have had annual returns of: +11%, +13%, +12%, +11%, and +13%.
    • Fund B might have had returns of: +40%, -15%, +30%, -10%, and +15%.

    The final number is identical, but the investor experience—and the inherent risk—is wildly different. One was a pleasant ride, the other was a white-knuckle affair.

    CAGR tells you where you ended up, but it tells you nothing about the turbulence you faced during the flight. This is why you must pair it with other metrics to get a true sense of an asset's risk profile.

    It Is a Backward-Looking Metric

    This one is critical to remember: CAGR is strictly a historical measure. It tells you how an investment has performed, but it offers absolutely no guarantee of future results. Past performance is not an indicator of future returns, as they say.

    A company with a stellar 20% revenue CAGR for the last five years is impressive, but they might be facing new competition or a shifting market that dramatically changes their trajectory tomorrow.

    Relying solely on a great CAGR to predict what's next is like trying to drive forward while only looking in the rearview mirror. It’s useful for context, but it's a dangerous way to navigate the road ahead.

    CAGR Doesn't Account for Cash Flows

    The standard CAGR formula has another major blind spot: it only cares about the beginning and ending values of an investment. It completely ignores any money you might have added or taken out during the holding period.

    • If you added more money to your investment halfway through, the final CAGR will look artificially high, inflated by your new cash rather than just the underlying performance.
    • If you withdrew money, the final CAGR could look much lower than the investment actually performed.

    Because of these limitations, savvy investors never, ever use CAGR in isolation. It’s a fantastic starting point for analysis and a great way to compare different investments on an apples-to-apples basis. But for a complete and honest assessment, you have to dig deeper. You need to combine it with other key metrics like standard deviation (to measure that roller-coaster volatility) and a real analysis of your actual cash flows.

    Using CAGR for Business and Strategic Planning

    CAGR is more than just a report card for your personal investments. In the business world, it's a genuine powerhouse for mapping out the future. Smart leaders don't just use it to see where they've been; they use it to decide where they're going, turning old data into a strategic roadmap for growth.

    Companies are constantly looking at their own historical CAGR to get a realistic handle on future revenue. It helps them set sales targets that are ambitious but still grounded in reality, and it's the kind of hard data you need to justify spending big on a new project or expansion.

    Think about a software company that's seen 15% revenue CAGR for the past three years. They can use that number to project where they'll be in another three, which helps them decide when it’s the right time to hire more developers or push into a new market. It takes the guesswork out of some of their biggest decisions.

    Forecasting Market Opportunities

    This is where CAGR really starts to shine—when you apply it to an entire industry. By getting a read on an industry's overall growth rate, a company can figure out just how big the opportunity is and where to point its most valuable resources: time, money, and people.

    A business can use its industry's CAGR to:

    • Set Realistic Sales Targets: If the whole market is growing at 5%, aiming for 50% growth yourself might be a bit of a stretch. Aligning your goals with the market keeps you grounded.
    • Assess Market Attractiveness: Seeing a high CAGR in a niche market is often a flashing green light, signaling a prime opportunity to jump in or double down on your investment.
    • Manage Risk: On the flip side, a declining industry CAGR can be a wake-up call. It might be time to diversify your offerings or pivot your strategy before you get left behind.

    This forward-looking approach transforms CAGR from a simple calculation into a vital strategic tool. It’s an essential piece of the puzzle for any leader trying to build a resilient, forward-thinking company—much like a solid framework is needed when you build a diversified stock portfolio.

    The global business environment relies heavily on CAGR for market forecasting. The worldwide business market, which generated US$2.71 billion in 2022, is projected to grow at a CAGR of 8.93% through 2029.

    Projections like this, which bake in everything from GDP growth to shifting consumer habits, give individual businesses a clear benchmark to measure their own ambitions against. You can dig into more of this data on global market forecasts from Statista. By using CAGR this way, leaders can spot opportunities, get ahead of challenges, and drive real, sustainable growth in a world that never stops moving.

    Answering Your Top CAGR Questions

    Even once you get the hang of the Compound Annual Growth Rate, a few questions always seem to surface. Let's run through the most common ones so you can feel completely confident using this metric.

    What's The Real Difference Between CAGR and ROI?

    I like to think of it this way: CAGR tells you the speed of your investment's growth, while ROI measures the total distance it traveled.

    • CAGR is your smoothed-out, year-over-year growth rate. It’s the perfect tool for putting two different investments side-by-side to see which one performed more consistently over the same multi-year stretch.
    • ROI (Return on Investment) just gives you the total percentage gain or loss over your entire holding period, whether that was two years or twenty. It’s a simple, big-picture number.

    For instance, seeing a 100% ROI over five years is great news. But knowing the CAGR was 14.87% tells you the steady annual pace it took to get you there, which is often a more useful piece of information.

    Can CAGR Go Negative?

    It absolutely can. A negative CAGR isn't some weird math error; it’s a straightforward sign that your investment lost value over the period you're measuring.

    It simply shows you the consistent annual loss that would have been required for your investment to shrink from its starting value to its lower ending value. Nobody likes to see a negative number, but it’s an honest, unfiltered look at an asset that has performed poorly over time.

    Why Not Just Use a Simple Average? It Seems Easier.

    Using a simple average growth rate is one of the most common rookie mistakes, and it can be incredibly misleading. Why? Because it completely ignores the effects of compounding. A simple average just adds up each year's individual return and divides by the number of years.

    CAGR, on the other hand, gives you the geometric mean. This is a much smarter way to look at returns because it accounts for how the value of your investment changes each year. Gains and losses in one year directly impact the starting base for the next, and CAGR is the only metric that properly captures that dynamic, giving you a far more accurate picture of an investment's true performance.


    Ready to move beyond the numbers and see how these principles apply to a real-world portfolio? The Investogy newsletter offers a transparent look at how we manage our own money, sharing the research and strategy behind every move. Subscribe for free at Investogy.com to start building your investing conviction.

  • How to Calculate Stock Returns A Practical Guide

    How to Calculate Stock Returns A Practical Guide

    Figuring out your stock returns involves measuring the percentage change from what you put in to what you got out, often factoring in dividends.The simplest way to do this is with the simple return formula, which just compares the end price to the start price. But for a real understanding of how your investments are doing over time, you'll want to dig a bit deeper.

    Measuring Your Investment Performance

    Image

    Before you start crunching numbers, it's important to know what you're actually trying to measure. At its core, a "return" is just the profit or loss you've made on an investment, usually shown as a percentage. Sounds simple, right?

    But that simple idea gets complicated fast once you bring in variables like time, dividends, and market volatility.

    Picking the right formula is key because each one tells a different story. A quick gain over a few weeks might feel great, but how does that compare to an investment you've held for five years? This is where different metrics come in, helping you see beyond the surface-level numbers and truly understand your performance.

    The Key Metrics Every Investor Needs

    To get a complete picture, you need to get familiar with three main ways to calculate returns. Each one has a specific job, whether you're looking at a short-term trade or a long-term position in your portfolio.

    For a deeper dive into evaluating all your holdings together, our guide on how to perform a stock portfolio analysis is a great next step.

    Here are the core metrics we'll be breaking down:

    • Simple Return: This is your basic calculation, showing the total gain or loss over the entire time you held the stock. It's perfect for a quick snapshot of a single investment's journey from start to finish.
    • Annualized Return: This metric takes your simple return and converts it into an annual figure. It's the only way to make fair, apples-to-apples comparisons between investments held for different lengths of time.
    • Total Return: This is the big one. It doesn't just look at the stock's price going up; it also includes any dividends or other distributions you received. If you ignore dividends, you're missing a huge piece of the puzzle.

    A day trader might live and die by simple returns, but a long-term value investor absolutely needs to focus on total and annualized returns to see if their strategy is actually working. They tell a much more complete story.

    Accurate measurement is the foundation of good investing. For any of this to be useful, you have to follow established financial reporting best practices to keep your data clean and consistent.

    This isn't just about being neat; it prevents you from drawing the wrong conclusions and helps you make smarter decisions with your money. In the next few sections, we'll get into the weeds with the specific formulas and walk through some real examples for each of these crucial calculations.

    To make things even clearer, here’s a quick rundown of the key metrics we're about to cover.

    Key Stock Return Metrics at a Glance

    Return Type Best For Key Formula Component
    Simple Return Quick, single-investment performance snapshot over any period. (Final Price - Initial Price) / Initial Price
    Annualized Return Comparing investments held for different timeframes (e.g., 6 months vs. 3 years). (1 + Simple Return) ^ (1 / Number of Years) - 1
    Total Return Getting the complete picture, including price changes and all distributions. (Final Price - Initial Price + Dividends) / Initial Price

    This table should serve as a handy reference as we move forward. Now, let's break down how to calculate each one, step by step.

    Calculating Simple and Total Returns

    Image

    Before you can know how well your portfolio is doing, you have to get comfortable with the basic math. The first stop for any investor is the simple return. It's the quickest, most straightforward way to see how much a stock's price has moved since you clicked "buy."

    Think of it as the back-of-the-napkin calculation for a high-level view of your gain or loss.

    The formula is as basic as it gets, boiling everything down to your entry price and the current (or exit) price.

    Simple Return Formula: (Current Price - Purchase Price) / Purchase Price

    Let’s put it into practice. Imagine you bought 10 shares of a well-known tech company at $150 per share. Your total initial investment was $1,500. A year goes by, and the stock is now trading at $180 per share.

    Plugging those numbers into the formula, you get: ($180 - $150) / $150 = 0.20.

    To turn that into a percentage, just multiply by 100. Your simple return on the stock is 20%. In other words, the stock's price has gone up by a fifth of what you originally paid for it. Simple enough.

    Why Simple Return Is Only Half the Story

    But here’s the catch: simple return has a massive blind spot. It completely ignores dividends. Many solid, established companies share their profits with you in the form of regular dividend payments. If you're not counting that cash, you're getting an incomplete—and often understated—picture of your investment's performance.

    This is exactly why we need to talk about Total Return. It gives you the full story by combining both the capital gain (the price increase) and any dividend income you collected while you held the stock.

    Factoring in Dividends for Total Return

    The Total Return formula is just a small but crucial tweak on the one we just used.

    Total Return Formula: (Current Price - Purchase Price + Dividends) / Purchase Price

    Let's go back to our tech stock example. The price jumped from $150 to $180. But let's also say the company paid out an annual dividend of $3 per share. Since you own 10 shares, that's a cool $30 in your pocket.

    Now, let's recalculate with this new information:

    • Capital Gain: $180 - $150 = $30 per share.
    • Total Gain: $30 (Capital Gain) + $3 (Dividend) = $33 per share.
    • Total Return Calculation: ($33 / $150) = 0.22.

    Your total return is actually 22%. That extra 2% came entirely from dividends. It might not sound like a huge deal, but over the long haul, the compounding effect of reinvested dividends is a powerhouse, often accounting for a huge chunk of the market's total gains.

    Focusing only on price movement is a rookie mistake. You might ditch a stock with a 5% simple return, not realizing its 4% dividend yield made it a better performer than another stock with a 7% gain but no dividend. Total return gives you the clarity you need to make smarter decisions.

    These fundamental principles aren't just for stocks. They apply to almost any investment you can make. For instance, you can calculate the ROI on rental property using a simple formula using very similar logic. Getting these core concepts down is essential whether you're looking at stocks, real estate, or anything in between.

    This idea is also a key piece of a much broader financial metric. We break it all down in our complete guide on how to calculate return on investment.

    How to Calculate Annualized Returns

    Let's say you made a 20% gain on a stock you held for just six months. That sounds great. But how does it stack up against another investment you've held for three years?

    It’s like comparing apples to oranges. A killer return over a short period might not look so hot when stretched out over a year, and vice-versa. This is exactly why we need to calculate annualized returns.

    This metric is the great equalizer. It converts your investment performance into a standard one-year timeframe, giving you the only way to make a fair, direct comparison between different assets held for different amounts of time.

    The Annualized Return Formula

    To get started, you just need two things: the simple return (which we covered in the last section) and how long you held the investment, measured in years.

    The formula can look a little intense at first glance, but it's pretty straightforward once you see what it's doing.

    Annualized Return = [(1 + Simple Return) ^ (1 / Number of Years)] – 1

    That ^ symbol just means "to the power of." This part of the formula is the secret sauce—it properly accounts for the effect of compounding over time. It's far more accurate than just crudely dividing the total return by the number of years you held the stock.

    Before you can annualize a return, you need the basic components of the return itself. This is all about understanding the moving parts.

    Image

    As you can see, a return really starts with the capital gain, gets a boost from any dividends paid out, and then measures that total profit against what you initially paid.

    A Practical Example

    Let’s walk through a real-world scenario. Imagine you bought shares in a company for $10,000. After 18 months (which is 1.5 years), you decide to sell them for $12,500.

    First up, calculate the simple return: ($12,500 - $10,000) / $10,000 = 0.25, or a clean 25%.

    Now, let's plug that into our annualization formula:

    • Annualized Return = [(1 + 0.25) ^ (1 / 1.5)] – 1
    • Annualized Return = [(1.25) ^ (0.6667)] – 1
    • Annualized Return = [1.1605] – 1
    • Annualized Return = 0.1605

    Your annualized return comes out to 16.05%. This tells you that your 25% gain over 18 months is the same as earning 16.05% every single year. Now you have a number you can actually use to compare against other investments, like the S&P 500's average return or another stock you sold last year.

    It's a common mistake to simply divide the total return by the number of years (e.g., 25% / 1.5 years = 16.67%). This is wrong because it completely ignores compounding and will always give you an inflated, inaccurate result.

    Stock return calculations can be simple, like the absolute 50% gain you'd see if a stock went from $100 to $150. But it’s the annualized figure—like the 14.47% return that same stock would have over three years—that gives you a much clearer picture of its actual performance. If you want to dive deeper into analyzing historical stock data, the folks at pyquantnews.com have some great insights.

    Mastering the Compound Annual Growth Rate (CAGR)

    Image

    While annualized returns are great for a quick comparison between different investments, the Compound Annual Growth Rate (CAGR) is the gold standard for understanding a single investment’s journey over several years. It cuts right to the chase and answers the most important question: "If my investment grew at a perfectly steady rate each year, what would that rate have to be to get from my starting point to my ending value?"

    This is an incredibly useful metric because, let's be honest, real-world returns are never that smooth. Markets are volatile. You'll see big gains one year and painful losses the next. CAGR slices through all that noise to give you a single, representative number that reflects the true, compounded performance of your stock over time.

    Why CAGR Beats a Simple Average Every Time

    It's so tempting to just add up a few years of returns and divide by the number of years. Quick and easy, right? But this approach is deeply flawed and can be seriously misleading. Taking a simple average of yearly gains ignores the crucial effect of compounding.

    A simple average treats each year's return as if it's based on your original investment. But in the real world, your gains (or losses) from year one become the starting capital for year two. This is the power of compounding in action, and it's precisely what CAGR is built to capture.

    CAGR is a geometric mean, not a simple arithmetic mean. This is the key difference. It understands that a 50% loss requires a 100% gain just to break even—a brutal reality that a simple average completely glosses over.

    The CAGR Formula

    To calculate CAGR, you only need three data points: your investment's beginning value, its ending value, and the number of years you held it.

    CAGR = [(Ending Value / Beginning Value) ^ (1 / Number of Years)] – 1

    If this formula looks familiar, it’s because it’s nearly identical to the one for annualized returns. The main difference is in its application. You can annualize returns for periods shorter than a year, but CAGR is specifically designed for investment horizons that span multiple years.

    A Practical CAGR Calculation

    Let's walk through a real-world scenario. Imagine you invested $10,000 into a tech stock five years ago. It’s been a bumpy ride:

    • Year 1: Grows to $13,000 (a 30% gain)
    • Year 2: Dips to $11,700 (a -10% loss)
    • Year 3: Bounces back to $14,625 (a 25% gain)
    • Year 4: Ticks up to $15,356 (a 5% gain)
    • Year 5: Finishes at $17,659 (a 15% gain)

    If you calculate a simple average of these annual returns (30% – 10% + 25% + 5% + 15%) / 5, you get 13%. But does that reflect your actual experience? Let's plug the numbers into the CAGR formula to find out.

    • CAGR = [($17,659 / $10,000) ^ (1 / 5)] – 1
    • CAGR = [(1.7659) ^ (0.2)] – 1
    • CAGR = [1.1205] – 1
    • CAGR = 0.1205

    The true Compound Annual Growth Rate is 12.05%. This is the consistent, smoothed-out annual return that would have actually grown your initial $10,000 to its final value of $17,659 over those five volatile years. As you can see, it's a much more honest reflection of your investment's performance than the overly optimistic simple average of 13%.

    Getting a firm grip on growth rates like this is also a cornerstone when you master stock valuation methods.

    Understanding What Really Drives Your Stock Returns

    Knowing how to calculate your stock returns is one thing. Understanding why they happen is where the real money is made. Once you move past the basic formulas, you start to see that your final profit is really shaped by just three core drivers: a company’s earnings, its dividend policy, and what the market thinks it’s worth.

    A stock's price doesn't just move on a whim. It's fundamentally tied to the company's ability to grow its profits and, just as importantly, the price other investors are willing to pay for a piece of those profits. These two forces are constantly at play, working together to create your returns over time.

    The Three Engines of Stock Returns

    It helps to think of your total return as a machine with three distinct engines. Each one plays a critical role, and learning to spot them helps you truly analyze performance instead of just measuring it.

    • Earnings Per Share (EPS) Growth: This is the bedrock. When a company consistently makes more money, its underlying value grows. Sooner or later, that growth should show up in its stock price. It's the most fundamental driver of them all.

    • Dividend Yield: This is the cash that lands in your pocket just for holding the stock, completely separate from any price change. It provides a steady, predictable income stream and is a huge, often underestimated, contributor to long-term total returns.

    • Change in Valuation Multiples: Now, this is the wildcard. It’s all about market sentiment, which we often measure with the price-to-earnings (P/E) ratio. Even if a company's earnings are completely flat, you could see a massive return if investors suddenly decide to pay a much higher multiple for those exact same earnings. The reverse is also painfully true.

    If you really want to get under the hood of what drives stock returns, learning how to calculate intrinsic value is a game-changer. It helps you separate a company's actual performance from the market's often-fickle mood swings.

    A Simple Model for Predicting Returns

    This framework isn't just theory; it’s incredibly practical. Vanguard founder Jack Bogle famously cooked up a simple model for predicting future stock returns based on these exact three factors: the initial dividend yield, the earnings growth that follows, and any change in the P/E ratio.

    His model does an surprisingly good job of explaining what’s happened in the market historically.

    Take the S&P 500 from 2000 to 2009. The nominal annualized return was a dismal -0.95%. This infamous "lost decade" wasn't because great American companies stopped making money. It happened because the sky-high P/E ratios from the dot-com bubble collapsed, wiping out a decade's worth of gains from both dividends and steady earnings growth.

    Ultimately, seeing a negative return doesn't always mean you picked a bad company. It could just mean you bought a great company at too high a price, right before market sentiment turned sour. By breaking down your returns into these three parts, you get a much clearer, more honest picture of what really drove your performance—for better or for worse.

    Common Questions About Stock Returns

    Once you start running these formulas, you’ll inevitably bump into some real-world situations that aren't so black and white. Let's walk through some of the most common questions that pop up when investors begin to really dig into their performance numbers.

    Getting these details right is the difference between a fuzzy guess and a sharp, accurate picture of your portfolio's health.

    Annualized Return vs. CAGR

    One of the first hurdles for many investors is wrapping their heads around the difference between annualized returns and the Compound Annual Growth Rate (CAGR). They sound similar, and their formulas even look a bit alike, but they're different tools for different jobs.

    Here’s how I think about it:

    • Annualized Return is for comparison. Its main purpose is to put different investments on an even playing field by showing what their return would be over a one-year period. This is perfect when you want to compare a stock you held for nine months against one you owned for three years.
    • CAGR is for smoothing out the ride. It’s specifically designed to measure an investment's growth over several years, ironing out the volatile ups and downs to give you a single, hypothetical steady growth rate. It’s the go-to metric for evaluating a long-term position.

    Think of it this way: Use annualized returns to compare different investments side-by-side. Use CAGR to judge the long-term journey of a single investment. They answer completely different questions.

    How to Handle Adding More Shares

    What happens when you don't just buy a stock and hold it? We rarely do. We often buy more shares over time, maybe to average down or build up a position. A simple return calculation just won't work anymore because your cost basis—what you paid for your shares—is now a moving target.

    This is where you graduate to more advanced, cash-flow-adjusted methods like the money-weighted rate of return (MWRR) or the time-weighted rate of return (TWRR). Most brokerage platforms these days will calculate one of these for you, but it’s crucial to know what’s going on under the hood.

    The MWRR is your personal return, and it's heavily influenced by when you decided to add more money. If you got lucky and bought a big chunk right before a surge, your MWRR will look great. The TWRR, on the other hand, strips out the impact of your timing. It measures the investment's raw performance, which is why it's the industry standard for comparing fund managers.

    Should I Include Taxes and Fees?

    For the most brutally honest look at how you're actually doing, you absolutely have to factor in taxes and fees. The formulas we've been talking about calculate your gross return—the performance of the investment itself, living in a perfect, fee-free vacuum.

    But what really hits your bank account is the net return. This is the number that matters. It’s the cash you can actually spend after you subtract all the trading commissions, management fees, and, of course, capital gains taxes.

    While gross return is fine for a quick comparison of one stock versus another, your net return tells the true story of whether your wealth is actually growing. It's the ultimate scoreboard.


    Ready to build conviction in your investments? The Investogy newsletter offers deep-dive analysis on a real-money portfolio, showing you the "why" behind every decision. Subscribe for free at Investogy.com.

  • Your Guide to the Investment Thesis Template

    Your Guide to the Investment Thesis Template

    An investment thesis is just a fancy way of saying you’ve written down a clear, compelling argument for why a particular investment is a smart move. Think of an investment thesis template as the tool that helps you organize all that messy research into a coherent story, turning a gut feeling into a decision backed by logic and evidence.

    Why an Investment Thesis Is Your Secret Weapon

    Image

    Before we jump into the templates, you need to grasp why this document is a complete game-changer for any serious investor. An investment thesis is so much more than some stuffy academic exercise; it's your anchor in the middle of a volatile market. It’s what separates the disciplined, strategic investors from the reactive ones who get tossed around by every scary headline and market dip.

    Honestly, this practice is one of the most powerful filters against making emotional, hair-trigger decisions. When the market is in full-blown panic mode and your favorite stock is plummeting, your thesis becomes the voice of reason. It’s there to remind you of the solid, fundamental reasons you invested in the first place.

    A Framework for Clarity and Conviction

    Putting together a thesis forces you to go way beyond a surface-level glance. You have to actually dig deep into a company’s business model, get a real feel for the competitive landscape, and scrutinize its financial health. I’ve found this process is the single best way to pressure-test your own assumptions and build genuine conviction in an investment.

    The core benefits are pretty straightforward:

    • Forced Discipline: It makes you articulate exactly why you believe an asset will go up. No more vague hunches or impulsive buys.
    • Emotional Guardrails: When fear and greed inevitably try to take over, the thesis acts as a logical counterpoint, grounding your decisions in the research you already did.
    • Performance Benchmark: It sets clear expectations from the get-go. This allows you to objectively measure whether the investment is actually doing what you thought it would, and if not, why.

    An investment thesis isn't about having a crystal ball to predict the future. It’s about building a robust, logical framework that can withstand market noise and guide your actions with clarity.

    The Historical Roots of Strategic Investing

    This disciplined approach is nothing new. The idea of forming a core investment argument has deep historical roots, tracing all the way back to the rise of organized securities trading in the United States. As the economy boomed in the 19th century and more companies started issuing stock, investors needed a systematic way to evaluate all these new opportunities. This need gave birth to the foundational concepts behind the modern investment thesis. If you're a history buff, it's worth exploring the evolution of these investment frameworks to see how past trends shaped today's strategies.

    Ultimately, using an investment thesis template gives you the structure needed to put this time-tested strategy into practice. It's the tool that helps turn your abstract ideas into a concrete plan for building wealth.

    Building Your Investment Thesis Template From Scratch

    A strong investment thesis isn't some vague idea you have about a company. It's a structured, logical argument you build, piece by piece, to prove to yourself why an investment makes sense. Think of your investment thesis template as the blueprint for putting that argument together.

    The very first thing you need to nail down is the company's story. I'm talking about getting to the core of how it actually makes money, who its customers are, and the real value it delivers. This goes way beyond just repeating what's on their "About Us" page; it's about demonstrating a genuine, deep understanding of the business operations.

    From there, you have to pinpoint the company's competitive advantage—what the pros call its "moat." This is the special sauce that protects it from the competition. A real moat isn't just a popular product; it's a structural advantage, something that's incredibly difficult for rivals to copy, that helps lock in profits for the long haul.

    This infographic breaks down the key stages of market analysis, which is a critical piece of the puzzle.

    Image

    Looking at it this way, you can see how understanding the bigger picture—the market itself—is essential before you get lost in the weeds of a single company.

    Analyzing Management And Financials

    I've learned this the hard way: great companies are led by great people. Period. Your thesis has to include a serious look at the management team. You're looking for leaders with a clear vision, a history of making smart decisions with company money, and whose interests align with yours as a shareholder. I always ask myself: do I trust this team to steer the ship through rough waters over the next decade?

    Once you've sized up the people, it's time to hit the books. The financial health of a company is completely non-negotiable. A strong thesis is always, without exception, supported by a solid analysis of the numbers, focusing on the metrics that actually drive the business forward.

    Here’s a quick list of what to zero in on:

    • Profitability Trends: Are profit margins getting wider or thinner? Consistent profitability is a huge sign of a healthy business that can command its prices.
    • Balance Sheet Strength: How much debt is on the books? A lean balance sheet gives a company breathing room and lowers risk when the economy gets rocky.
    • Cash Flow Generation: Is the company a cash machine? Consistent free cash flow is the lifeblood of a business, allowing it to grow without having to constantly borrow money or sell more shares.

    A classic rookie mistake is drowning in dozens of financial metrics. Focus on the handful that directly support your core argument about the company’s long-term potential.

    Determining Valuation And Risks

    Finally, even the best company on earth can be a disastrous investment if you pay too much for it. Your thesis absolutely needs a dedicated section on valuation. This is where you figure out what you believe the business is truly worth and stack that up against its current stock price. The whole point is to buy with a significant margin of safety.

    Just as critical is a brutally honest look at the risks. No investment is a sure thing. You have to systematically identify and spell out the biggest threats—whether it's new competitors, regulatory headaches, or a technology that could make them obsolete. This step forces you to argue against yourself and stress-test your own bullish case.

    For anyone just starting out, getting these fundamental pieces right is the most important step. Our guide on how to start investing for beginners can fill in more of the background. When you thoughtfully address each of these components, your investment thesis template stops being a simple checklist and becomes a powerful tool for making smarter, more disciplined decisions.

    To help you get started, here's a breakdown of the key sections your template should cover.

    Key Components for Your Investment Thesis Template

    This table summarizes the essential parts of a robust investment thesis, outlining the core question each section should answer and providing examples of what to focus on.

    Component Core Question to Answer Example Focus Areas
    Business Summary What does this company actually do and how does it make money? Business model, products/services, target customers, revenue streams
    Competitive Advantage (Moat) Why can't a competitor easily crush this business? Network effects, brand strength, patents, switching costs, scale advantages
    Management Assessment Is the leadership team capable and aligned with shareholders? CEO track record, capital allocation history, insider ownership, company vision
    Financial Analysis Is the business financially healthy and resilient? Revenue growth, profitability margins, debt levels, free cash flow generation
    Valuation What is a reasonable price to pay for this business? Discounted Cash Flow (DCF), price-to-earnings (P/E), EV/EBITDA, margin of safety
    Risk Assessment What could go wrong and sink this investment? Competitive threats, regulatory changes, technological disruption, economic cycles

    By using this structure, you ensure all your bases are covered before you put a single dollar to work. It's the kind of discipline that separates successful long-term investors from speculators.

    Connecting Your Story to the Numbers

    Image

    Look, a great story about a company changing the world is exciting stuff. But until you can back that story up with cold, hard numbers, it’s just that—a story. This is the moment your investment thesis graduates from a qualitative hunch to quantitative proof.

    The whole point here is to translate your big ideas—your assumptions about market growth, that killer competitive advantage, or the genius management team—into a tangible financial model. You need to test if the narrative actually holds water financially.

    Your story and your numbers have to be in lockstep. If you’re arguing the company will snatch up 10% of a brand-new market, your revenue forecast better show that growth in a believable way. If you’re claiming their "moat" lets them charge a premium, your margin estimates need to reflect that. It’s not about predicting the future with perfect accuracy; it’s about building a framework to see if your thesis is even plausible.

    To really nail this, you have to get comfortable with creating strong financial projections. This is the step that grounds your brilliant story in reality.

    From Assumptions to Projections

    First things first, you have to turn those core beliefs into specific inputs for your model. It sounds more intimidating than it is. You're just putting a number on the key drivers you already identified.

    Start by asking yourself some basic questions:

    • Revenue Growth: Based on what you know about the market, what’s a realistic year-over-year growth rate for the next five years? A disruptive tech company might be gunning for 30% annually. A mature industrial giant? Maybe closer to 5%.
    • Profit Margins: Does the company's competitive edge actually support fatter margins over time? If so, by how much? Projecting a slow climb from 15% to 18% is a lot more credible than a massive, unexplained leap.
    • Capital Expenditures: How much cash does the company need to plow back into the business just to hit that growth you’re forecasting? This is a crucial reality check on how much cash will actually be left for shareholders like you.

    This isn't just academic. Any serious financial analysis does this. For example, a detailed institutional thesis on a major firm like International Paper Corporation would get super granular, forecasting capital expenditures as 10% to 10.5% of physical assets for years. That’s how the pros validate the big picture.

    A Simplified Approach to Valuation

    Once you have some basic projections down, you can run a simple valuation to see if the stock price today makes any sense. A Discounted Cash Flow (DCF) model is the classic tool for this, but you don't need a Wall Street-level spreadsheet. At its heart, a DCF is just trying to estimate all the cash a company will generate in the future and figure out what that's worth in today's dollars.

    The goal isn't to pinpoint the exact intrinsic value down to the last penny. It's to figure out if there's a big enough gap between a reasonable estimate of its worth and the current stock price. That gap is your margin of safety.

    This entire exercise is the core of fundamental analysis—digging into a company's financial health to determine its true value. If you're new to this, our guide on what is fundamental analysis breaks down how it forms the backbone of any intelligent investment decision.

    Ultimately, connecting the story to the numbers is what turns your investment thesis from a static document into a powerful tool for making smarter decisions.

    Bringing It All Together With A Real-World Example

    Theory is great, but let's be honest, it's putting it into practice that really makes the concepts stick. To make this tangible, we're going to walk through a hypothetical investment thesis for a company we all know: Microsoft. I've found that using a structured investment thesis template is the best way to keep your thoughts organized and build a clear, compelling case.

    First things first, you need to be able to explain the business model in simple terms. For Microsoft, it’s not just about "software." You have to see its two massive engines: the Intelligent Cloud (driven by Azure) and its deep suite of enterprise and consumer software (think Office 365 and Windows). My core thesis here would be that Microsoft is brilliantly shifting from a one-time software seller into a dominant, subscription-based cloud and productivity giant.

    With that down, it’s time to look at its competitive moat. Microsoft’s position is incredibly strong, and it's protected by a few key factors.

    • High Switching Costs: Once a company is running its entire operation on Azure or has its workflow built around the Office 365 ecosystem, ripping it all out to move to a competitor is a nightmare. It’s complex, disruptive, and incredibly expensive.
    • Network Effects: The more people who use platforms like Teams and LinkedIn, the more essential they become. This creates a powerful, self-reinforcing cycle that makes it tough for any rival to gain a foothold.

    This one-two punch creates a durable competitive advantage that shields its impressive profitability from would-be challengers.

    Analyzing Leadership and Valuation

    No thesis is complete without a hard look at the people in charge. Under CEO Satya Nadella, Microsoft has shown a crystal-clear and massively successful strategic vision. The pivot to cloud computing and smart acquisitions like LinkedIn and GitHub prove it. This kind of track record for excellent capital allocation is a huge part of the investment case. You want to back management that not only runs the business day-to-day but also invests intelligently for the future.

    Now, let's talk numbers. A simplified valuation might involve projecting future free cash flow, maybe based on continued 15-20% annual growth in the cloud business and stable, single-digit growth from its other segments. By discounting all that future cash back to today's dollars, you can land on a rough estimate of its intrinsic value. The whole point is to see if the current stock price gives you a decent margin of safety compared to what you think it's really worth. Every thesis is different, and mastering this process is a huge part of learning how to build an investment portfolio with real conviction.

    Identifying the Primary Risks

    Let's be real: no investment is a sure thing. An honest thesis has to face the potential downsides head-on. With Microsoft, I don't see the primary risks as operational. They're external.

    The biggest threats often come not from direct competitors but from regulators. Increased antitrust scrutiny in both the U.S. and Europe could potentially hamstring future acquisitions or hit them with fines, which would absolutely impact long-term growth.

    Another risk is the dogfight in the cloud space. Competition from behemoths like Amazon Web Services and Google Cloud is fierce and could squeeze profit margins over time. Acknowledging these threats keeps your thesis balanced and prevents it from becoming just a list of things you're excited about.

    Once you’ve built a solid thesis like this for one company, you can apply the same disciplined thinking to other parts of your financial plan, like when you're focused on building a resilient investment strategy through diversification. This kind of practical walkthrough gives you a clear blueprint to follow for your own investments.

    How Market Conditions Can Change the Game

    A brilliant company with a fantastic product can still turn into a terrible investment if your timing is off. This is where the bigger picture—the entire macroeconomic environment—comes roaring in. Your investment thesis template absolutely needs a section dedicated to the world outside the company's four walls, because those forces can completely change your expected returns.

    Ignoring these external factors is like sailing a state-of-the-art ship without checking the weather. You might be on the best vessel out there, but a hurricane can sink it just the same.

    Weaving Macro Factors Into Your Thesis

    Thinking about macro conditions isn't about trying to predict the future with a crystal ball. It's about stress-testing your thesis. You need to ask yourself how your investment would hold up if a few game-changing events suddenly hit the headlines.

    Here are a handful of the big ones I always consider:

    • Interest Rate Swings: Rising rates make borrowing more expensive, which can slam the brakes on high-growth tech companies. Many of them rely on debt to fuel their expansion, and higher rates also make their future earnings less valuable in today's dollars. It’s a double whammy.
    • Inflation: Stubborn inflation chews away at a company’s profits by jacking up the cost of everything from raw materials to labor. Your thesis has to answer a key question: does this company have the pricing power to pass those costs to customers without them walking away?
    • Geopolitical Flare-Ups: Conflicts, trade wars, or political chaos can disrupt supply chains overnight or completely shut off access to key markets. For any company with global operations, this is a massive, unpredictable risk.

    The most resilient investment theses don't just hope for a best-case scenario; they acknowledge and plan for potential economic headwinds. You're trying to build a case that can bend without breaking when the market gets choppy.

    Let's look at a real-world example. When analysts assess energy companies, they have to get specific. An investment thesis for Pioneer Natural Resources, for instance, had to bake in the 10-year Treasury bond rate of 4.52% as a stand-in for its long-term debt costs, especially during the high-inflation mess of 2022 and 2023.

    The analysis also had to forecast how inflation would squeeze production expenses, which were already sitting at $7.83 per barrel. This shows a direct line between big-picture macro data and the nitty-gritty of a company's value. You can dig into the numbers yourself in this in-depth analysis of energy sector investments.

    By thoughtfully walking through how your target company might fare under different economic skies—recession, high growth, stagflation—you build a much tougher and more realistic investment case. This step is what separates a basic company summary from a truly strategic investment thesis.

    A Few Common Questions About Investment Theses

    Even with a killer framework, a few questions always seem to bubble up. That’s a good sign—it means you’re really digging in and thinking critically about the whole process. Let’s tackle some of the most common things that come up when investors start getting serious about writing these down.

    How Long Should an Investment Thesis Be?

    Honestly, there’s no magic number here. But if you're looking for a ballpark, aim for somewhere between 1-5 pages. The real goal isn’t hitting a specific page count; it’s about achieving clarity and building conviction.

    Your thesis needs enough meat on the bones to cover the core of your argument—the business model, its competitive moat, your valuation, and the biggest risks you see. But it also has to be tight enough that you could explain the entire investment case to a friend in five minutes without them glazing over. If it’s turning into a novel, you’ve probably lost the plot.

    The best investment theses are an exercise in disciplined thinking. They are the ultimate summary of your research, designed to distill a complex decision down to its most essential, powerful points.

    How Often Should I Review My Investment Thesis?

    Think of your thesis as a living document. It’s not some homework assignment you turn in and forget about. It's a dynamic tool that should change as new information rolls in.

    You need to get in the habit of pulling it out and challenging your own assumptions whenever something meaningful happens. What counts as meaningful?

    • Quarterly earnings reports: Are the latest numbers backing up your financial models, or are they telling a different story?
    • A major acquisition or merger: How does this move shake up the competitive landscape or totally alter the company’s strategy?
    • An industry-wide disruption: Has a new technology or a sudden regulatory change just torpedoed the company's future?

    A quick review every quarter is a solid routine. This simple practice keeps your original reasoning honest and grounded in the reality of what the market and the company are actually doing. It helps you stay ahead of the game instead of just reacting to it.

    What Is the Biggest Mistake Investors Make?

    Easy. By far, the most common trap is confirmation bias. It's that sneaky little voice in our heads that wants to find information that proves we were right all along, while conveniently ignoring anything that pokes holes in our brilliant idea.

    A well-constructed investment thesis is your best weapon against this bias. The process itself should force you to play devil’s advocate. You should be actively hunting for the counter-argument. If you can argue against your own investment better than anyone else, that’s when you know you’ve really done the work.


    Ready to build your own high-conviction portfolio? The Investogy newsletter offers a free, 3-minute weekly read that shows you exactly how we build and manage a real-money portfolio, complete with our own investment theses. Subscribe for free at Investogy.

  • A Guide to Stock Portfolio Analysis

    A Guide to Stock Portfolio Analysis

    Stock portfolio analysis is like a regular health check for your investments. It answers three big questions: How are my stocks performing? What risks lie ahead? And does everything still line up with my financial goals?

    Why Stock Portfolio Analysis Is Your Investing Playbook

    Image

    Imagine your portfolio as a high-stakes sports team. Each stock plays a role. Some are agile strikers (growth stocks) aiming for big gains. Others are reliable defenders (value stocks), ready to shield you when markets turn. But even champion players need a winning game plan.

    A solid analysis becomes your coach’s playbook. It digs into individual performance and, more importantly, how those stocks work together. With this insight, you tackle the tough calls that separate successful investors from guesswork.

    The Core Pillars Of Analysis

    At the heart of portfolio analysis lie three fundamental pillars:

    • Performance Measurement
      Dig deeper than “Did I beat the market?” Track the return you’re earning relative to the risk you’re taking on.

    • Risk Management
      Spot concentration gaps or overexposure. Ask yourself: How would a downturn in tech or energy affect my holdings?

    • Goal Alignment
      Your portfolio should be the vehicle for specific targets—retirement, college funds, or that dream home down payment.

    To see why these pillars matter, remember Modern Portfolio Theory, introduced in 1952 by Harry Markowitz. His work proved that diversification cuts risk when assets don’t move in perfect lockstep. In fact, a well-chosen basket of 20 to 30 stocks can capture about 90% of the diversification benefits of a massive portfolio. You can explore the original research on portfolio selection for more depth.

    A portfolio is more than a collection of stocks—it's a dynamic ecosystem. The links between holdings drive overall health just as much as individual performance.

    Core Components of Portfolio Analysis at a Glance

    Below is a quick reference to those three pillars. Keep it handy whenever you sit down to review your investments.

    Pillar Objective Key Question It Answers
    Performance Measurement Quantify returns adjusted for risk Am I getting paid enough for the volatility I face?
    Risk Management Identify and mitigate concentration or market threats What could cause a severe drop in my portfolio?
    Goal Alignment Ensure each holding contributes to your long-term targets Are my investments still steering me toward my goals?

    Use this table as a checkpoint each quarter to keep your strategy on track.

    Building A Stronger Portfolio

    Running these analyses regularly shifts you from passive ownership to active stewardship. You’ll spot when a position has grown too large or when an undervalued sector deserves more attention. You can trim back, redeploy capital, or even rethink your asset mix as life changes.

    It all starts with a solid foundation. Before diving into metric-by-metric analysis, get comfortable with the basics of how to assemble your lineup. Check out how to build a stock portfolio for a step-by-step guide that sets the stage for deeper evaluation.

    Decoding Your Portfolio Performance Metrics

    Image

    If you're only looking at the simple up-or-down return of your portfolio, you're missing most of the story. To really get what’s going on with your investments, you need to speak the language of performance metrics. These numbers are what tell you how you're getting your returns and how much risk you're taking on to get them.

    Think of it like popping the hood of a car. A quick glance at the dashboard tells you if the engine is running, but a real diagnostic check reveals its efficiency, power, and long-term health. That's what we're going to do here. We'll break down three of the most important diagnostic tools for any investor: Beta, Alpha, and the Sharpe Ratio.

    Understanding Beta: Your Portfolio’s Sensitivity

    First up is Beta. In simple terms, Beta measures how much your portfolio swings in price compared to the overall market (usually the S&P 500). It’s a gauge of volatility.

    Imagine your portfolio is a small boat and the market is the ocean. Beta tells you how much your boat rocks with the waves.

    • A Beta of 1.0 means your boat moves perfectly in sync with the ocean. If the market goes up 1%, your portfolio tends to follow suit with a 1% gain.
    • A Beta greater than 1.0 means you've got a more responsive boat. A portfolio with a Beta of 1.2, for instance, would theoretically jump 1.2% when the market rises 1%—but it would also drop 1.2% when the market falls 1%. This is a higher-risk, higher-reward setup.
    • A Beta less than 1.0 suggests a steadier vessel. A portfolio with a 0.8 Beta is less volatile, moving less than the overall market.

    Knowing your Beta is crucial. It tells you whether you’ve built a portfolio for aggressive growth (high Beta) or one that’s more defensive and stable (low Beta). It’s all about matching your risk profile to your personal comfort level.

    Measuring Alpha: A Report Card on Your Investing Skill

    If Beta is all about the movements caused by the market, Alpha is about the performance that can't be explained by the market. Think of it as the "excess return" you're generating thanks to your smart stock picking. It's a direct measure of the value you've added.

    Simply put, a positive Alpha is what we all strive for. It shows that your investment choices beat the market on a risk-adjusted basis. A negative Alpha, on the other hand, means you actually underperformed what was expected for the amount of risk you took.

    Alpha is what separates luck from skill. It cuts through the market noise to show the performance that is directly tied to your investment strategy. Nailing a consistently positive Alpha is the true sign of a great stock picker.

    For anyone just starting out, generating Alpha comes from mastering the basics. Our guide on how to analyze stocks for beginners is a great place to build that foundational knowledge for making smarter investment calls.

    Using the Sharpe Ratio: The Ultimate Risk-Adjusted Scorecard

    Finally, we have the Sharpe Ratio. This is arguably the most complete single metric for judging performance. It doesn’t just measure return against risk; it measures it against the return you could have gotten from a "risk-free" investment, like a U.S. Treasury bill.

    The Sharpe Ratio answers one of the most important questions in investing: "Am I actually being rewarded enough for the volatility I'm putting up with?" It’s your performance-per-unit-of-risk score.

    When comparing two portfolios, the one with the higher Sharpe Ratio is always the winner—it delivered better returns for the amount of risk taken. A ratio above 1.0 is generally considered good, and anything getting close to 2.0 is top-tier.

    To give you a clearer picture, let's break down these essential metrics in a quick-reference table.

    Essential Portfolio Metrics Explained

    Metric What It Measures Why It Matters
    Beta Your portfolio's volatility relative to the market (e.g., S&P 500). Helps you understand if your portfolio is aggressive (Beta > 1) or defensive (Beta < 1) and align it with your risk tolerance.
    Alpha The excess return your portfolio generates above what its Beta would predict. It's a measure of your skill in selecting investments that outperform the market on a risk-adjusted basis.
    Sharpe Ratio The risk-adjusted return, comparing your portfolio's performance to a risk-free asset. Gives you a "bang-for-your-buck" score on risk, telling you if the returns justify the volatility you're experiencing.

    By using these three metrics together, you get a much richer, multi-dimensional view of what's happening inside your portfolio. Beta frames the risk, Alpha measures your skill, and the Sharpe Ratio delivers the final verdict on whether it was all worth it.

    Your Step-By-Step Portfolio Analysis Framework

    Knowing the metrics is one thing, but actually putting them to work is a whole different ball game. A structured process is what turns all those abstract numbers into insights you can actually use, giving you a clear roadmap to follow when you check in on your investments. I've broken down my own comprehensive stock portfolio analysis into five manageable steps.

    Think of this as your annual financial check-up. It's a deliberate process I use to make sure my portfolio is healthy, still pointing toward my goals, and tough enough to handle whatever the market decides to throw at it. By following these steps, you’ll shift from just owning stocks to actively managing your financial future.

    Step 1: Gather Your Essential Data

    Before you can analyze anything, you have to get all your information in one place. This is the bedrock of the whole process—like an accountant gathering receipts before tackling a tax return. You simply can't assess what you can't see clearly.

    Start by pulling data from all your brokerage accounts, retirement plans (like a 401(k) or IRA), and anywhere else you hold stocks.

    You’ll need to jot down:

    • A complete list of every individual stock, ETF, and mutual fund you own.
    • The number of shares for each position.
    • The current market value of each holding.
    • Your cost basis for each investment (what you originally paid for it).
    • Any dividends or capital gains you’ve received.

    Most brokerage websites have a dashboard that lays all this out for you. The key is to get a complete, aggregated view of every single thing you own across all your accounts.

    Step 2: Clarify Your Investment Goals

    Okay, with your data wrangled, it's time to revisit your "why." Why are you even investing? Your goals are the filter for every decision you make, from how much risk you're willing to take to what your ideal asset mix looks like.

    A portfolio built for a 25-year-old just starting to save for retirement will—and should—look totally different from one designed for a 55-year-old who plans to hang it up in five years. Get specific. Are you shooting for aggressive growth, steady income, or just making sure you don't lose what you've got?

    Your financial goals are the North Star of your investment strategy. Without them, you’re just navigating without a map, and your stock portfolio analysis will lack meaningful direction.

    This is also the perfect time to get honest about your risk tolerance. Has anything changed in your life that makes you more—or less—comfortable with market swings? Answering that question ensures your portfolio aligns not just with your financial targets, but with your peace of mind.

    The infographic below shows how assessing risk is a central part of the whole analysis process, connecting your personal goals with what's actually in your portfolio.

    Image

    This visual really drives home the point that managing risk isn’t a one-and-done task. It’s an ongoing part of a healthy, functioning investment framework.

    Step 3: Assess Your Asset Allocation and Diversification

    Now we get to the fun part: looking at the actual makeup of your portfolio. Take a step back and look at your holdings from a 30,000-foot view. What percentage is in stocks versus other things? Within your stock holdings, how is your money spread out?

    You're hunting for concentration risk. Is more than 5-10% of your portfolio tied up in a single company? Sure, high conviction can pay off big, but being over-concentrated can be a disaster if that one golden goose suddenly stops laying eggs.

    Do the same thing with sector exposure. Are you accidentally all-in on tech? Or financials? A lack of diversification across different industries can leave you dangerously exposed to sector-specific downturns. A critical part of any good portfolio analysis is knowing how to analyze financial statements for the companies you're invested in.

    Step 4: Evaluate Performance Against a Benchmark

    This is where you grade your own homework. It’s not enough to see that your portfolio's value went up; you need to know if it performed well compared to the rest of the market. To do that, you need to pick an appropriate benchmark.

    For a portfolio made up mostly of big U.S. companies, the S&P 500 is the go-to benchmark. If you have a lot of money in international stocks, you might use something like the MSCI World index. Comparing your returns to a benchmark is like glancing at your speedometer on the highway; it gives you crucial context.

    Calculate your portfolio's return over the last year, three years, and five years. Now, put it right next to your benchmark's return over those same periods. Did you beat the market or did it beat you? This simple comparison, especially when you factor in metrics like your Sharpe Ratio, tells you if the risk you took was actually worth the reward you got.

    Step 5: Rebalance Your Portfolio

    The final step is turning your analysis into action. Rebalancing is simply the process of buying or selling assets to get your portfolio back to its original target allocation. It's a fact of life that some investments will grow faster than others, causing your carefully planned allocation to drift over time.

    For example, maybe your target was 70% stocks and 30% bonds. After a great year for stocks, your portfolio might have drifted to 80% stocks and 20% bonds. That means you’re now taking on more risk than you originally signed up for. Rebalancing would mean selling some stocks and using the proceeds to buy bonds, bringing you back to that 70/30 split.

    This disciplined process is powerful because it forces you to sell high and buy low, stripping the emotion out of your decisions. It’s the practical, hands-on application of all your hard work, ensuring your portfolio stays locked in on the strategy you so carefully built.

    Common Portfolio Analysis Mistakes To Avoid

    Picture yourself poring over charts late at night, certain you’ve dotted every “i” and crossed every “t.” Yet when the market hiccups or your returns fall flat, you realize it wasn’t a lack of data—it was hidden pitfalls. Portfolio analysis isn’t just about following steps; it’s equally about sidestepping the traps that derail even seasoned investors.

    Emotional biases and small oversights can erode returns over time. A sudden headline might spark a panic sale, or a tiny fee might quietly chip away at your gains year after year. By naming these common errors, you build a more resilient strategy that relies on thoughtful decisions instead of knee-jerk reactions.

    Chasing Last Year’s Winners

    It’s natural to want in on the hottest stocks or sectors. After all, who wouldn’t want to ride a wave of success? This tendency—often called performance chasing—is a bit like driving while staring only at your rearview mirror. You’re fixated on what’s behind you, not where you’re going.

    Yet market leadership rarely stays put. Tech stars of last year can become laggards today. In fact, a 2021 study found that less than 26% of top-quartile mutual funds stayed in that elite group over a full five-year stretch. Real insight comes from digging into a company’s fundamentals and mapping its role in your broader allocation—rather than simply following a hot streak.

    Letting Emotions Drive Decisions

    Fear and greed are powerful market forces—and terrible portfolio managers. Emotional investing usually leads to two classic blunders:

    • Panic Selling: When indexes slide, the urge to unload everything and “stop the bleeding” can be overwhelming. Often, this locks in losses just before a rebound.
    • FOMO Buying: At the opposite extreme, the “fear of missing out” pushes you into assets at peak valuations, right when risk is at its highest.

    Discipline Is The Bridge Between Investment Goals And Accomplishment.
    A systematic framework forces you to lean on data and strategy—never on gut reactions.

    A calm, goal-oriented plan turns market dips into potential opportunities instead of reasons to hit the eject button.

    Ignoring Fees And Taxes

    Tiny percentage points sound harmless, but over decades they add up. Many investors fixate on gross returns and overlook the drag of expenses and taxes.

    • An expense ratio of 1% versus 0.1% on a $100,000 portfolio costs you $900 extra each year.
    • Over 30 years, compounding magnifies that difference into tens of thousands in lost growth.
    • Frequent trading can trigger capital gains taxes, further cutting into your net performance.

    Any robust analysis must roll up expense ratios, commissions, and tax estimates to reveal your true after-cost return.

    Setting And Forgetting Your Portfolio

    Long-term investing is wise—but “set it and forget it” can backfire. Your goals, risk tolerance, and life circumstances evolve. What fit five years ago may feel off-target today.

    Market moves also shift your allocations. A bull run can inflate equities to a larger share of your portfolio, upping risk without you even noticing. That’s why:

    • Regular Checkups: Schedule periodic reviews—quarterly or semiannually—to ensure each holding still serves your plan.
    • Rebalancing: Trim overweight positions and top up underweights to keep your intended risk profile intact.

    Think of portfolio maintenance like servicing a car. You wouldn’t drive 100,000 miles on old oil—so don’t cruise years without a financial tune-up.

    The Best Tools for Modern Portfolio Analysis

    You don't need a Wall Street-sized budget to run a professional-grade portfolio analysis. In fact, you can do it right from your home computer with software that’s either free or surprisingly affordable.

    Most big brokerages, like Fidelity and Vanguard, bake basic analysis tools right into their platforms. These are great for a quick health check.

    You can easily chart your asset allocation, glance at simple risk metrics, and track your performance over time without ever leaving your account dashboard. Usually, you'll find things like:

    • Asset Maps: Simple pie charts or tree diagrams that give you a bird's-eye view of your allocations.
    • Performance Dashboards: These show your returns, maybe a few risk ratios, and sector heat maps to see what's hot and what's not.
    • Rebalancing Alerts: A handy nudge when your portfolio starts drifting away from your target allocations.

    When you're ready to go a layer deeper, dedicated platforms like Morningstar offer advanced screening tools and their well-known ratings. This is where you can really start drilling down into factor analysis and see how your individual holdings stack up against their peers.

    Key Considerations When Choosing a Tool

    Before you jump in, think about what you really need. Consider the depth of the data, how often it updates, and of course, the cost.

    A weekend hobbyist is probably looking for something with zero fees. A more serious investor, on the other hand, might happily pay a subscription for real-time data feeds and more powerful features.

    • Data frequency: Are delayed quotes okay, or do you need real-time data?
    • Custom reporting: Can you create your own views, or are you stuck with pre-set dashboards?
    • Integrations: Is it easy to export data to a spreadsheet or connect with other software?
    • Extra Context: Do they offer community ratings or professional analyst commentary?

    If you want to get serious about risk management and run stress tests or "what-if" scenarios, you'll need a platform with Monte Carlo simulations. It sounds complex, but tools like Portfolio Visualizer actually provide this for free.

    Stress-testing is like a fire drill for your portfolio. It shows you how your investments might hold up during extreme market swings, helping you prepare for risks before they happen.

    For those of us who live in spreadsheets, there are fantastic Excel plugins and specialized Python libraries like PyPortfolioOpt that can integrate right into your workflow. These are perfect for building custom metrics and running your own coded optimizations.

    Comparing Cost And Capabilities

    Generally, you get what you pay for. Free tools are great, but they might limit the number of holdings you can analyze at once or stick you with delayed data.

    1. Free Tier: Think of your brokerage dashboard with its slightly delayed quotes. Perfect for basic check-ups.
    2. Mid-Tier: Morningstar Premium is a good example here. You get access to their famous ratings and solid screening tools for a subscription fee.
    3. High-End: The Bloomberg Terminal is the holy grail, giving you exhaustive data for a cool $24,000/year.

    The key is to match a tool’s strengths to your personal priorities. If you're laser-focused on tax-efficient investing, you'll want a platform that has built-in cost basis tracking.

    My advice? Beginners should start with the tools on their existing broker's site. Get familiar with the basics there before even thinking about upgrading to more sophisticated software.

    For a deeper dive into what to do with these insights, check out our guide on portfolio rebalancing.

    Ultimately, the best tools for stock portfolio analysis are the ones that blend user-friendly visuals with data that’s robust enough for you to trust.

    • Use your brokerage tools for quick checks. They're free and convenient.
    • Upgrade to platforms like Morningstar when you need to dig deeper.
    • Bring in spreadsheets or Python if you want to automate advanced, custom reports.

    With just a few clicks, the right tool can give you a thorough analysis that helps you make your next investment move with confidence.

    Getting Started With Your Chosen Tool

    First things first, make a short list of what you actually need to accomplish. Is real-time quoting a must-have? Do you need API access to build automated reports?

    Once you have a tool in mind, just walk through their setup guides. Most platforms have tutorials or quick-start videos to get you up and running fast.

    • Have your account credentials handy for linking your broker sites.
    • Enable any API tokens if you're going the Python or Excel plugin route.
    • Take a few minutes to customize your dashboards so the metrics you care about most are front and center.

    After that initial setup, I recommend scheduling a monthly check-in to refresh your data and review your key metrics.

    Over time, you'll get more comfortable and might even discover new features that align with your evolving financial goals.

    A consistent review process builds discipline. It's what keeps you from overreacting to the daily market noise and making emotional decisions.

    By picking the right mix of free tools, premium platforms, and custom scripts, you'll build a resilient workflow for analyzing your stock portfolio.

    Start small, iterate as you learn, and always let the data guide your decisions.

    Happy analyzing, and may your portfolio thrive.

    Your Top Portfolio Analysis Questions Answered

    Even with a solid plan, it's natural to have questions when you start digging into your portfolio. Let's tackle some of the most common ones I hear from investors. I'll cut through the noise and give you direct, practical answers to help you move forward.

    Think of this as your quick-reference guide for those nagging questions—from how often you should be checking in on your stocks to the real difference between two of the most jumbled-up terms in finance.

    How Often Should I Analyze My Stock Portfolio?

    Finding the right frequency for portfolio analysis is a classic balancing act. You want to stay informed, but you don't want to overreact to every little bump in the market.

    A deep, comprehensive analysis is something you should tackle once or twice a year. This cadence is perfect for assessing your long-term strategy and performance without getting bogged down by the daily chatter and volatility.

    On top of that, a quick quarterly review is a great habit to build. It's a much lighter check-in, mainly to make sure your asset allocation hasn't drifted too far from your targets. Think of it as a quick course correction.

    However, some moments in life demand an immediate, full-scale portfolio review. These are the big ones:

    • Changing jobs or getting a major pay bump
    • An inheritance or another unexpected financial windfall
    • Getting close to a huge financial milestone, like buying a house or retiring

    Life changes, and your financial goals and risk tolerance will probably change right along with it. A fresh analysis is non-negotiable in these moments.

    What Is the Difference Between Asset Allocation and Diversification?

    People throw these terms around interchangeably, but they are two completely different layers of building a solid portfolio. Getting this right is fundamental to managing your risk effectively.

    Let’s use a home-building analogy.

    Asset allocation is your architectural blueprint. It’s the big-picture decision about how much of your money goes into broad categories like stocks, bonds, and cash. This single decision is the main driver of your portfolio's overall risk and potential return. It sets the foundation.

    Diversification, on the other hand, is choosing the specific materials to build that house. If your blueprint calls for 60% of the structure to be made of wood (stocks), diversification is about selecting different types of wood to ensure the whole thing is strong and resilient.

    So, for that 60% in stocks, you wouldn't just buy a bunch of tech companies. You'd spread it out across healthcare, industrials, and consumer staples. You’d also look at different geographies—like the US, international markets, and emerging markets—so your portfolio isn't completely tied to the fate of a single country's economy.

    Can I Do Portfolio Analysis Myself?

    Absolutely. Armed with the frameworks in this guide and the tools available today, any investor can run an effective portfolio analysis. The resources out there are incredible—especially the free tools most brokerage platforms now offer. They’re more than enough for most of us to get a great handle on our investments.

    Doing your own analysis is also a fantastic way to take real ownership of your financial future. It forces you to learn, builds discipline, and grows your confidence as an investor.

    That said, there are times when getting a professional's take is a smart move. Think about talking to a financial advisor if you:

    • Have a really complex financial life (like owning a business or dealing with tricky tax situations).
    • Just want an objective sounding board to keep you grounded during market craziness.
    • Need help with more advanced planning, like tax-loss harvesting or setting up an estate plan.

    A good advisor isn't there to just pick stocks; they're your coach, helping you stick to the game plan when your emotions are trying to call the shots.

    What Is a Good Sharpe Ratio for My Portfolio?

    The Sharpe Ratio is a fantastic metric for seeing if you're getting enough bang for your risk-taking buck. But what's considered "good" is all relative.

    As a general rule of thumb, a Sharpe Ratio that stays consistently above 1.0 is solid. It means your portfolio is generating a positive return for every unit of risk you're taking on. A ratio getting close to 2.0 is excellent, and anything above 3.0 is truly exceptional (and pretty rare to see over the long haul).

    But here’s the real secret to using the Sharpe Ratio: it’s a tool for comparison, not a standalone grade. Its true power comes from pitting your portfolio’s ratio against its main benchmark, like the S&P 500. If your portfolio consistently pulls off a higher Sharpe Ratio, it’s a clear sign your strategy is delivering better risk-adjusted performance. And that's exactly what you're aiming for.


    Ready to stop guessing and start building a smarter portfolio? The Investogy newsletter offers a transparent, real-world look at how we manage our own money. Subscribe for free and get actionable insights delivered to your inbox every week. Join the community at Investogy.

  • Stock Picking vs Index Funds A Complete Guide

    Stock Picking vs Index Funds A Complete Guide

    Deciding between picking individual stocks or just buying index funds is one of the first major crossroads every investor faces.The difference is pretty straightforward: stock picking is an active game where you try to beat the market, while investing in index funds is a passive strategy where you aim to simply match the market's performance. The right choice for you boils down to whether you want to be a hands-on analyst trying to unearth hidden gems, or if you prefer a “set-it-and-forget-it” approach that rides the market as a whole.

    Understanding Your Core Investment Choices

    The stock picking vs. index funds debate isn't just about what you buy; it’s about two completely different investment philosophies. One path has you playing detective, sifting through company reports and market data for undervalued treasures. The other path makes you a passenger, trusting that the entire market will move in the right direction over time.

    Image

    The Active Path of Stock Picking

    Stock picking is exactly what it sounds like—you analyze individual companies to decide if their stock is a smart buy. This is an active, often time-consuming, process that requires a ton of research. You're essentially betting that you can spot opportunities that other investors have overlooked.

    If you go down this road, you have to be ready to commit to:

    • Deep Research: This means digging into financial statements, understanding industry trends, and figuring out a company's competitive edge.
    • Constant Monitoring: You can't just buy and walk away. You need to keep up with company news, quarterly earnings reports, and broader economic shifts.
    • Emotional Discipline: This is a big one. You have to fight the urge to panic-sell during a downturn or chase the latest hot stock without doing your homework.

    The whole point is to build a portfolio of stocks that, together, will deliver better returns than the overall market average. If you're curious about the nuts and bolts, our guide on how to build a stock portfolio breaks it down step-by-step.

    The Passive Path of Index Funds

    The philosophy behind index funds is simple: consistently beating the market is incredibly difficult, even for the pros. So, instead of trying to find the needle in the haystack, you just buy the whole haystack. An index fund, like one that tracks the S&P 500, simply owns all the stocks in that particular market index.

    This approach comes with some major perks:

    • Instant Diversification: By buying one fund, you own a tiny slice of hundreds or even thousands of companies. This spreads out your risk immediately.
    • Low Effort: Once you've made your investment, the hard part is over. There's no ongoing need to research individual companies or make frequent trading decisions.
    • Predictable Returns: Your performance will very closely track the underlying market index, minus a tiny management fee.

    An index fund basically guarantees you'll capture the market's return. You're removing the risk of underperforming because you picked the wrong stocks. It's really a bet on the long-term growth of the entire economy.

    To make things even clearer, let's break down the key differences in a simple table.

    Stock Picking vs Index Funds at a Glance

    This table sums up the fundamental differences between the two approaches, giving you a quick snapshot of what each path entails.

    Attribute Stock Picking (Active) Index Funds (Passive)
    Primary Goal Outperform the market average Match the market average
    Time Commitment High (ongoing research required) Low (set and forget)
    Required Skill High (financial analysis, market knowledge) Low (basic investment principles)
    Diversification Low to moderate (depends on portfolio size) High (built-in and immediate)
    Typical Costs Higher (trading fees, research tools) Very Low (minimal expense ratios)

    As you can see, these two strategies are built for very different types of investors with different goals, time commitments, and risk tolerances.

    Contrasting Core Investment Philosophies

    When you get down to it, the "stock picking vs. index funds" debate is really a clash between two completely different views on how the market actually works. Your decision isn't just about what to buy; it's about picking a side and aligning with a core belief that will guide your entire investment strategy. Each path demands a totally different mindset and set of expectations.

    Image

    The philosophy of stock picking is all about active pursuit and deep conviction. It’s rooted in the belief that the market isn't perfectly efficient. Stock pickers are hunters, operating on the assumption that with enough research, skill, or a unique insight, they can spot pricing mistakes and find those hidden gems—undervalued companies ready to take off.

    This isn't a passive activity. It requires an analytical, often contrarian, mindset. You have to be willing to roll up your sleeves and dig deep into company financials, size up the management team, and truly understand the competitive battlefield. You’re looking for something the rest of the market has missed.

    The Mindset of the Stock Picker

    The active investor is confident they can get an edge. They use specific tools and playbooks to find these opportunities, often falling into distinct camps. For example, knowing the difference between growth vs value investing is fundamental to understanding the different ways pickers approach the market.

    • Fundamental Analysis: This is the classic detective work. You’re poring over a company's balance sheets, income statements, and cash flow to figure out its true, or intrinsic, value. The whole point is to buy stocks for less than they’re actually worth.
    • Technical Analysis: This approach is more about market psychology. It involves studying chart patterns and trading volumes to predict where a stock's price might go next, believing that history often rhymes.

    "Investors vote with their dollars. They’ll buy or sell a stock if they perceive it as under- or over-valued. On average, over time, yes, we expect a stock’s price to be correlated to the company’s value. But there are periods when a stock price is disjointed from its value."

    This core belief in market inefficiency is what drives the whole thing. The stock picker is betting they can exploit those temporary gaps between a stock's price and its real value, aiming to beat the market averages.

    The Philosophy of the Index Fund Investor

    On the other side of the aisle, the philosophy behind index funds is one of acceptance and humility. It’s tied directly to the Efficient Market Hypothesis (EMH), which basically says that stock prices already reflect all the known information out there. If that's true, then trying to consistently find a bargain is a fool's errand.

    This belief leads to a simple but powerful conclusion: if you can't beat the market, just own the market. Index fund investors don't waste time trying to outsmart the collective wisdom of millions. They just aim to capture the market's overall return by buying a slice of everything, like all the companies in the S&P 500. For anyone wanting to delve deeper into passive versus active investment strategies, understanding this core principle is the place to start.

    This passive approach is built on a few key pillars:

    • Broad Diversification: By owning the whole haystack, you don't have to worry about one needle breaking. It minimizes the risk of a single company's collapse wrecking your portfolio.
    • Low Costs: No expensive analysts, no frequent trading. This keeps fees incredibly low, which means more of your money stays invested and working for you.
    • Simplicity: The strategy is dead simple. You buy, you hold, and you let the market do its thing. It doesn't require constant attention or deep expertise.

    The fundamental bet here is that long-term economic growth will lift the market as a whole. The most reliable way to build wealth, then, is to simply ride that wave at the lowest possible cost. It’s a pragmatic acceptance that trying to beat the market is a game very few people win over the long haul.

    Comparing Historical Performance and Real Returns

    When you're weighing stock picking against index funds, theories are nice, but the real story is in the numbers. Decades of performance data tell a clear and consistent tale: the average active stock picker just doesn't keep up with a simple market index. Over the long haul, the evidence stacks up heavily in favor of the passive approach.

    The problem for stock pickers isn't just about finding a winning company. It's about finding enough winners to jump two hurdles: the higher fees that come with active trading and the relentless, broad growth of the market itself. We all love the stories of legendary investors who hit it big on a single stock, but those are the exceptions—statistical outliers, not the reality for most people.

    The Statistical Hurdle of Beating the Market

    Long-term studies drive this point home again and again. The S&P Dow Jones Indices runs a regular report card (the SPIVA scorecard) that pits fund managers against their benchmarks, and the results are pretty brutal for the active crowd.

    Over the last 15 years through 2023, a jaw-dropping 88% of large-cap active funds failed to beat the S&P 500. Let that sink in. And it's not just large-cap stocks. Across every single equity category, not one saw a majority of its active managers outperform their index over that 15-year period. You can find plenty of great market analyses and discussions that dive deeper into this active vs. passive debate.

    This isn't a fluke. Year after year, the data shows that while a handful of managers might get lucky and beat the market in a given year, almost none can do it consistently over five, ten, or fifteen years.

    The big takeaway from decades of market history is this: your odds of outperforming a low-cost index fund get smaller and smaller the longer you invest. Short-term luck eventually runs out, but the market's average return and the drag of high fees are forever.

    The infographic below really paints a picture of the difference in both average returns and the expenses you'll typically pay for each strategy.

    Image

    As you can see, higher fees act like a direct anchor on the potential returns of an active strategy. Meanwhile, index funds get to enjoy market-level returns without that costly baggage.

    The Hidden Trap of Survivorship Bias

    There's another huge factor that makes stock picking look more successful than it really is: survivorship bias. This is a classic statistical illusion where the performance data we see only includes the "survivors"—the funds or stocks that are still around.

    The losers? They get quietly swept under the rug. Failed funds and delisted companies are removed from the performance charts, which makes the average returns of the remaining group look a whole lot better than they should.

    Think about it like this: say you start with 100 active funds. Over ten years, 30 of them perform so terribly that they shut down. When you go to analyze performance, you're only looking at the 70 that made it. The final numbers are skewed, painting an overly rosy picture of success.

    This bias creates a really misleading story. It hides the true failure rate of active management and makes picking winners seem much easier than it actually is. When you factor in all the funds that started the race—not just the ones that crossed the finish line—the case for index funds becomes even more powerful. Any potential return from an active strategy has to be weighed against this very real risk of failure, a risk that passive indexing all but eliminates.

    Analyzing Risk Management and Diversification

    How you handle risk is every bit as important as the returns you chase. When it comes to stock picking versus index funds, the approaches to managing risk couldn't be more different. One is a game of concentrated bets, the other is all about broad market exposure. Each path comes with a completely unique risk profile that will shape your potential for big wins and painful losses.

    Image

    The biggest beast you have to slay with stock picking is concentration risk. When you hand-pick individual stocks, you're tying a huge chunk of your financial future to the fate of just a few companies. If you pick a winner, the rewards can be incredible. But if just one of your core holdings gets knocked down, your entire portfolio can take a nasty hit.

    The Dangers of Company-Specific Risk

    History is littered with the corpses of industry giants that looked unstoppable right before they collapsed, driving home just how volatile betting on single companies can be. Think about BlackBerry, once the king of the smartphone world, or General Electric, a former blue-chip icon. Both saw their stock prices crater due to new technology and disastrous management decisions. An investor who went all-in on either of those would have watched their wealth vaporize.

    This gets to the heart of the stock picking challenge: you’re not just battling broad market downturns, you’re also exposed to company-specific risk. This is all the stuff that can go wrong with just one business, like:

    • A string of bad calls from the executive suite
    • A major product launch that flops
    • A new competitor that comes out of nowhere
    • Sudden regulatory or legal nightmares

    These things are brutally hard to predict, making even the most deeply researched stock pick a high-stakes gamble. The odds are stacked against you, too. Research from JP Morgan found that, on average, nearly 30% of S&P 500 stocks deliver negative returns of 5% or more each year. That really shows you how easy it is to pick a loser, even from a pool of supposedly elite companies.

    The Built-In Safety Net of Index Funds

    Index funds come at risk from the complete opposite direction. Instead of trying to find that one golden needle of a winning stock, an index fund just buys the entire haystack. This strategy gives you instant, powerful diversification—one of the most tried-and-true tools for managing risk.

    By owning a tiny piece of hundreds, or even thousands, of companies, you dramatically shrink the impact any single company's failure can have on your money. If one stock in the S&P 500 goes bankrupt, its effect on the total index—and your investment—is practically a rounding error.

    This built-in diversification is your shield against company-specific risk. Your investment’s success is no longer riding on a few CEOs or a handful of products, but on the collective growth of an entire market or the economy as a whole. You’re essentially trading the lottery-ticket potential of a massive single-stock gain for a much smoother, more predictable ride.

    For anyone looking to beef up their portfolio's defenses, our guide on how to diversify an investment portfolio is a great place to start. This passive approach hitches your long-term success to the broad, persistent trends of the market, not the wild and unpredictable fortunes of individual businesses.

    The True Impact of Costs, Fees, and Taxes

    Beyond the flashy performance charts, there's a quiet killer of investment returns: costs and taxes. It's not the most exciting topic, I get it. But ignoring it is like trying to fill a bucket with a hole in it. These small, consistent leaks can drain a massive portion of your long-term growth, acting as a constant headwind on your portfolio.

    The difference between stock picking and index funds here isn't just a minor detail; it's a massive gap that directly hits your final account balance.

    When you're actively picking stocks, you're constantly doing something. And in the world of investing, every action has a cost.

    • Trading Commissions: Every time you hit that buy or sell button, there's friction. Even with "zero-commission" trades, frequent activity can lead to other fees or less-than-ideal execution prices. It all adds up.
    • Advisory Fees: If you've hired someone to manage your stock portfolio, their fee is a direct drag on your results. A typical fee of around 1% of your assets annually might sound small, but that's 1% you have to beat every single year just to break even with the market.
    • Fund Expense Ratios: For investors who choose actively managed mutual funds, the expense ratios are in a different universe compared to passive funds. We're often talking 0.50% to over 1.5% annually. That fee pays for the research analysts and portfolio managers making those active bets.

    This financial drag is a huge reason why beating the market is so incredibly tough over the long haul. A mountain of evidence shows that most active stock pickers fail to keep up with simple index funds. In fact, various studies have found that somewhere between 92% and 95% of actively managed funds fell short of their benchmarks over a 15-year period. High fees and tax inefficiency are the primary culprits. You can dig into more data on why picking stocks often falls short for the vast majority of people.

    Comparing Cost and Tax Efficiency

    Let's lay it out side-by-side. The contrast in the financial drag between these two approaches becomes crystal clear when you see the numbers.

    Factor Stock Picking (Active) Index Funds (Passive)
    Expense Ratio Higher (often 0.50% – 1.5%+) Extremely Low (often 0.03% – 0.10%)
    Trading Costs Higher due to frequent buying/selling Minimal due to low portfolio turnover
    Tax Efficiency Lower; frequent trading triggers capital gains Higher; buy-and-hold strategy defers taxes
    Advisory Fees Common if using a professional manager Typically none for self-directed investors

    The table really tells the story. On every single cost metric, the active approach starts with a significant handicap that it must overcome year after year.

    The Power of Tax Efficiency

    The cost battle extends deep into the world of taxes, where index funds have a massive structural advantage.

    By definition, active stock pickers are buying and selling to try and time the market. Every time they sell a stock for a profit after holding it for less than a year, it triggers a short-term capital gains tax. This isn't some small fee; it's taxed at your ordinary income tax rate, which is the highest rate you pay.

    Index funds, on the other hand, are the champions of tax efficiency. Their entire game plan is to simply buy and hold all the stocks in an index. This results in incredibly low portfolio turnover, meaning they almost never sell their holdings unless the index itself changes.

    The low-turnover nature of index funds means you are rarely hit with unexpected capital gains distributions. This allows your investment to compound more effectively over time, as more of your money remains invested in the market rather than being siphoned off to pay taxes.

    This tax deferral is a powerful, built-in benefit. By kicking the tax can down the road, index funds let your wealth grow unimpeded for years, sometimes decades. When you combine this structural tax advantage with their rock-bottom fees, you get a powerful tailwind that active strategies are constantly fighting against.

    So, Which Strategy Is Right for You?

    Look, choosing between picking individual stocks and buying index funds isn't about finding some magical "correct" answer that works for everyone. The right path is deeply personal. It comes down to your goals, how much time you can realistically put in, and frankly, your stomach for risk.

    Let's cut to the chase: for the vast majority of people trying to build wealth over the long haul, the evidence points overwhelmingly toward index funds. If your goal is steady, reliable growth without turning investing into a second job, this is almost certainly your best bet.

    The Case for Making Index Funds Your Core Strategy

    Index funds are built for the investor who values their time, appreciates simplicity, and understands the power of diversification. This is the right fit for you if this sounds familiar:

    • You're in it for the long game. You're investing for decades, not days. Your focus is on capturing the market's overall growth, not trying to time the next hot stock.
    • You've got a life to live. You'd rather spend your free time doing literally anything else besides poring over financial statements and watching market news like a hawk.
    • You prefer to sleep at night. The thought of your financial future riding on the quarterly earnings report of a handful of companies sounds more stressful than exciting.
    • You're smart about costs. You get that low fees and tax efficiency are huge, often overlooked, drivers of your total returns over time.

    For most people, the winning formula is simple: accept the market's return through a diversified, low-cost index fund, build your financial plan around that, and then get on with your life. It’s an incredibly powerful, drama-free path to success.

    When Does Picking Stocks Actually Make Sense?

    While index funds are the smart default, there is a certain type of person for whom picking individual stocks might be a reasonable consideration—usually for a small, speculative part of their overall portfolio. This path is really only for those who have a rare mix of skill, time, and temperament.

    This approach might be for you if:

    • You genuinely love business analysis. You enjoy the process of digging into a company's fundamentals, competitive landscape, and management team. You have the financial chops to do it right.
    • You can commit serious time. This isn't a casual hobby. It demands consistent, dedicated hours for research and ongoing monitoring.
    • You have a high tolerance for getting punched in the gut. You can handle the reality of watching an individual stock drop 50% or more without panicking and selling at the worst possible time.

    Even for this type of investor, the data is clear: trying to consistently beat the market is an incredibly difficult game. The odds are stacked against even the most brilliant and dedicated individuals.

    The Hybrid Play: The Core-Satellite Model

    For many, the most pragmatic solution is the core-satellite model. It's a hybrid approach that lets you have your cake and eat it too, combining the reliability of passive indexing with the potential excitement of active stock picking.

    Here’s the breakdown:

    1. The Core: The vast majority of your portfolio—think 80-95%—is invested in a diversified basket of low-cost index funds. This is the stable, reliable foundation of your wealth-building engine.
    2. The Satellites: A small, clearly defined portion—say, 5-20%—is allocated to individual stocks or other active investments you've researched to death.

    This model lets you scratch that itch to find the "next big thing" without betting the farm. Your core index funds do the heavy lifting for your long-term goals like retirement, while the satellite portion is your designated space for high-conviction ideas. It’s a disciplined framework that gives you the best of both worlds.

    Common Questions Answered

    When you're weighing stock picking against index funds, a lot of practical "what if" scenarios pop up. Let's tackle some of the most common questions head-on to help you figure out where you land.

    Can I Do Both Stock Picking and Index Funds?

    Yes, you absolutely can. In fact, blending the two is a popular and pretty smart strategy.

    It's often called the core-satellite model. Think of it this way: the "core" of your portfolio, maybe 80-95% of it, is built on solid, low-cost index funds. This is your foundation for steady, long-term growth—the part you don't want to mess with.

    The "satellite" portion is the other 5-20%. This is your playground for picking individual stocks. It lets you chase those high-conviction ideas you believe in, aiming for bigger returns without putting your main financial goals on the line. It’s a great way to scratch the stock-picking itch while keeping the reliable engine of passive investing running.

    Is Stock Picking a Better Move for Younger Investors?

    There's a common argument that because younger investors have decades ahead of them, they can afford to take on the higher risks of stock picking. They have time to recover from any big losses, right?

    While it's true that a long time horizon is a huge advantage, it doesn’t magically make stock picking the superior choice. The hard numbers still show that most active investors fail to beat the market over the long run, and that applies whether you're 25 or 55.

    A better way to look at it is this: a young investor can use a small, non-essential slice of their portfolio to learn the ropes of stock analysis. Think of it as educational money. The key is making sure the vast majority of their savings—the serious retirement money—is parked in diversified, low-cost index funds to let compounding do its heavy lifting without taking wild swings.

    The efficient market hypothesis is probably wrong. Or at least, it has clear flaws. But 99% of people should act as if it’s perfectly right.

    This quote really nails it. Even if you believe you can find an edge in the market, the odds are so stacked against you that for most people, simply matching the market with an index fund is the winning move.

    What if I Find a Stock Picker with an Incredible Track Record?

    It's incredibly tempting. You see a fund manager who has absolutely crushed the market for years and think, "This is the one." But be careful—past performance is a notoriously poor predictor of future results.

    Research has shown time and again that the few managers who outperform the market for a stretch rarely keep it up. A hot streak is often just that—a streak, driven by a mix of luck and survivorship bias (you never hear about the funds that blew up and disappeared).

    When you bet on a star manager, you're not just betting they'll keep winning; you're betting they'll win by enough to overcome their high fees. That's a huge hurdle to clear, year after year, when a simple index fund is right there, chugging along with the market at a fraction of the cost.

    How Many Stocks Do I Actually Need for Diversification?

    If you decide to build your own portfolio from individual stocks, getting diversification right is a big deal and a lot harder than it looks.

    There isn't a single magic number, but most financial pros suggest you need a bare minimum of 20-30 stocks. And not just any stocks—they need to be spread across different industries and sectors. If you hold fewer, you're exposed to massive company-specific risk. A bad earnings report or a scandal at just one or two companies could wreck your entire portfolio.

    But let's be real: even with 30 well-chosen stocks, you're nowhere near as diversified as a broad market index fund. An S&P 500 index fund, for example, gives you a piece of 500 different companies instantly. That's why index funds offer such robust risk management right out of the box, without all the capital and ongoing research required to build and maintain a stock portfolio yourself.


    Ready to see these ideas in action? The Investogy newsletter is a transparent, real-money portfolio where we share the "why" behind every investment. Subscribe for free and learn alongside us.

    Subscribe to Investogy for Actionable Investing Insights

  • 6 Smart Tax Loss Harvesting Strategies for 2025

    6 Smart Tax Loss Harvesting Strategies for 2025

    Welcome to our deep dive into one of the most powerful tools available to savvy investors: tax loss harvesting. In a market where every percentage point counts, strategically managing your tax liability can significantly enhance your long-term returns. But beyond simply selling losing investments, a world of sophisticated tax loss harvesting strategies exists, each designed for different portfolio needs and investor goals. This is about turning market downturns into tangible financial advantages.

    This guide moves past generic advice, offering a detailed roundup of six distinct, actionable methods. We will break down everything from straightforward direct harvesting and asset substitution to more advanced approaches like factor-based and automated daily harvesting. You will learn not just what these strategies are, but how to implement them effectively within your own portfolio.

    We will provide a clear framework, complete with practical examples and implementation tips, to help you navigate the complexities of tax-efficient investing. By the end of this article, you will have the knowledge to apply these powerful techniques, helping you keep more of your hard-earned gains and build a more resilient, tax-optimized portfolio for the years ahead. Let's get started.

    1. Direct Tax Loss Harvesting

    Direct tax loss harvesting is the foundational strategy for managing capital gains tax liability in a taxable brokerage account. It involves the straightforward process of selling an investment, such as a stock, ETF, or mutual fund, that has decreased in value since its purchase. By "realizing" this loss, you can use it to offset capital gains you've realized from selling other investments for a profit, thereby reducing your overall tax bill.

    This is one of the most accessible and widely used tax loss harvesting strategies because of its simplicity. If you have no capital gains to offset in a given year, you can still use these harvested losses to deduct up to $3,000 against your ordinary income (like your salary). Any remaining losses beyond that can be carried forward to future tax years indefinitely.

    Direct Tax Loss Harvesting

    How It Works in Practice

    The core of this strategy lies in a simple, two-step process: sell a losing position and then, if you wish to maintain market exposure, reinvest the proceeds into a similar but not "substantially identical" asset. This second step is crucial to avoid the IRS wash sale rule, which disallows the loss deduction if you buy back the same or a very similar security within 30 days before or after the sale.

    Key Insight: The goal isn't just to sell losers. It's to strategically realize losses to create a tax asset that can be used to offset gains, all while keeping your portfolio's target allocation and market exposure intact.

    Real-World Example

    Imagine an investor, Sarah, has two key positions in her portfolio:

    • 100 shares of TechCorp (TC): Purchased at $200/share, now trading at $150/share (a $5,000 unrealized loss).
    • 50 shares of HealthGiant (HG): Purchased at $100/share, which she sold this year at $200/share (a $5,000 realized gain).

    Without any action, Sarah would owe capital gains tax on her $5,000 profit from HealthGiant. Using direct tax loss harvesting, she sells her 100 shares of TechCorp, realizing the $5,000 loss. This loss directly cancels out her $5,000 gain, reducing her capital gains tax liability for that specific transaction to zero. To maintain her exposure to the tech sector, she could reinvest the proceeds from the TechCorp sale into a broad technology-focused ETF.

    Actionable Implementation Tips

    • Review Quarterly: Don't wait until the end of the year. Market volatility can create harvesting opportunities at any time. A quarterly review allows you to act proactively.
    • Prioritize Loss Types: Use short-term losses to offset short-term gains first, as these are taxed at higher ordinary income rates. Then, match long-term losses against long-term gains.
    • Maintain Detailed Records: Keep meticulous records of purchase dates, cost basis, sale dates, and sale prices. This documentation is essential for accurate tax filing and for tracking your carryover losses for future years.
    • Plan Your Reinvestment: Before you sell, identify the replacement investment. This ensures you don't miss out on potential market upside and that your portfolio remains aligned with your long-term financial goals.

    2. Asset Substitution Strategy

    The Asset Substitution Strategy is a more sophisticated tax loss harvesting approach that focuses on maintaining market exposure while realizing losses. It involves selling a losing investment and immediately reinvesting the proceeds into a similar, but not "substantially identical," asset. This maneuver allows an investor to capture a tax loss without missing potential market rebounds, effectively keeping their portfolio allocation intact.

    This strategy has become a cornerstone of automated tax loss harvesting services offered by robo-advisors and advanced portfolio management platforms. By swapping one asset for a highly correlated substitute, you sidestep the IRS wash sale rule while ensuring your investment thesis remains active in the market. This is one of the most powerful tax loss harvesting strategies for investors who prioritize continuous market participation.

    The summary box below outlines the core components of this strategy.

    Infographic showing key data about Asset Substitution Strategy

    These key takeaways highlight how the strategy skillfully balances tax optimization with consistent investment exposure.

    How It Works in Practice

    The process hinges on identifying a suitable replacement security before you sell the losing one. The substitute asset should track a similar index or represent the same sector, but it must be different enough to avoid the wash sale rule. Common examples include swapping one S&P 500 ETF for another from a different fund provider or replacing an individual stock with a sector-specific ETF.

    Key Insight: The brilliance of asset substitution is that it separates the tax decision from the investment decision. You harvest a loss for tax purposes without having to liquidate your position in a particular market segment or asset class.

    Real-World Example

    Consider an investor, Alex, who wants to optimize his portfolio's tax efficiency:

    • Investment: He holds 200 shares of the Vanguard S&P 500 ETF (VOO), purchased at $400/share. It is now trading at $350/share, representing a $10,000 unrealized loss.
    • Goal: Alex wants to harvest this loss to offset other gains but believes the S&P 500 will recover soon and doesn't want to be out of the market.

    Using the asset substitution strategy, Alex sells all 200 shares of VOO, realizing the $10,000 loss. He immediately uses the proceeds to buy shares of the SPDR S&P 500 ETF Trust (SPY). Since VOO and SPY are managed by different companies and have different fund structures, they are not considered "substantially identical," and the wash sale rule is avoided. Alex has successfully harvested a tax loss while maintaining his investment in the S&P 500.

    Actionable Implementation Tips

    • Create a Substitute List: Proactively identify and maintain a list of pre-approved substitute investments for the core holdings in your portfolio. This allows you to act quickly when an opportunity arises.
    • Compare Expense Ratios: When choosing a replacement ETF or mutual fund, compare the expense ratios and tracking errors of the new asset. A slightly higher fee on the replacement could eat into your long-term returns.
    • Understand Correlation: Research the correlation between your original holding and the potential substitute. The goal is to find a replacement that moves in a similar pattern to maintain your portfolio's risk and return characteristics.
    • Use Different Fund Families: The safest way to avoid the wash sale rule when swapping funds is to choose a replacement from a completely different fund provider (e.g., swapping a Vanguard fund for a Schwab or iShares fund).

    3. Tax Loss Harvesting with Portfolio Rebalancing

    Tax loss harvesting with portfolio rebalancing is an integrated strategy that kills two birds with one stone: it maintains your portfolio's desired asset allocation while simultaneously creating tax assets. This approach uses the natural process of rebalancing, which involves selling assets that have grown beyond their target weight and buying underperforming ones, as a prime opportunity to realize losses.

    This method transforms routine portfolio maintenance into a powerful tax-efficiency tool. Instead of treating loss harvesting and rebalancing as separate events, you combine them. This ensures your investment strategy remains on track while you systematically capture tax benefits from market downturns affecting specific asset classes.

    How It Works in Practice

    The strategy hinges on your regular portfolio review cycle. When an asset class deviates significantly from its target allocation, you take action. If an asset has overperformed, you sell a portion to realize gains (ideally long-term). If another has underperformed, you sell it to harvest a loss and then use the proceeds, plus potentially some funds from the overperforming asset, to bring your allocations back in line.

    Key Insight: This strategy embeds tax-loss harvesting into your core investment discipline. It turns market volatility from a source of anxiety into a systematic opportunity to improve your portfolio's after-tax returns.

    Real-World Example

    Consider an investor, Mark, whose target allocation is 60% stocks and 40% bonds. After a strong year for stocks and a flat year for bonds, his portfolio has drifted to 68% stocks and 32% bonds. Within his stock allocation, his international stock fund is down.

    • Initial State: Portfolio is overweight in domestic stocks and underweight in bonds and international stocks. The international stock fund has a $4,000 unrealized loss.
    • Action: To rebalance, Mark sells some of his overperforming domestic stocks. Simultaneously, he sells his entire position in the international stock fund, realizing the $4,000 loss.
    • Result: He uses the proceeds to buy more bonds and a different, non-substantially identical international stock ETF to bring his portfolio back to the 60/40 target. The $4,000 harvested loss can now be used to offset other capital gains or up to $3,000 of ordinary income. For a deeper dive into the mechanics of this, you can learn more about what portfolio rebalancing is and how it works.

    Actionable Implementation Tips

    • Set Rebalancing Thresholds: Establish clear rules for when to rebalance, such as when an asset class deviates by 5% or 10% from its target. This makes the process systematic rather than emotional.
    • Prioritize Losses During Rebalancing: When you review your portfolio, make identifying loss-harvesting candidates the first step. Let these opportunities guide your rebalancing trades.
    • Use Tax-Advantaged Accounts: When possible, conduct trades that would generate gains (like selling over-performers) within tax-advantaged accounts like an IRA or 401(k), as these gains are not taxed.
    • Document Your Rationale: Keep a record of why each rebalancing trade was made. Note the target allocation drift and the specific loss harvested. This documentation is valuable for tax purposes and for reviewing your strategy's effectiveness.

    4. Factor-Based Tax Loss Harvesting

    Factor-based tax loss harvesting is an advanced strategy that moves beyond simple market-cap-weighted indices. It focuses on harvesting losses within specific investment "factors" like value, growth, momentum, quality, or size. This approach allows investors who follow a factor-based or "smart beta" strategy to optimize for tax efficiency without deviating from their core investment thesis.

    This sophisticated technique involves selling a factor-specific ETF or mutual fund at a loss and replacing it with another fund that provides similar exposure to the same factor. Because different fund providers use unique methodologies to capture factor exposure, it's possible to switch between them to harvest losses while adhering to the wash sale rule.

    How It Works in Practice

    The strategy operates on the principle that two funds aiming to capture the same factor, such as "small-cap value," can be different enough to avoid the "substantially identical" clause of the wash sale rule. They might use different screening criteria, weighting schemes, or rebalancing frequencies. An investor sells the underperforming factor fund, realizes the loss, and immediately reinvests in a similar but distinct alternative.

    This maintains the portfolio's strategic tilt towards the desired factor, ensuring the investor doesn't miss out on a potential rebound in that segment of the market. This method is one of the more nuanced tax loss harvesting strategies, popular among investors who use funds from providers like Dimensional Fund Advisors (DFA) or Avantis.

    Key Insight: Factor-based harvesting allows you to treat your strategic portfolio tilts as tax optimization assets. You can realize losses within a specific factor while keeping your portfolio precisely aligned with your long-term, factor-driven investment philosophy.

    Real-World Example

    Consider an investor, Alex, who believes in a long-term allocation to the "value" factor.

    • He owns 200 shares of Value ETF A (VTA): Purchased at $100/share, now trading at $85/share (a $3,000 unrealized loss).
    • He also sold a profitable growth stock earlier in the year, realizing a $4,000 capital gain.

    To offset part of this gain, Alex sells his 200 shares of VTA, realizing the $3,000 loss. He wants to maintain his value tilt, so he immediately reinvests the proceeds into Value ETF B (VTB). VTB also targets value stocks but uses a slightly different index and weighting methodology than VTA, making it a suitable replacement that avoids the wash sale rule. The $3,000 loss reduces his taxable capital gain from $4,000 to just $1,000.

    Actionable Implementation Tips

    • Understand Methodologies: Before executing a swap, research the underlying indices and construction rules of both the original and replacement funds. Ensure they are not "substantially identical" in the eyes of the IRS.
    • Monitor Factor Cycles: Factors often move in cycles. Be prepared to harvest losses during periods when your chosen factor is underperforming the broader market.
    • Use Different Fund Families: The safest way to find a suitable replacement is often to choose a fund from a different provider (e.g., swapping a Vanguard value fund for a Schwab value fund).
    • Consider International Exposure: A domestic factor fund could potentially be replaced with an international fund targeting the same factor, providing another layer of differentiation for wash sale purposes while maintaining the desired factor exposure.

    5. Automated Daily Tax Loss Harvesting

    Automated daily tax loss harvesting leverages technology to monitor portfolios constantly and execute trades the moment a harvesting opportunity meets predefined criteria. This high-frequency approach, popularized by robo-advisor platforms, aims to capture more, smaller losses throughout the year rather than waiting for a periodic manual review, potentially maximizing the total tax savings over time.

    This strategy is one of the most hands-off and efficient tax loss harvesting strategies for investors who prefer a set-it-and-forget-it approach. By using algorithms to check positions daily against market fluctuations, it can act on dips that might recover before a human investor would even notice, systematically generating tax assets to offset gains.

    How It Works in Practice

    The core of this strategy is a sophisticated algorithm that runs daily. It scans every position in your portfolio, compares its current market value to its cost basis, and automatically triggers a sale if the loss exceeds a certain threshold. The proceeds are then immediately reinvested into a correlated but not "substantially identical" alternative ETF to maintain the portfolio's intended asset allocation and avoid the wash sale rule.

    Key Insight: Automation transforms tax loss harvesting from a reactive, year-end task into a proactive, continuous portfolio management process. This strategy capitalizes on daily market volatility, ensuring no opportunity, big or small, is missed.

    Real-World Example

    Consider an investor, Alex, who uses a robo-advisor like Betterment or Wealthfront that offers this service.

    • Portfolio: Alex holds an ETF tracking the S&P 500.
    • Market Event: On a Tuesday, a sudden market dip causes his S&P 500 ETF to drop 3% by midday, creating an unrealized loss that meets the platform's harvesting threshold.
    • Automated Action: The system automatically sells the S&P 500 ETF, realizing the loss. It immediately reinvests the funds into a different large-cap U.S. stock ETF with similar market exposure, like one tracking the Russell 1000 index.

    By Wednesday, the market recovers, and the original S&P 500 ETF is back to its previous price. A manual investor might have missed this brief window, but Alex's automated system successfully "banked" a capital loss he can use to offset future gains, all without disrupting his investment plan.

    Actionable Implementation Tips

    • Understand the Thresholds: Check what loss percentage or dollar amount triggers a trade on your chosen platform. Ensure it aligns with your preferences to avoid overly frequent, minor trades.
    • Verify Wash Sale Tracking: Confirm that the platform's algorithm is sophisticated enough to track potential wash sales across all your accounts on that platform, especially if you hold similar securities in different accounts (e.g., an IRA and a taxable account).
    • Monitor Asset Allocation: While the goal is to maintain allocation, frequent trading can cause minor drifts. Periodically review your portfolio to ensure it remains aligned with your long-term goals. For more details on this topic, discover these portfolio management best practices.
    • Choose the Right Platform: Not all automated services are equal. Compare the fees, the quality of the replacement ETFs used, and the intelligence of the harvesting algorithm before committing.

    6. Cross-Asset Class Loss Harvesting

    Cross-asset class loss harvesting expands the traditional strategy beyond a single category, like domestic stocks, to your entire portfolio. It involves realizing losses in one asset class (e.g., bonds, international equities, commodities) to offset gains in another (e.g., U.S. stocks, REITs). This approach acknowledges that different parts of a diversified portfolio rarely move in perfect unison, creating a broader set of opportunities to generate tax assets throughout the year.

    This is a more sophisticated tax loss harvesting strategy that leverages the principles of modern portfolio theory. Because asset classes like stocks and bonds often have low or negative correlations, a downturn in one area can provide valuable losses to shield gains in another, helping to smooth out the tax impact of an otherwise strong year for your overall portfolio.

    How It Works in Practice

    The strategy operates by looking at your portfolio holistically. Instead of just searching for losses within your U.S. stock holdings, you scan for underperformance across international funds, bond ETFs, real estate investment trusts (REITs), and even commodity funds. The goal is to find pockets of unrealized losses anywhere they exist and use them to offset realized gains from your best-performing assets, regardless of their class.

    Key Insight: This method transforms diversification from a purely risk-management tool into an active tax-management advantage. The inherent lack of correlation between different asset classes becomes a consistent source of tax-loss harvesting opportunities.

    Real-World Example

    Consider an investor, David, whose well-diversified portfolio experienced mixed results during a period of rising interest rates:

    • U.S. Stock Fund: He sold shares for a $7,000 realized gain.
    • Bond Fund: The fund's value dropped due to rising rates, creating a $6,000 unrealized loss.
    • REIT Fund: Benefiting from a strong real estate market, this fund has a $4,000 unrealized gain.

    Using cross-asset class harvesting, David sells his position in the bond fund to realize the $6,000 loss. This loss directly offsets $6,000 of his $7,000 stock fund gain, leaving him with only $1,000 in taxable gains. To maintain his fixed-income allocation, he reinvests the proceeds into a different bond fund with a similar duration and credit quality to avoid the wash sale rule.

    Actionable Implementation Tips

    • Understand Asset Correlations: Familiarize yourself with how different asset classes typically behave relative to one another. For example, bonds often perform well when stocks fall, and vice versa.
    • Maintain Target Allocations: When you sell an asset in one class, be prepared to reinvest in a suitable, non-identical replacement to keep your portfolio's strategic balance. Learn more about how to diversify an investment portfolio.
    • Look Beyond Stocks and Bonds: Don't forget about other asset classes like REITs, emerging market funds, or commodity ETFs, which can provide unique harvesting opportunities.
    • Monitor Macro-Economic Trends: Events like interest rate changes or global economic shifts often impact entire asset classes, creating widespread opportunities for this strategy.

    Tax Loss Harvesting Strategies Comparison

    Strategy Implementation Complexity 🔄 Resource Requirements ⚡ Expected Outcomes 📊 Ideal Use Cases 💡 Key Advantages ⭐
    Direct Tax Loss Harvesting Low – straightforward selling of losing positions Minimal – basic transaction and record-keeping Immediate tax benefit by offsetting gains and up to $3,000 ordinary income Investors with taxable accounts having gains and losses in the same year Simple, immediate tax benefits, easy to implement
    Asset Substitution Strategy Medium – requires knowledge of similar but non-identical assets Moderate – research and transaction costs for substitutes Tax losses realized while maintaining market exposure and avoiding wash sales Investors wanting continuous market exposure without wash sale violations Preserves investment strategy, avoids wash sale rules
    Tax Loss Harvesting with Portfolio Rebalancing High – requires ongoing tracking and complex portfolio management High – sophisticated tools and monitoring required Combined tax efficiency and disciplined portfolio maintenance Investors practicing regular portfolio rebalancing Dual benefits of tax loss and portfolio discipline
    Factor-Based Tax Loss Harvesting High – deep understanding of factor investing needed Moderate to High – requires factor-based funds and analysis Maintains factor exposures and tax efficiency through strategic substitutions Sophisticated investors focused on factor-based strategies Maintains advanced strategies while harvesting losses
    Automated Daily Tax Loss Harvesting High – technology-driven with automated execution High – advanced software and real-time monitoring necessary Maximizes harvesting opportunities and tax alpha via daily automation Investors using robo-advisors and automated platforms Maximal harvesting frequency, removes emotional bias
    Cross-Asset Class Loss Harvesting High – involves multiple asset classes and complex tracking High – requires comprehensive portfolio knowledge Maximizes tax benefits across diversified asset classes while maintaining diversification Multi-asset portfolios seeking broad loss harvesting Broad diversification, multiple offset and substitution options

    Integrating Tax Efficiency into Your Long-Term Investment Philosophy

    The journey through various tax loss harvesting strategies reveals a powerful truth: tax efficiency isn't an afterthought, but a foundational pillar of sophisticated investing. It's about transforming market downturns from liabilities into opportunities. We've explored a range of tactics, from the foundational direct harvesting approach to the more advanced factor-based and cross-asset class methods. Each strategy offers a unique tool for sculpting a more resilient and tax-optimized portfolio.

    The core takeaway is that you have options. Whether you prefer the hands-on control of manual rebalancing or the systematic precision of automated daily harvesting, the right strategy for you depends on your portfolio's complexity, your time commitment, and your overall investment philosophy. The goal remains constant: to capture losses strategically to offset gains, thereby lowering your tax bill and ultimately boosting your after-tax returns. This proactive approach ensures you keep more of what you earn, compounding your wealth more effectively over the long term.

    Key Takeaways for Your Investment Toolkit

    To distill these concepts into actionable intelligence, consider these primary points:

    • Proactivity Over Reactivity: The most effective tax loss harvesting isn't a year-end scramble. It's an ongoing, systematic process that identifies opportunities as they arise, not just when tax deadlines loom.
    • Avoid the Wash Sale Rule: This is the single most important rule to master. Diligently tracking your trades and understanding the 31-day window before and after a sale is non-negotiable for any of these strategies to be valid.
    • Alignment is Crucial: Your chosen strategy must align with your long-term asset allocation. The objective is to harvest losses without fundamentally altering your investment thesis or risk exposure, using tools like asset substitution to maintain market position.
    • Start Simple, Scale Up: If you're new to this, begin with direct tax loss harvesting. As you gain confidence, you can integrate it with your regular portfolio rebalancing or explore more nuanced approaches.

    Your Actionable Next Steps

    Mastering tax loss harvesting is a significant step toward financial optimization. To integrate these principles effectively, start by reviewing your portfolio now. Identify any positions currently at a loss and evaluate if a corresponding replacement investment exists that aligns with your goals. For a broader perspective on how tax efficiency fits into overall financial planning, it's beneficial to understand comprehensive wealth management strategies. This holistic view ensures that your tax-saving efforts work in concert with your other financial objectives, such as estate planning and retirement goals.

    Ultimately, viewing your portfolio through a tax-aware lens is a paradigm shift. It elevates your role from a passive investor to an active manager of your own wealth. By consistently applying these tax loss harvesting strategies, you are not just navigating market volatility; you are harnessing it. You are turning inevitable market fluctuations into a powerful engine for enhancing your net returns, ensuring your financial plan is as efficient and robust as possible.


    Ready to put these advanced strategies into practice with professional-grade tools? Investogy provides the sophisticated analytics and portfolio tracking you need to identify tax loss harvesting opportunities and execute them with precision. Elevate your investment game at Investogy.