The digital age has armed retail investors with an arsenal of powerful resources, turning what was once a data-deprived landscape into an information-rich environment. However, this abundance creates a new challenge: navigating the noise to find genuinely useful stock market research tools. The right platform can transform your investment strategy from guesswork to a data-driven process, while the wrong one can lead to analysis paralysis and costly mistakes.
This guide is designed to cut through that clutter. We will explore 12 of the most effective tools available, moving beyond generic feature lists to provide a practical analysis. For each platform, you'll find a detailed breakdown of its core features, pricing, pros, cons, and who it's best suited for, complete with screenshots and direct links to help you evaluate it yourself.
We have organized these resources to help you identify the perfect fit for your specific needs, whether you're a long-term value investor, a technical trader, or simply seeking to build conviction in your decisions. Our goal is to equip you with the best stock market research tools to enhance your workflow, build confidence, and ultimately help you become a more informed investor.
1. Investogy
Best For: Active investors seeking transparent, real-world portfolio insights and narrative-driven research.
Investogy distinguishes itself from typical stock market research tools by offering a unique, narrative-driven weekly newsletter. Instead of bombarding users with raw data, it provides concise, actionable analysis that reveals the "why" behind every investment decision. This approach is grounded in a real-money portfolio, allowing subscribers to follow a tangible journey of value investing principles in action.
The platform's core strength is its radical transparency. The team shares not just their successes but their thought processes and reflections, fostering a deep sense of trust and accountability. This "skin in the game" methodology demystifies complex investment theses, making them accessible to both new and experienced investors. The concise, 3-minute weekly read respects the user's time while delivering impactful, high-signal content.
Key Takeaway: Investogy excels at building investor conviction. By following a public portfolio grown from $50,000 to over $60,000, subscribers gain a practical education in market analysis, risk management, and long-term strategy, a feature few other tools offer so directly.
Standout Features & Analysis
- Transparent Real-Money Portfolio: Track a live portfolio with detailed performance metrics. This provides an unparalleled learning tool, showing how investment theses play out in real market conditions.
- Narrative-Driven Research: Each newsletter explains the reasoning behind portfolio moves, offering qualitative insights that numbers alone cannot capture. This helps users develop their own analytical frameworks.
- Expert-Level Readership: With subscribers from top firms like Google, OpenAI, and Meta, the content is vetted by a sophisticated audience, ensuring a high standard of quality and relevance.
Practical Considerations
| Feature | Details |
|---|---|
| Pricing | Completely free weekly newsletter. |
| Primary Focus | Value investing within a single, concentrated US-based portfolio. |
| User Experience | Clean, minimalist email format designed for a quick and focused 3-minute read. |
| Limitations | The scope is intentionally narrow. It does not cover broad market indices, alternative asset classes, or diverse trading strategies. |
Website: https://investogy.com
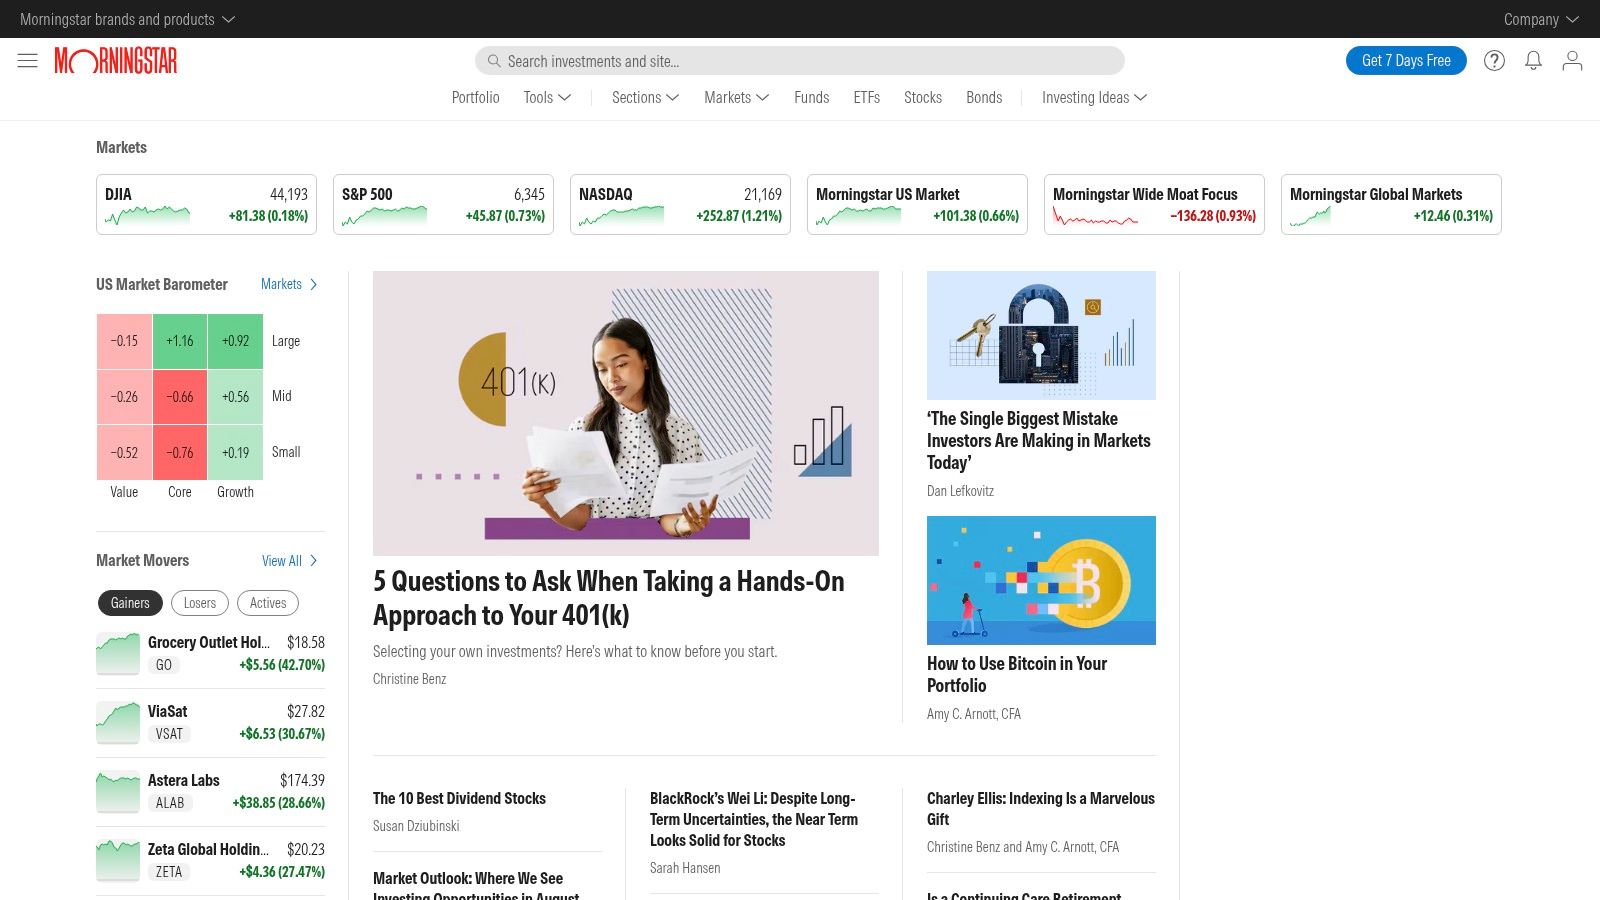
2. Morningstar
Morningstar has long been a cornerstone for fundamental investors, earning its reputation through rigorous, independent analysis of stocks, mutual funds, and ETFs. It stands out among stock market research tools by focusing on long-term value investing principles rather than short-term market noise. The platform's strength lies in its proprietary ratings and comprehensive analyst reports, which provide a clear, data-driven thesis on a company's prospects. This approach helps investors look beyond simple metrics, like the P/E ratio, to understand a company's economic moat, stewardship, and fair value.
Key Features & Use Cases
The "Portfolio X-Ray" tool is a particularly powerful feature. It allows you to analyze your entire investment portfolio for hidden risks, sector over-concentration, and overlapping holdings across different funds. This is invaluable for investors seeking to build a truly diversified and balanced portfolio.
- Best For: Long-term, value-oriented investors who prioritize fundamental analysis.
- Pricing: Basic data is free. A Premium membership, which unlocks analyst reports, fair value estimates, and the best screening tools, costs around $35 per month or $249 per year.
- Pros: Trusted, unbiased research; excellent tools for portfolio analysis; extensive database.
- Cons: Limited tools for technical traders; most valuable features require a paid subscription.
For a deeper dive into the metrics Morningstar uses in its analysis, you can learn more about understanding the Price-to-Earnings ratio on Investogy.com.
Official Website: https://www.morningstar.com/
3. Seeking Alpha
Seeking Alpha has carved out a unique space among stock market research tools by championing a crowd-sourced model for investment analysis. Unlike platforms that rely solely on in-house analysts, it brings together thousands of contributors, from seasoned financial professionals to knowledgeable individual investors. This approach provides a vast and diverse library of opinions and theses on a wide range of stocks, especially smaller companies that often lack coverage from Wall Street. The platform excels at offering different perspectives, allowing investors to see both the bullish and bearish cases for a potential investment.
Key Features & Use Cases
A standout feature is the access to earnings call transcripts, which allows users to read the direct dialogue between company management and analysts. This is an invaluable resource for gaining unfiltered insights into a company’s performance and strategy. The platform also offers its proprietary "Quant Ratings," which provide an objective, data-driven evaluation of a stock's characteristics compared to its industry peers.
- Best For: Investors who value diverse viewpoints and want to perform deep due diligence, including reading primary source materials.
- Pricing: Limited free article access. Premium is around $239/year and unlocks unlimited content, Quant Ratings, and other features.
- Pros: Enormous breadth of coverage; multiple perspectives on a single stock; timely news and analysis.
- Cons: Content quality can be inconsistent; the best analysis and tools are behind a paywall.
Official Website: https://seekingalpha.com/
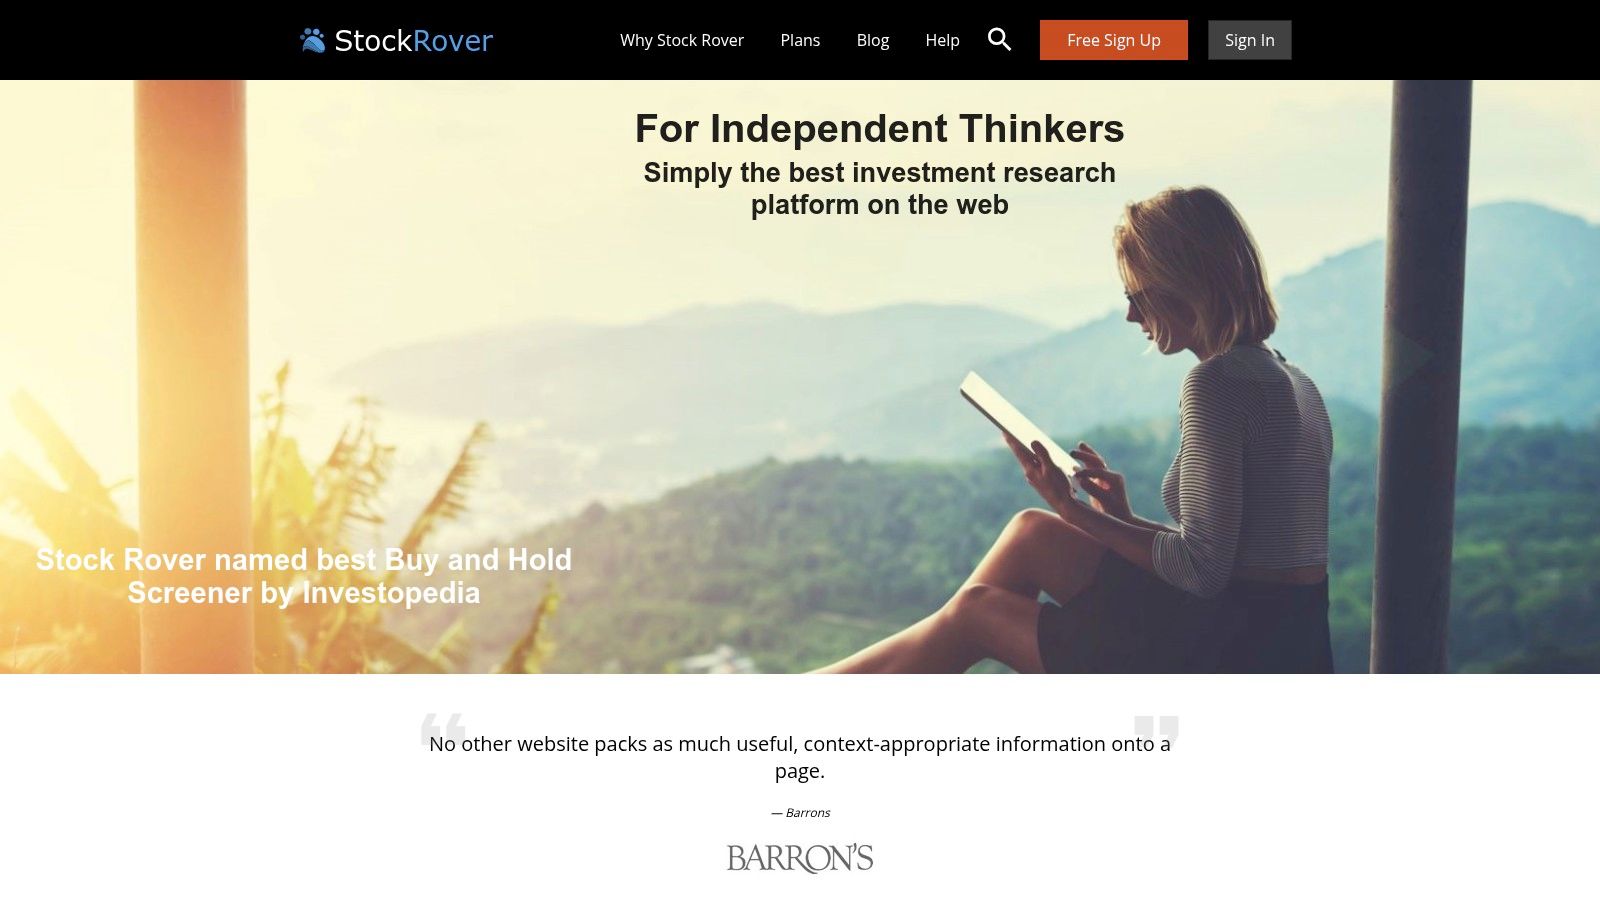
4. Stock Rover
Stock Rover excels as a powerful, all-in-one platform for investors who crave deep, data-driven insights. It stands out among stock market research tools by combining sophisticated screening, robust portfolio analytics, and comprehensive research capabilities into a single, integrated interface. The platform is particularly revered for its vast library of over 700 financial metrics, allowing users to build incredibly detailed and customized screens that go far beyond what most free tools offer. This makes it an ideal choice for serious fundamental investors aiming to uncover undervalued opportunities based on specific criteria.
Key Features & Use Cases
One of Stock Rover's most compelling features is its highly customizable "Views" and "Screeners." You can create and save unique table layouts that show only the metrics you care about, then apply powerful screening filters to quickly narrow down thousands of stocks to a manageable list. This is perfect for investors testing specific hypotheses, like finding companies with consistent dividend growth and low debt-to-equity ratios.
- Best For: Data-focused investors who want granular control over their screening and analysis.
- Pricing: A free plan is available. Paid plans range from the Essentials plan at around $7.99/month to the Premium Plus plan at $47.99/month, unlocking more metrics and historical data.
- Pros: Extensive data coverage with hundreds of metrics; highly customizable interface and screeners; affordable pricing tiers for advanced features.
- Cons: Has a steeper learning curve for beginners; the web-based interface can feel dated, and there is no dedicated mobile app.
To see how Stock Rover compares with other top platforms, you can check out this guide on the best stock market analysis tools on Investogy.com.
Official Website: https://www.stockrover.com/
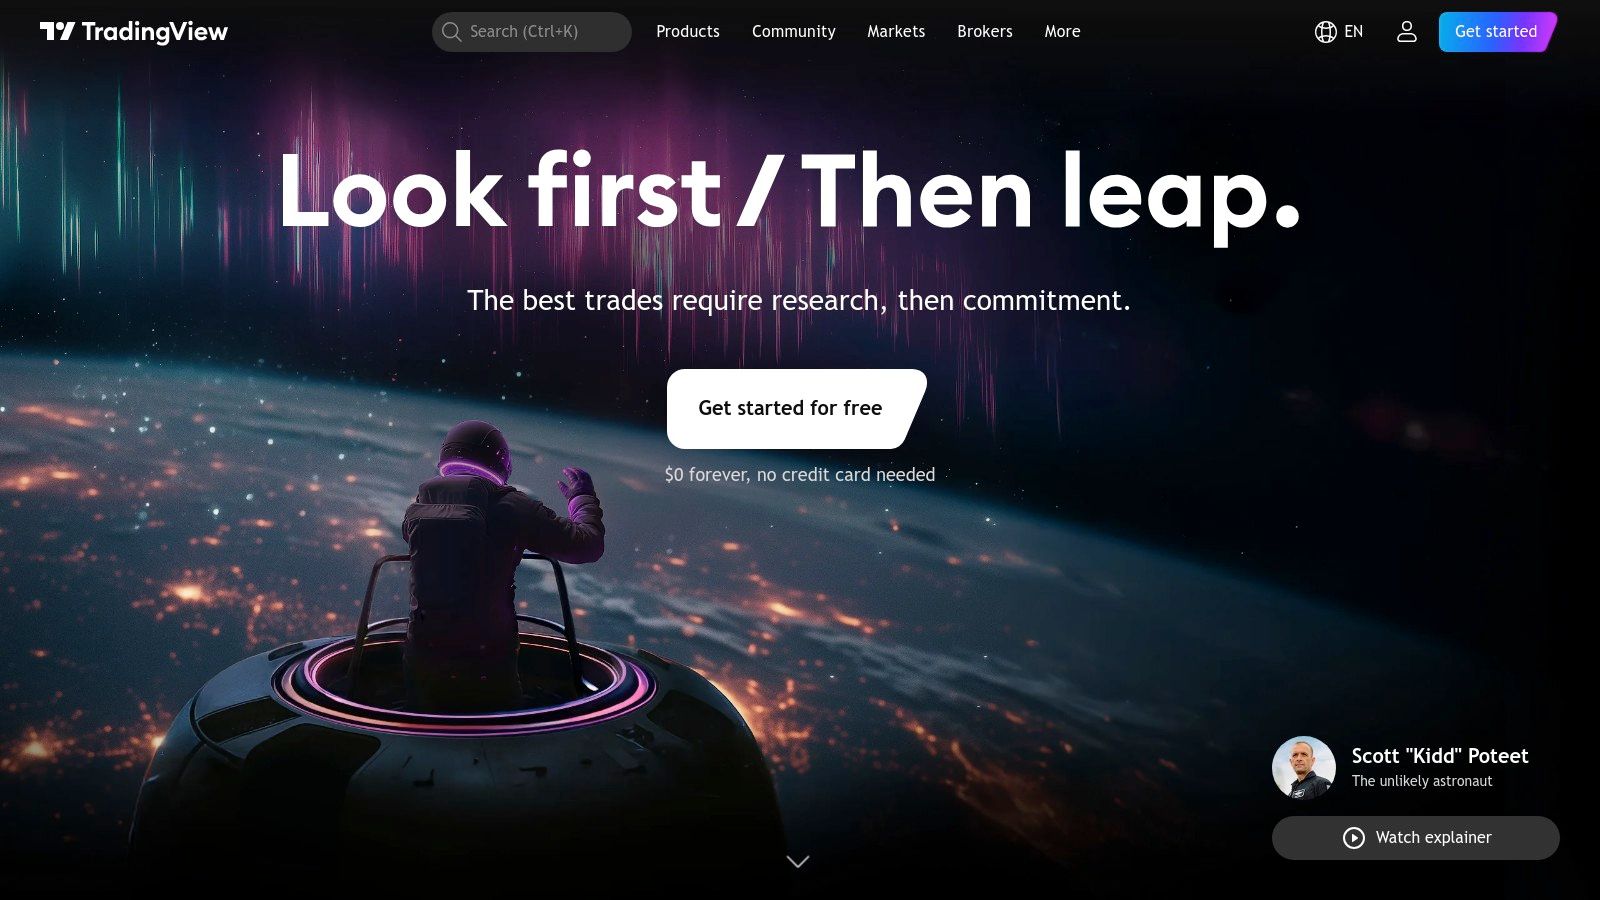
5. TradingView
TradingView has emerged as the go-to platform for technical analysis, blending powerful charting tools with a vibrant social network for traders. It excels by making sophisticated charting accessible to everyone, from beginners to seasoned professionals, directly within a web browser. Unlike many other stock market research tools that focus heavily on fundamentals, TradingView's primary strength is its visual and interactive approach to market analysis. Its seamless, intuitive interface allows users to easily overlay countless indicators, draw trend lines, and share their analysis with a global community, fostering collaborative learning and idea generation.
Key Features & Use Cases
The platform's social features are a major differentiator. Users can publish their own chart analyses, or "Ideas," and follow other traders to see their real-time market commentary. This creates a dynamic environment for discovering new strategies and getting feedback on your own. The custom stock screener is also highly versatile, letting you filter for specific technical setups across thousands of assets.
- Best For: Technical traders and chartists who value community collaboration and best-in-class charting tools.
- Pricing: A free Basic plan offers core charting features. Paid plans (Pro, Pro+, and Premium) unlock more indicators, layouts, and real-time data, starting around $14.95 per month.
- Pros: Exceptional and user-friendly charting; huge library of community-built indicators; active social community.
- Cons: Fundamental analysis tools are limited compared to specialized platforms; advanced features require a subscription.
Official Website: https://www.tradingview.com/
6. TipRanks
TipRanks demystifies the world of expert financial opinion by aggregating and ranking the performance of Wall Street analysts, financial bloggers, and corporate insiders. This unique approach provides investors with a transparent, data-driven view of who to trust, making it one of the most innovative stock market research tools available. Instead of just presenting analyst ratings, the platform tracks their historical accuracy, allowing users to filter for advice from top-performing experts only. This focus on accountability helps cut through the noise and identify credible investment ideas.
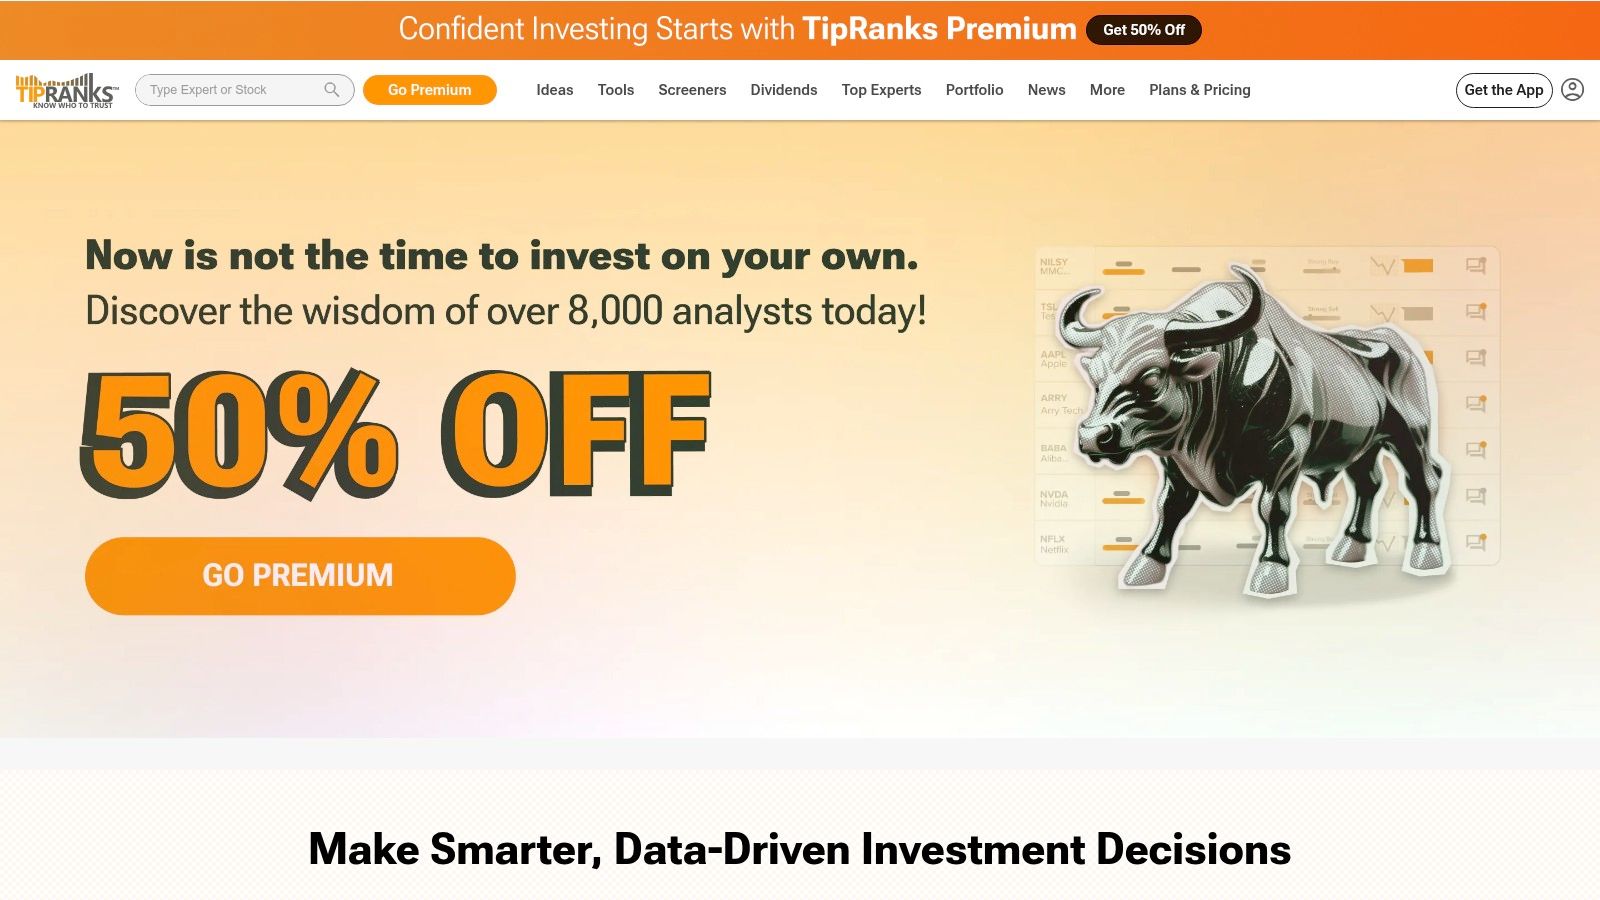
Key Features & Use Cases
A standout feature is the "Smart Score," which distills eight key factors, including analyst ratings, blogger sentiment, and insider activity, into a single, easy-to-understand score from 1 to 10. This is exceptionally useful for quickly assessing a stock's potential without getting lost in complex data. It helps investors generate new ideas by highlighting stocks that have a strong consensus from top-performing market watchers.
- Best For: Investors who want to leverage expert sentiment and data aggregation to validate their ideas or discover new ones.
- Pricing: Basic features are free. Premium plans, which unlock top analyst ratings and advanced tools, start at around $35.97 per month or $359 per year.
- Pros: Excellent transparency on analyst performance; aggregates multiple expert sources; user-friendly interface and Smart Score system.
- Cons: Limited tools for deep technical analysis; the most actionable insights require a paid subscription.
Official Website: https://www.tipranks.com/
7. Yahoo Finance
Yahoo Finance has served as a gateway to financial information for millions of investors, earning its spot as one of the most accessible stock market research tools available. It excels by providing a comprehensive, no-cost platform that combines real-time data, breaking news, and basic portfolio management in one place. Its strength lies in its sheer breadth and immediacy, offering everything from stock quotes and interactive charts to press releases and analyst ratings. This makes it an indispensable starting point for new investors and a reliable daily resource for seasoned market watchers who need quick access to market data.
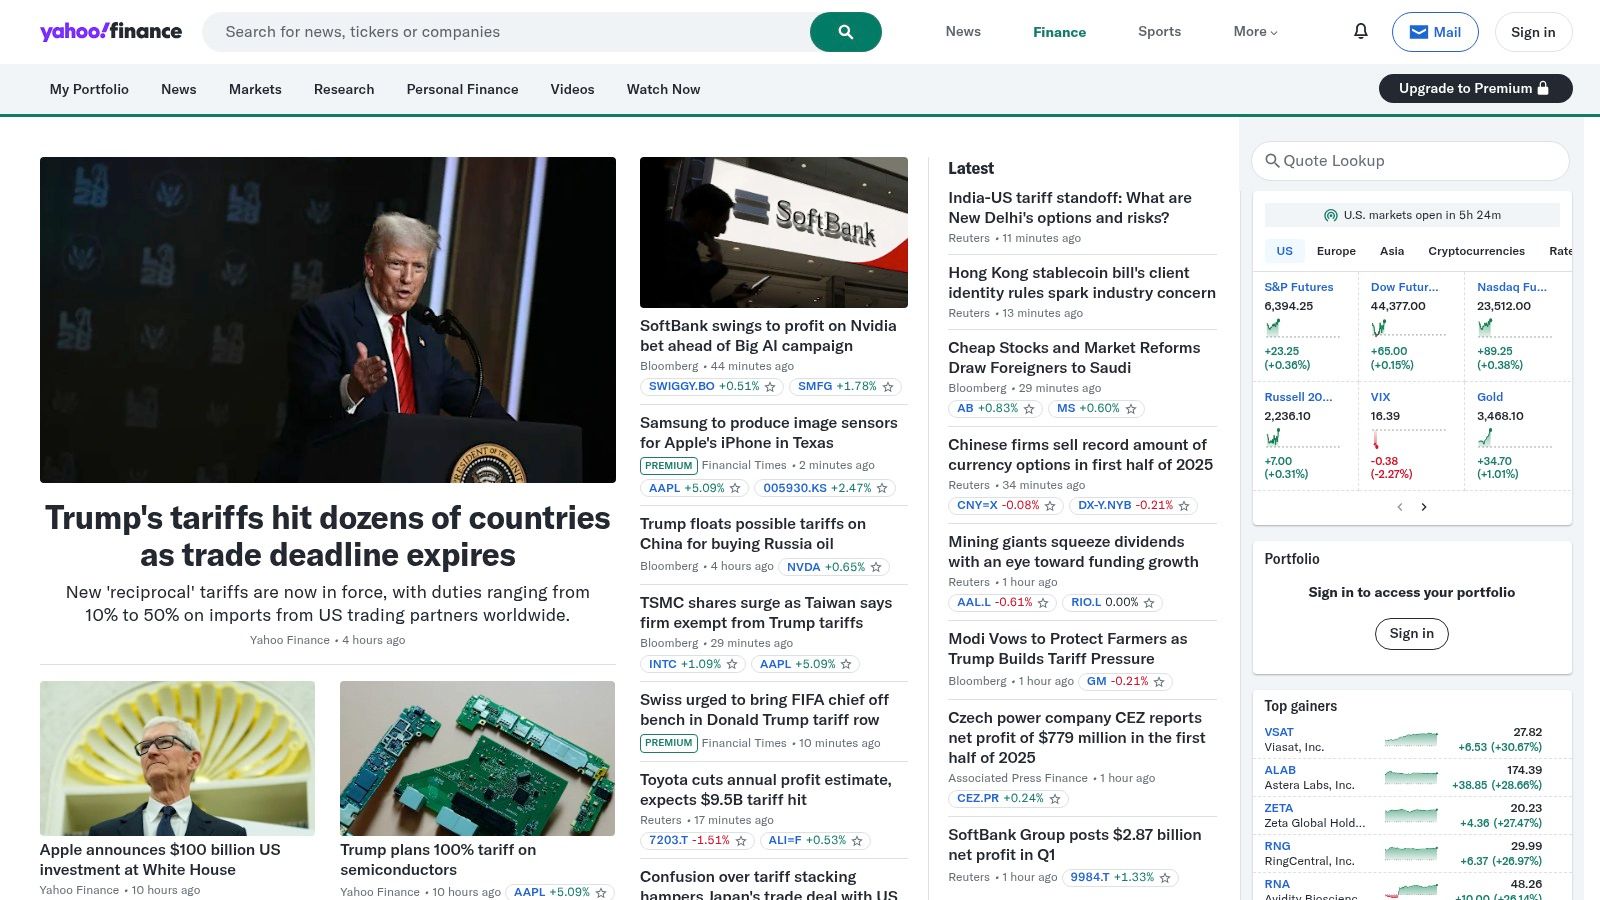
Key Features & Use Cases
The portfolio tracking tool is a standout feature for its simplicity and utility. Users can link their brokerage accounts or manually input holdings to get a consolidated view of their investments, track performance, and stay updated on news relevant to their specific stocks. For a quick market pulse check or initial research on a company, Yahoo Finance is often the fastest and most straightforward option.
- Best For: All levels of investors needing a free, all-in-one source for daily market news, quotes, and basic portfolio tracking.
- Pricing: The core service is completely free. Yahoo Finance Plus offers more advanced features starting at around $25 per month.
- Pros: Free access to a vast amount of data, highly user-friendly interface, comprehensive coverage of financial markets.
- Cons: Limited advanced analysis tools compared to paid platforms; advertisements on the free version can be intrusive.
Official Website: https://finance.yahoo.com/
8. Zacks Investment Research
Zacks Investment Research has carved out a niche among stock market research tools by focusing intently on one of the most powerful catalysts for stock price movement: earnings estimate revisions. Its entire philosophy is built around the idea that earnings, and analysts' expectations of them, are the primary drivers of stock performance. The platform's proprietary Zacks Rank system, which grades stocks from #1 (Strong Buy) to #5 (Strong Sell), is a quantitative model that has delivered impressive, independently audited results over time. This sharp focus on earnings makes it an invaluable resource for investors who believe that corporate profitability is the ultimate measure of a company's success.
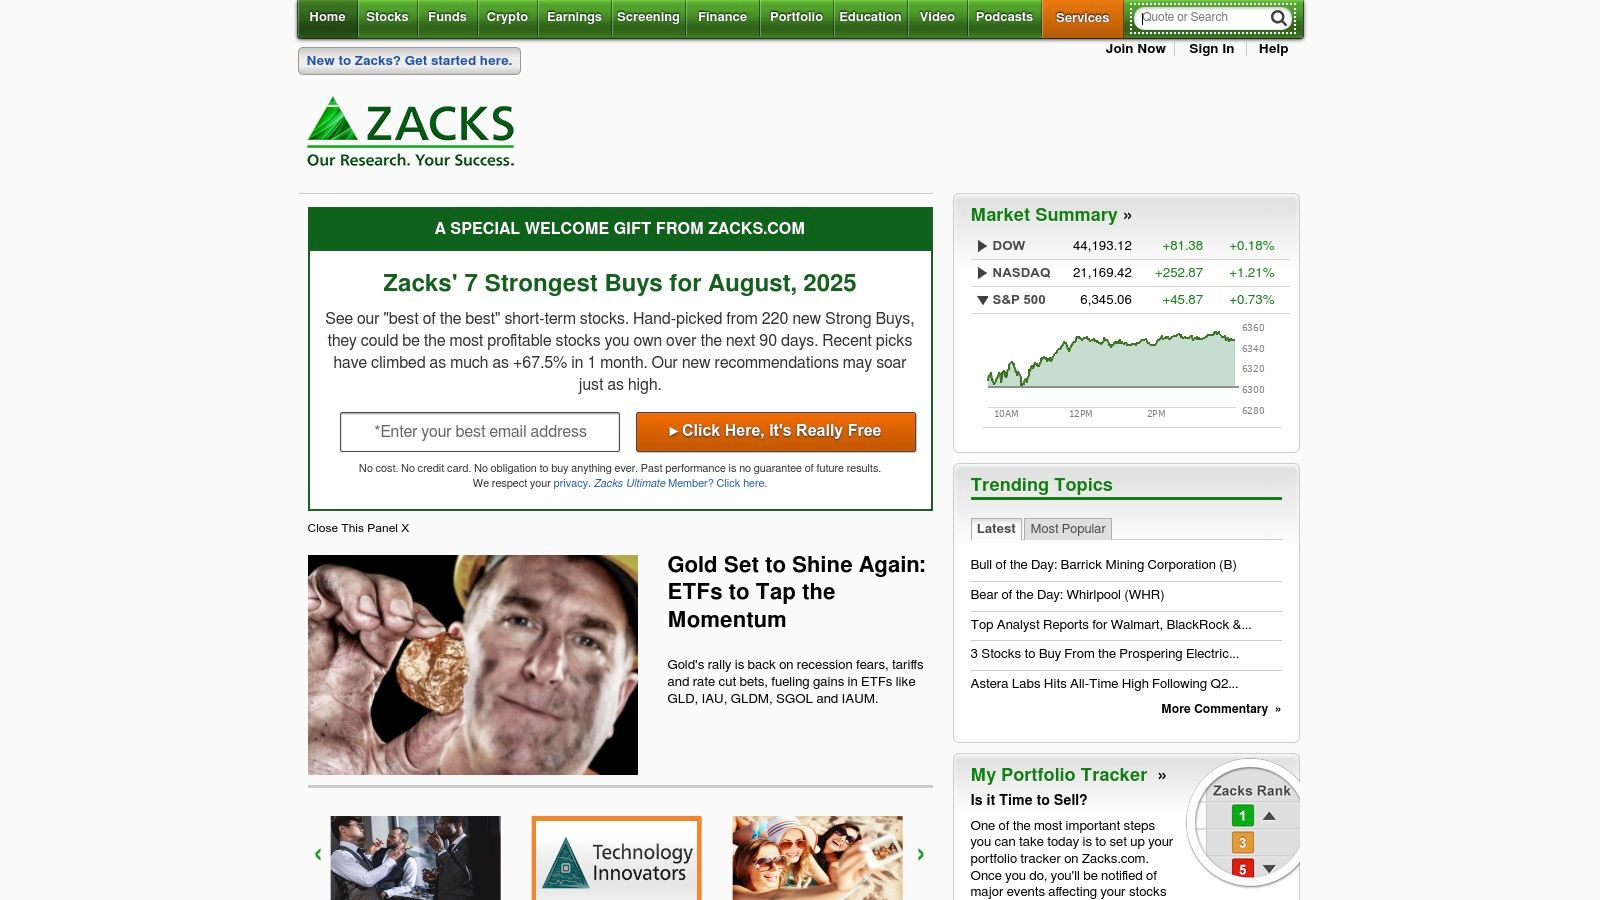
Key Features & Use Cases
The core of Zacks is its ranking system, which provides a straightforward, actionable signal for investors. A key use case is screening for stocks that have recently been upgraded to a Zacks Rank #1 or #2, as this often indicates positive momentum driven by analyst upgrades. The detailed research reports also provide deep dives into a company's earnings outlook, estimate revisions, and valuation, giving users the context behind the rank.
- Best For: Growth and momentum investors who prioritize earnings trends and analyst sentiment.
- Pricing: Limited data and ranks are free. Zacks Premium, which unlocks the full Zacks Rank list, focus lists, and research reports, starts at $249 per year.
- Pros: Strong focus on earnings-related metrics; comprehensive research reports; user-friendly screening tools.
- Cons: Premium features require a subscription; the user interface may feel somewhat dated to some users.
For a better understanding of the financial health metrics that complement earnings data, you can learn more about cash flow analysis on Investogy.com.
Official Website: https://www.zacks.com/
9. Benzinga Pro
For traders who believe that information is power, Benzinga Pro is one of the most critical stock market research tools available. It carves out its niche by focusing on speed, delivering real-time news, market-moving headlines, and actionable intelligence faster than most mainstream outlets. The platform is built for active traders who need to react instantly to catalysts like earnings reports, FDA approvals, or analyst rating changes. Its standout feature, the Audio Squawk, provides a live broadcast of key headlines and market analysis, allowing traders to stay informed without being glued to their screens.
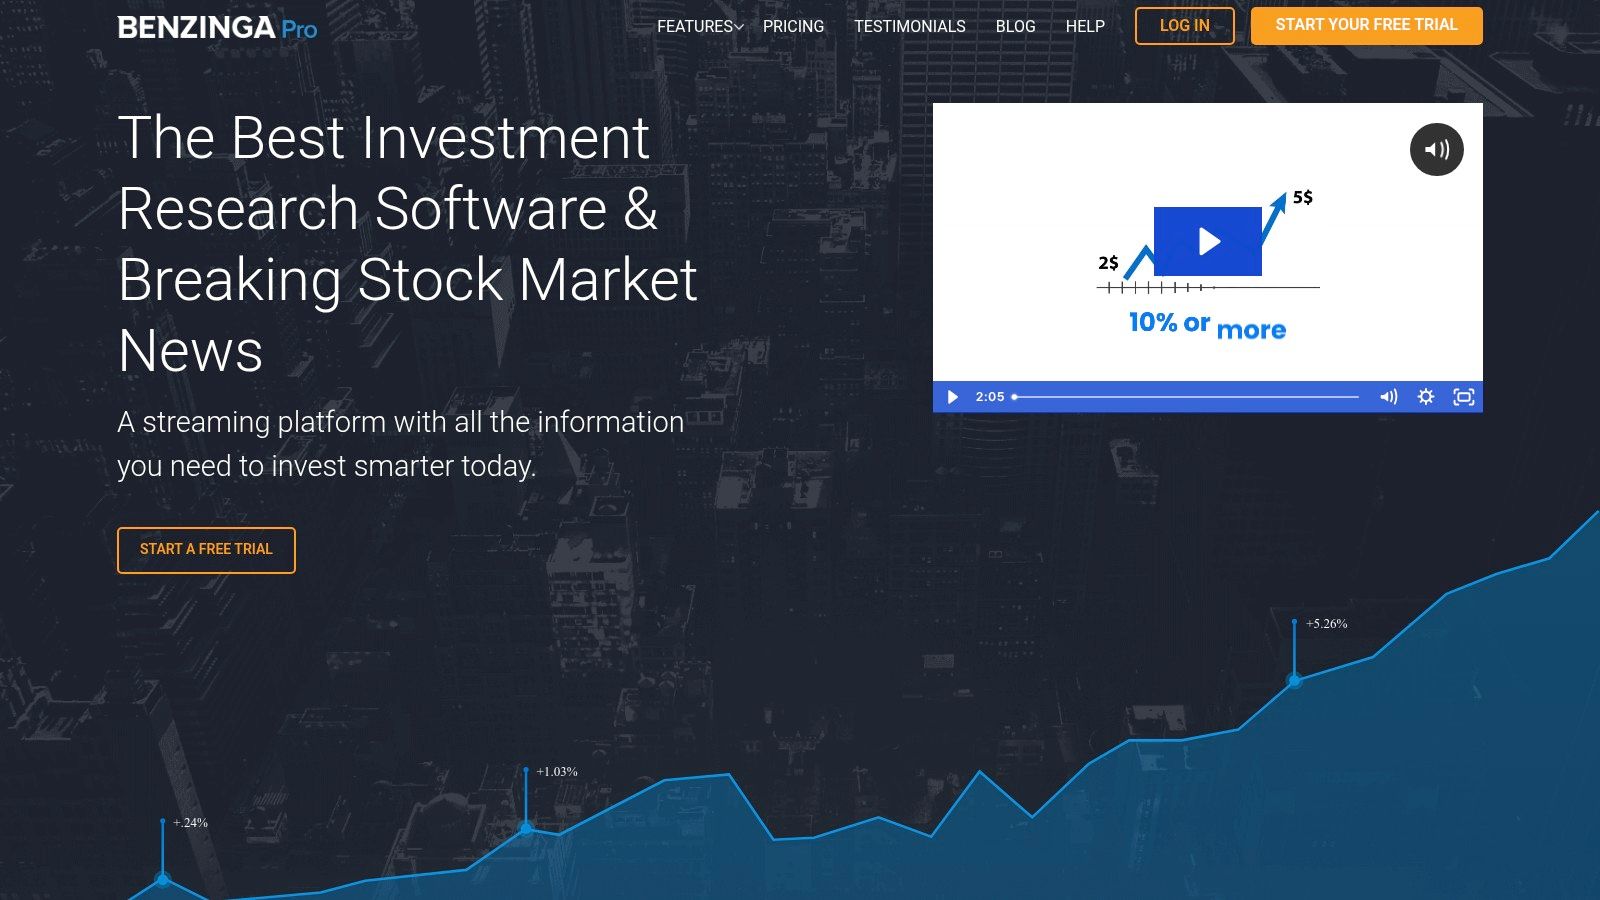
Key Features & Use Cases
The real-time scanners and signals are invaluable for day traders. You can set up alerts for unusual volume, price spikes, or block trades, helping you spot opportunities as they happen. The platform’s customizable newsfeed allows you to filter out noise and focus only on the sectors, stocks, or keywords that matter to your specific trading strategy, making it a highly efficient tool for monitoring the market.
- Best For: Day traders and short-term investors who rely on news and catalysts.
- Pricing: The Basic plan is free. Premium plans like Benzinga Pro Essential, which includes the newsfeed and alerts, start around $27 per month (billed annually).
- Pros: Extremely fast and reliable news delivery; user-friendly interface; excellent real-time scanners and alerts.
- Cons: Premium pricing can be high for casual investors; limited fundamental analysis tools compared to other platforms.
Official Website: https://pro.benzinga.com/
10. Finviz
Finviz has carved out a niche as a go-to platform for traders and investors who value speed and powerful data visualization. It excels at presenting a massive amount of financial information in an intuitive, glanceable format, making it one of the most efficient stock market research tools available. The platform's main appeal is its ability to help users quickly identify trading opportunities and gauge market sentiment through its iconic heat maps and a highly customizable stock screener. This visual-first approach allows for rapid analysis that might take significantly longer on more text-heavy platforms.
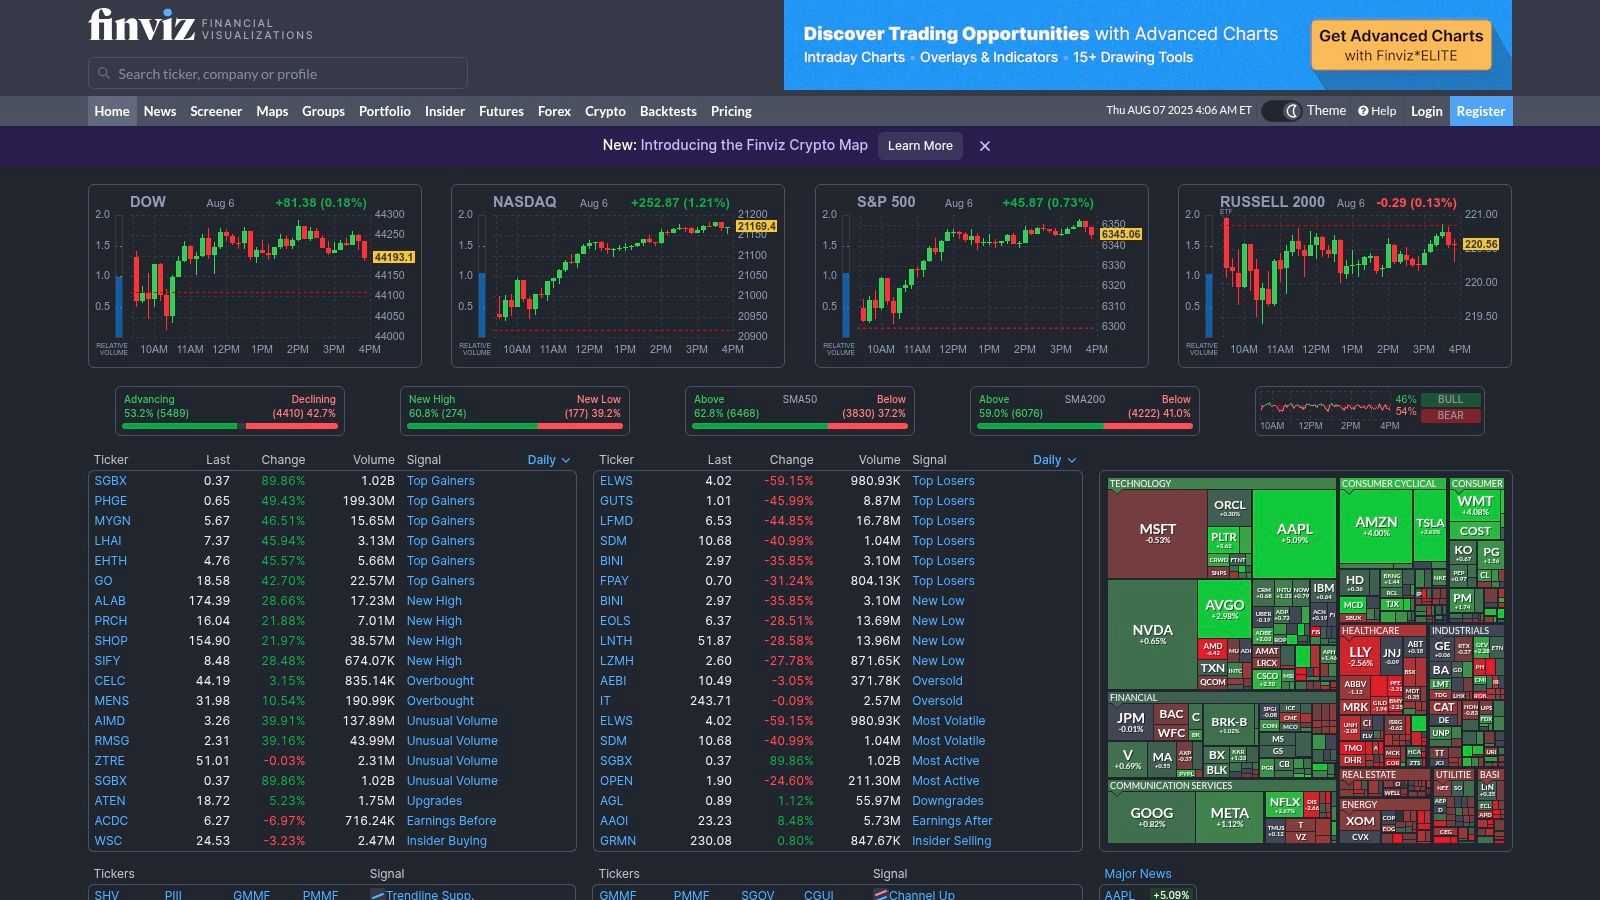
Key Features & Use Cases
The star of the show is the stock screener, which boasts over 70 descriptive, fundamental, and technical filters. A trader could, for example, screen for small-cap tech stocks with a P/E below 15, positive insider buying, and a recent "Golden Cross" chart pattern, all within seconds. The heat maps provide an instant overview of sector performance, highlighting the day's biggest winners and losers. This is invaluable for quickly understanding market dynamics at the start or end of a trading day.
- Best For: Active traders and swing traders who need to quickly scan the market and identify setups based on technical and fundamental criteria.
- Pricing: A robust free version is available with delayed data. Finviz Elite, which offers real-time data, advanced charting, and no ads, is priced at $39.50 per month or $299.50 per year.
- Pros: Powerful and extensive free screening capabilities; excellent market visualization tools; user-friendly interface.
- Cons: Data is delayed in the free version; advanced features and real-time quotes require a paid subscription.
Official Website: https://finviz.com/
11. Koyfin
Koyfin is often hailed as a more accessible and affordable alternative to the institutional-grade Bloomberg Terminal, making it one of the most powerful stock market research tools for serious retail investors. It excels at data visualization, allowing users to create sophisticated custom dashboards to track everything from individual stock performance to broad macroeconomic trends. The platform's strength lies in its ability to synthesize vast amounts of financial data into intuitive charts and graphs, enabling deep comparative analysis across different securities and asset classes.
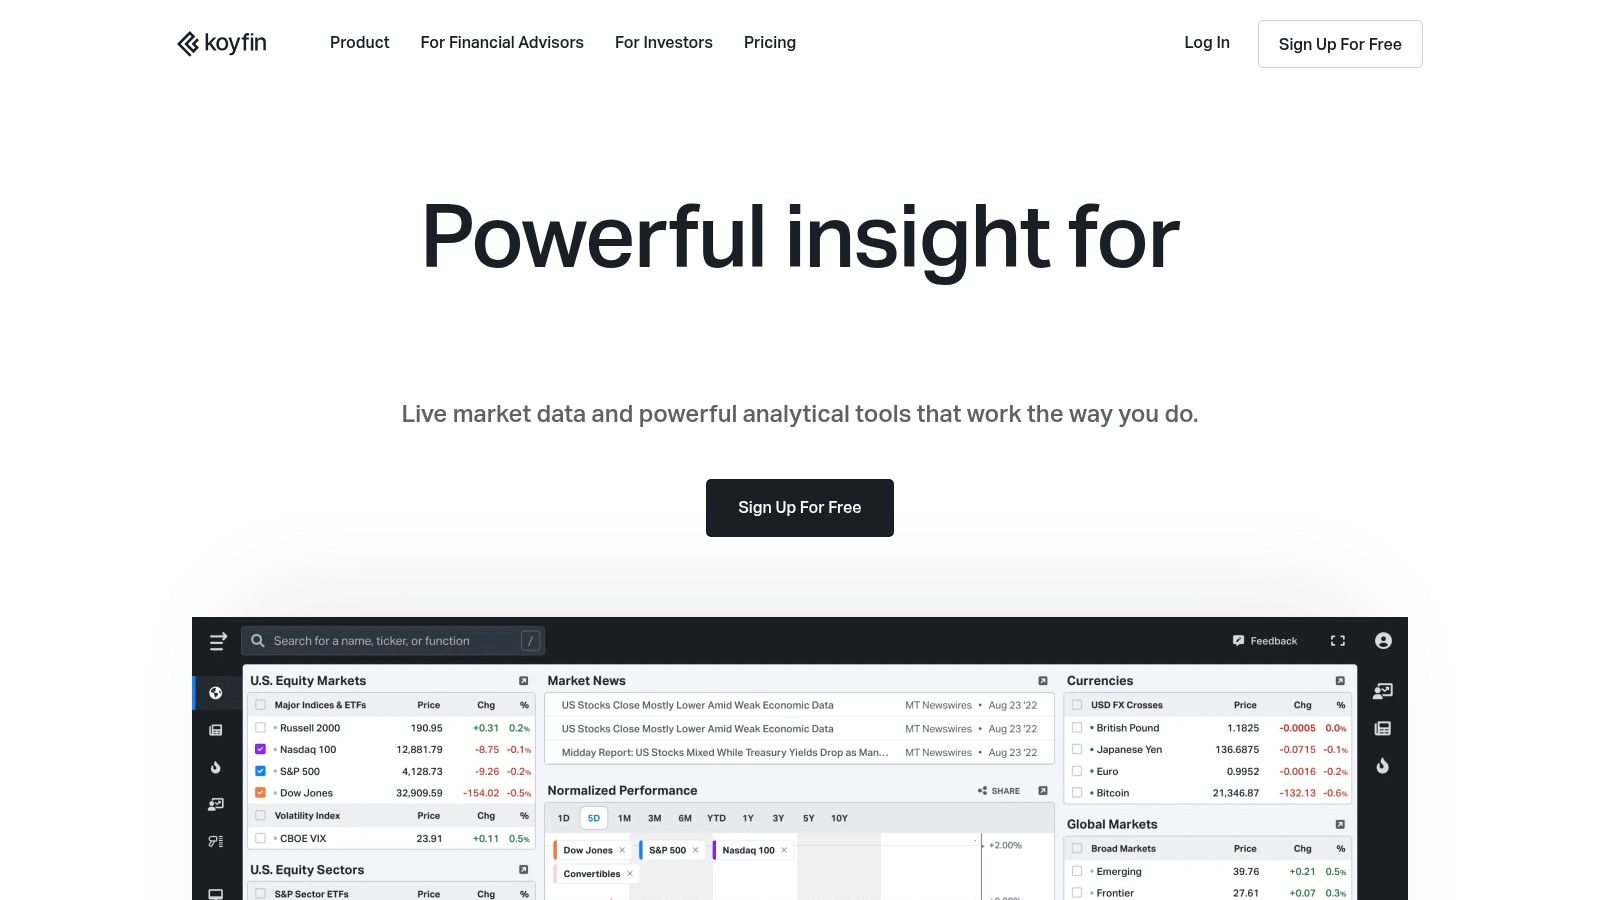
Key Features & Use Cases
Koyfin’s "My Dashboards" feature is a standout, providing unparalleled customization. You can build personalized screens that combine charts of financial statement data, valuation metrics, and economic indicators all in one view. This is perfect for investors who want to monitor specific relationships, such as how changes in Treasury yields affect the valuations of their favorite tech stocks, without having to switch between multiple platforms or tabs.
- Best For: Data-driven investors who need powerful charting and macro analysis capabilities.
- Pricing: A robust free version is available. Paid plans start at around $36 per month (billed annually), unlocking more data, features, and customization.
- Pros: Incredible data visualization tools, comprehensive financial and macro data, user-friendly interface for its power.
- Cons: The sheer volume of features can be overwhelming for beginners; the free version has limitations on real-time data.
Official Website: https://www.koyfin.com/
12. Investopedia
While not a traditional data-heavy platform, Investopedia has earned its place among essential stock market research tools by being the premier educational resource for investors of all levels. It excels at demystifying complex financial concepts, market dynamics, and investment strategies through an enormous library of articles, tutorials, and definitions. Before an investor can effectively use advanced analytics, they must first understand the fundamentals, and this is where Investopedia shines. It provides the foundational knowledge needed to interpret the data found on more specialized platforms.
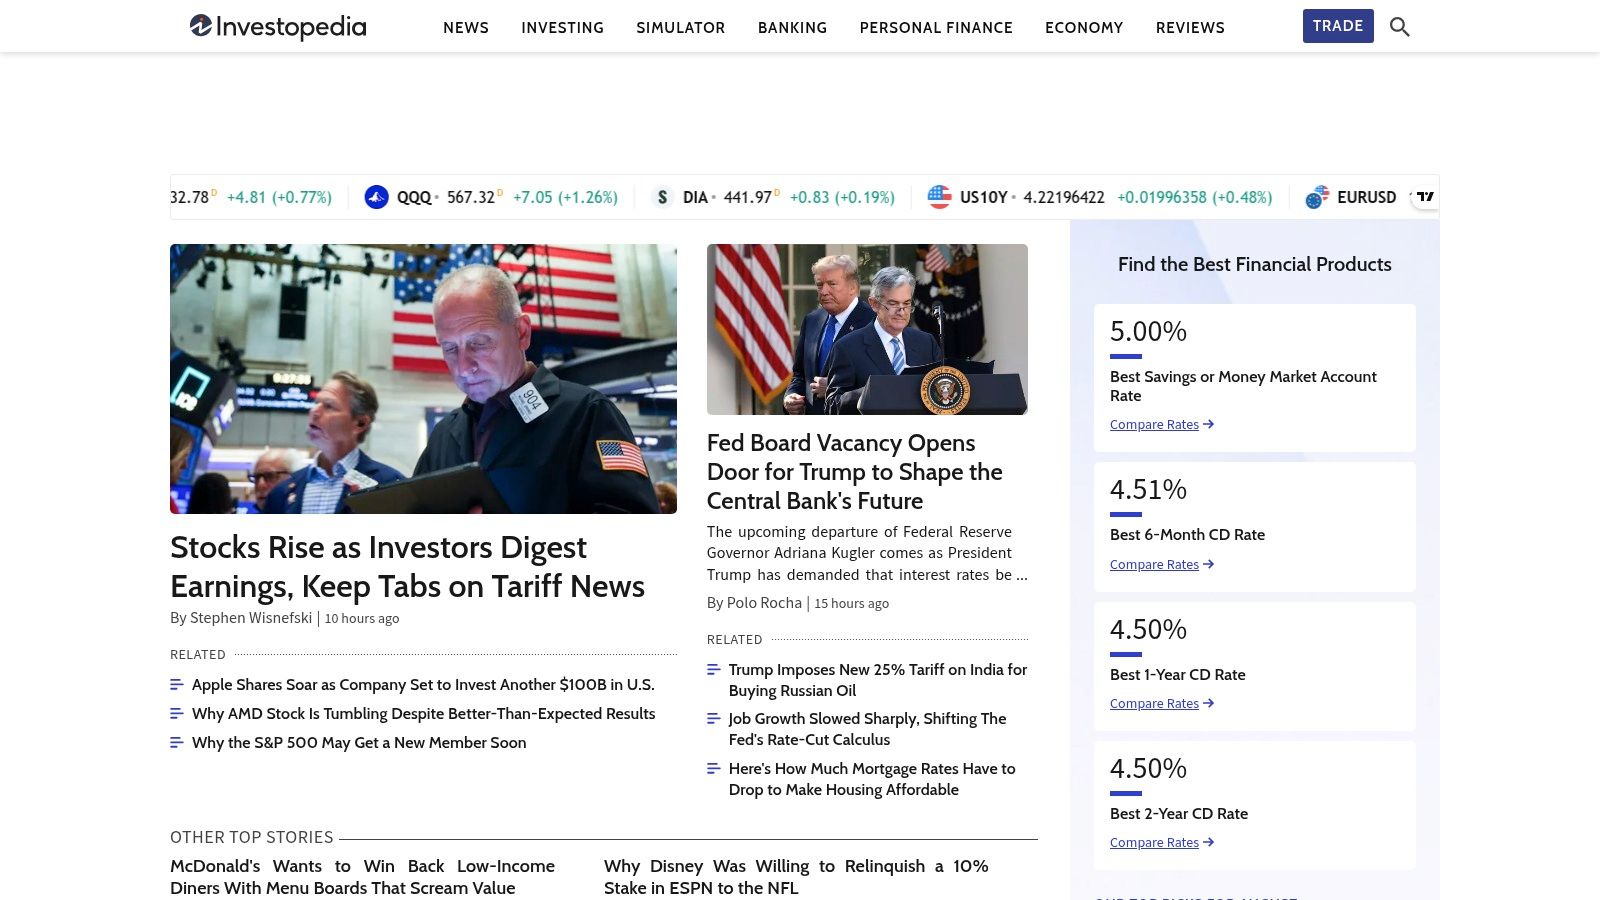
Key Features & Use Cases
A standout feature is the free stock simulator, which allows new investors to practice trading with virtual money in a real-world market environment. This risk-free practice is invaluable for building confidence and testing strategies before committing actual capital. The site’s clear explanations of financial ratios, economic indicators, and chart patterns make it a go-to reference for quick clarification while conducting research.
- Best For: Beginners and intermediate investors seeking to build a strong foundation of financial literacy.
- Pricing: Free to access all educational content and tools.
- Pros: Entirely free access to a wealth of high-quality information; user-friendly for all experience levels; excellent stock simulator for practice.
- Cons: Limited advanced research tools and real-time data; on-site advertisements can be distracting.
Official Website: https://www.investopedia.com/
Stock Market Research Tools Comparison
| Product | Core Features/Characteristics | User Experience & Quality ★ | Value & Price 💰 | Target Audience 👥 | Unique Selling Points ✨ |
|---|---|---|---|---|---|
| Investogy 🏆 | Free weekly newsletter; real-money portfolio transparency | ★★★★☆ Concise, focused 3-min read | 💰 Free | Data-driven dabblers & seasoned pros (USA) | Narrative-driven analysis; skin in the game |
| Morningstar | In-depth stock/fund analysis; portfolio X-Ray; screeners | ★★★★☆ Trusted, user-friendly | 💰 Freemium | Long-term investors | Independent research; comprehensive database |
| Seeking Alpha | Crowd-sourced articles; quant ratings; earnings transcripts | ★★★☆☆ Diverse but variable quality | 💰 Freemium | Broad retail investors | Large community insights; timely updates |
| Stock Rover | 700+ financial metrics; screening; portfolio tracking | ★★★★☆ Customizable, data-rich | 💰 Affordable tiers | Fundamental-focused investors | Deep fundamental analysis tools |
| TradingView | Interactive charts; social sharing; real-time data | ★★★★☆ Intuitive, active community | 💰 Freemium | Traders & technical analysts | Extensive indicator library; social features |
| TipRanks | Aggregated analyst/blogger ratings; insider data; Smart Score | ★★★★☆ Transparent analyst tracking | 💰 Freemium | Retail investors seeking expert opinions | AI-driven aggregated insights |
| Yahoo Finance | Real-time quotes; news; portfolio tools; interactive charts | ★★★☆☆ Accessible, broad coverage | 💰 Free | General retail investors | Free, wide-ranging financial data |
| Zacks Investment Research | Stock rankings; earnings estimates; research reports | ★★★★☆ Earnings-focused analysis | 💰 Freemium | Earnings-growth focused investors | Proprietary stock rankings |
| Benzinga Pro | Real-time news; Audio Squawk; scanners; watchlists | ★★★★☆ Fast, reliable news delivery | 💰 Premium pricing | Active traders | Real-time alerts; audio live updates |
| Finviz | Advanced screener; heat maps; news aggregation; technical tools | ★★★☆☆ Visualization-oriented | 💰 Freemium | Traders & visual analysts | Market heat maps; robust screening |
| Koyfin | Data visualization; dashboards; economic indicators | ★★★★☆ Powerful, affordable | 💰 Affordable | Data-driven investors | Bloomberg alternative; comparative analysis |
| Investopedia | Financial education; tutorials; calculators; stock simulator | ★★★☆☆ Educational, beginner-friendly | 💰 Free | Beginner to intermediate investors | Extensive educational resources |
Integrating Tools into a Cohesive Investment Strategy
Navigating the world of investing without the right support is like sailing a vast ocean without a compass. The comprehensive suite of stock market research tools we've explored, from the deep fundamental analysis of Stock Rover to the powerful charting capabilities of TradingView, serves as your essential navigation equipment. Each platform offers a unique lens through which to view the market, but the true power lies not in any single tool, but in how you combine them to build a personalized, robust research workflow.
The most common mistake investors make is tool-hopping without a plan, expecting the software to provide all the answers. A more effective approach is to first define your investment philosophy and process. Are you a long-term value investor, a growth-at-a-reasonable-price (GARP) enthusiast, or a short-term trader? Your answer will guide your selection.
Building Your Personal Research Stack
Think of these platforms as building blocks for your own custom research headquarters. Your goal is to create a "stack" that minimizes overlap and maximizes insight. Here are a few examples of how to combine tools from our list:
- For the Fundamental Value Investor: Combine the extensive screening and historical data from Stock Rover with the qualitative, long-form analysis found on Seeking Alpha. This pairing gives you both the quantitative "what" and the qualitative "why" behind an investment.
- For the Technical Trader: Your core could be TradingView for its best-in-class charting and community scripts. Augment this with Benzinga Pro for its real-time news squawk and alerts, allowing you to react swiftly to market-moving information.
- For the All-Around Retail Investor: A great starting point is pairing the free, high-level data from Yahoo Finance or Finviz with the expert ratings and analysis from TipRanks or Zacks. This creates a cost-effective yet powerful combination for initial research and idea validation.
From Information to Insight
Ultimately, the best stock market research tools are the ones that you use consistently and effectively. They should reduce complexity, not add to it. Start small. Pick one or two platforms that align with your immediate needs and dedicate time to mastering their features. Once you're comfortable, you can strategically add another tool to fill a specific gap in your process.
As technology continues to evolve, the capabilities of these platforms will only grow more sophisticated. For investors looking to integrate cutting-edge technologies, exploring how to use AI for financial analysis can provide a significant edge in processing complex data and identifying trends that human analysis might miss.
Your journey to becoming a more informed investor is a marathon, not a sprint. By thoughtfully selecting and integrating the right tools, you transform raw data into actionable intelligence, building the conviction needed to navigate market uncertainty and achieve your financial goals.
Ready to bridge the gap between complex financial data and clear investment stories? Investogy leverages narrative analysis to help you understand the "why" behind the numbers, making it the perfect complement to your quantitative stock market research tools. Discover how to build a stronger investment thesis by signing up for Investogy today.
Leave a Reply