Learning to read the price to earnings ratio is like getting a cheat sheet for a company's profitability. It’s a surprisingly simple yet powerful number that tells you exactly how many dollars investors are willing to pay for each dollar a company makes.
This one metric is your first reality check to see if a stock is a potential bargain or just dangerously overhyped.
What Is the P/E Ratio and Why Should You Care
Imagine you’re thinking about buying a local coffee shop. The shop consistently brings in a profit of $50,000 a year. The owner wants $500,000 for it.
What you're really doing is paying 10 times its annual earnings. That's it. You've just calculated its P/E ratio: 10. It works the exact same way for massive companies on the stock market, just with much bigger numbers.
The P/E ratio gives you a quick, standardized way to check the market's pulse on a company. A high P/E isn't automatically good; it suggests investors are betting on big growth ahead. A low P/E isn't always a steal, either—it could signal an overlooked gem or a business with serious problems under the hood.
Getting a handle on this metric is the first real step from just picking stocks to making truly informed investment decisions.
Decoding the Components
At its heart, the P/E ratio is just a mashup of two key pieces of data. If you don't understand where each number comes from, the final ratio is pretty much useless.
Let's break them down.
The Two Core Components of the P/E Ratio
A simple breakdown of the two inputs that create the Price to Earnings ratio and what each component signifies for an investor.
| Component | What It Represents | Where to Find It |
|---|---|---|
| Price (P) | This is the current market price for one share of the company's stock. It’s what someone is willing to pay for a tiny piece of the business right now. | You'll see this on any stock ticker or financial news site. |
| Earnings (E) | This is the company's Earnings Per Share (EPS). It’s the total profit divided by the total number of shares, telling you how much profit is attributed to each individual share. | This is a key figure in a company's quarterly or annual earnings reports. |
By slamming these two numbers together, you get a powerful snapshot of a company's valuation.
Once you have a solid grasp of what the P/E ratio is telling you, you can use various portfolio analysis tools to apply this knowledge across all your investments. Think of this simple ratio as your gateway to a much deeper understanding of a company's financial health and its place in the market.
How to Calculate the P/E Ratio With Real-World Numbers

Alright, let's roll up our sleeves and put the price-to-earnings ratio into practice. It’s refreshingly simple. While just about every financial platform will hand you the P/E on a silver platter, calculating it yourself is the best way to really get what it means for a company's valuation.
It all boils down to one simple formula.
P/E Ratio = Market Price per Share / Earnings per Share (EPS)
This little bit of division is powerful—it tells you exactly how much the market is willing to pay for each dollar of a company's profit. To get this right, you need to be comfortable finding the "Earnings Per Share" number, which means knowing how to read earnings reports where companies publish this key data.
Let's walk through the math with a couple of real-world scenarios. This will show you not just how it works, but why context is everything.
Example 1: The Established Consumer Brand
First up, let's picture a big, reliable company that sells stuff we all use, like household goods. We’ll call it "Global Goods Inc." This is a mature, stable business. No one is expecting it to grow at a blistering pace, but it's a steady earner.
Here are its vitals:
- Market Price per Share (P): $150
- Earnings per Share (EPS): $10
Now, we just plug those numbers into our formula:
- P/E Ratio = $150 / $10 = 15
A P/E of 15 means investors are currently paying $15 for every $1 of Global Goods Inc.'s annual profit. For a stable company in a mature industry, this is pretty standard. It suggests a reasonable valuation, without the kind of wild growth expectations that can inflate prices.
Example 2: The High-Growth Tech Company
Next, let’s look at a totally different beast: a fast-moving tech company, "InnovateTech." This company is famous for its groundbreaking software and is expanding like crazy. Investors are betting on huge profit growth in the future.
Here are its numbers:
- Market Price per Share (P): $300
- Earnings per Share (EPS): $6
Plugging these into the formula paints a very different picture:
- P/E Ratio = $300 / $6 = 50
A P/E of 50 is way up there, and it’s a clear signal of massive market optimism. Investors are willing to pay a hefty premium—$50 for every $1 of current earnings—because they're convinced InnovateTech’s profits are about to skyrocket, making today's high price look like a bargain down the road.
These two examples make it crystal clear: a P/E ratio isn't just a dry number; it's a story about market expectations. While it's one of the most popular metrics out there, it’s just one tool in a whole toolbox of stock valuation methods you can use. Comparing these two results shows you can't ever look at a P/E ratio in a vacuum.
What High and Low P/E Ratios Are Actually Telling You

A P/E ratio is just a number until you give it a story. This is where real investment analysis begins—digging into what that number says about the market's collective opinion of a stock.
A high or low P/E isn’t a simple buy or sell signal. Think of it as the start of a conversation. It's a prompt, pushing you to ask deeper questions about a company's future, its industry, and the economy as a whole.
Decoding a High P/E Ratio
When a company has a high P/E ratio, it simply means investors are willing to pay a premium price for every dollar of its earnings. This isn't automatically a bad thing; in fact, it’s a huge sign of high expectations.
Key Insight: A high P/E ratio often reflects powerful optimism about a company's future. Investors are betting its earnings will grow so quickly that today's high price will look like a bargain down the road.
You see this kind of optimism all the time in fast-moving sectors like technology or biotech, where a single innovation can lead to explosive profit growth. But a high P/E also comes with a lot of risk. If that rocket-ship growth doesn't happen, the stock can get hammered as its valuation crashes back to earth.
For this reason, a sky-high P/E can be a red flag for an overvalued stock, one that's fueled more by hype than solid fundamentals. Before you even think about investing, you have to do a deep dive into its business model and what makes it special.
Unpacking a Low P/E Ratio
On the flip side, a low P/E ratio means the market is taking a more conservative view of a company's earnings. Investors are paying less for each dollar of profit, and that can happen for a couple of key reasons.
A low P/E might be signaling a classic "value" stock—a solid, profitable company that the market has just overlooked for now. For investors who are willing to do their homework, these can be incredible opportunities to buy great businesses at a discount.
But a low P/E can also be a serious warning sign. The market might be pricing in some very real concerns:
- Slowing Growth: The company could be in a dying industry or losing ground to competitors.
- Hidden Problems: There might be skeletons in the closet, like massive debt, shaky management, or other operational headaches.
- Cyclical Slumps: Industries like manufacturing or energy often see their P/E ratios drop during economic downturns.
To get a better handle on how Wall Street views these valuations, it's worth learning how stock analyst ratings are put together, since they often lean heavily on metrics just like the P/E ratio.
The Power of Context and Comparison
A P/E ratio by itself is almost useless. To make it a powerful tool, you absolutely must compare it against the right benchmarks.
Here are the most important comparisons to make:
- Industry Average: A tech company with a P/E of 35 might be perfectly normal, but a utility company with that same ratio would be seen as absurdly expensive. You always have to compare a company's P/E to its direct rivals.
- Historical Performance: How does the company’s current P/E compare to its own five- or ten-year average? If a stock's P/E is way higher than its historical norm, it might be overvalued relative to its own past performance.
- Broad Market Average: Stacking a stock’s P/E against an index like the S&P 500 gives you a general feel for its valuation. For example, the S&P 500’s 10-year P/E ratio hit 34.3 as of March 2025, which is about 67.5% above its modern historical average of 20.5. This context helps you figure out if a stock's price is out of step with the wider market.
Just when you think you've got the price-to-earnings ratio all figured out, you discover it’s not just one metric—it's more like a family of them. To really get a handle on a company's valuation, you need to know which version you're looking at. Each one tells a slightly different story by looking at earnings from different angles: past, present, and future.
Getting comfortable with these variations is a game-changer for doing a proper analysis.
This infographic gives you a quick visual guide for how to think about P/E values in general.
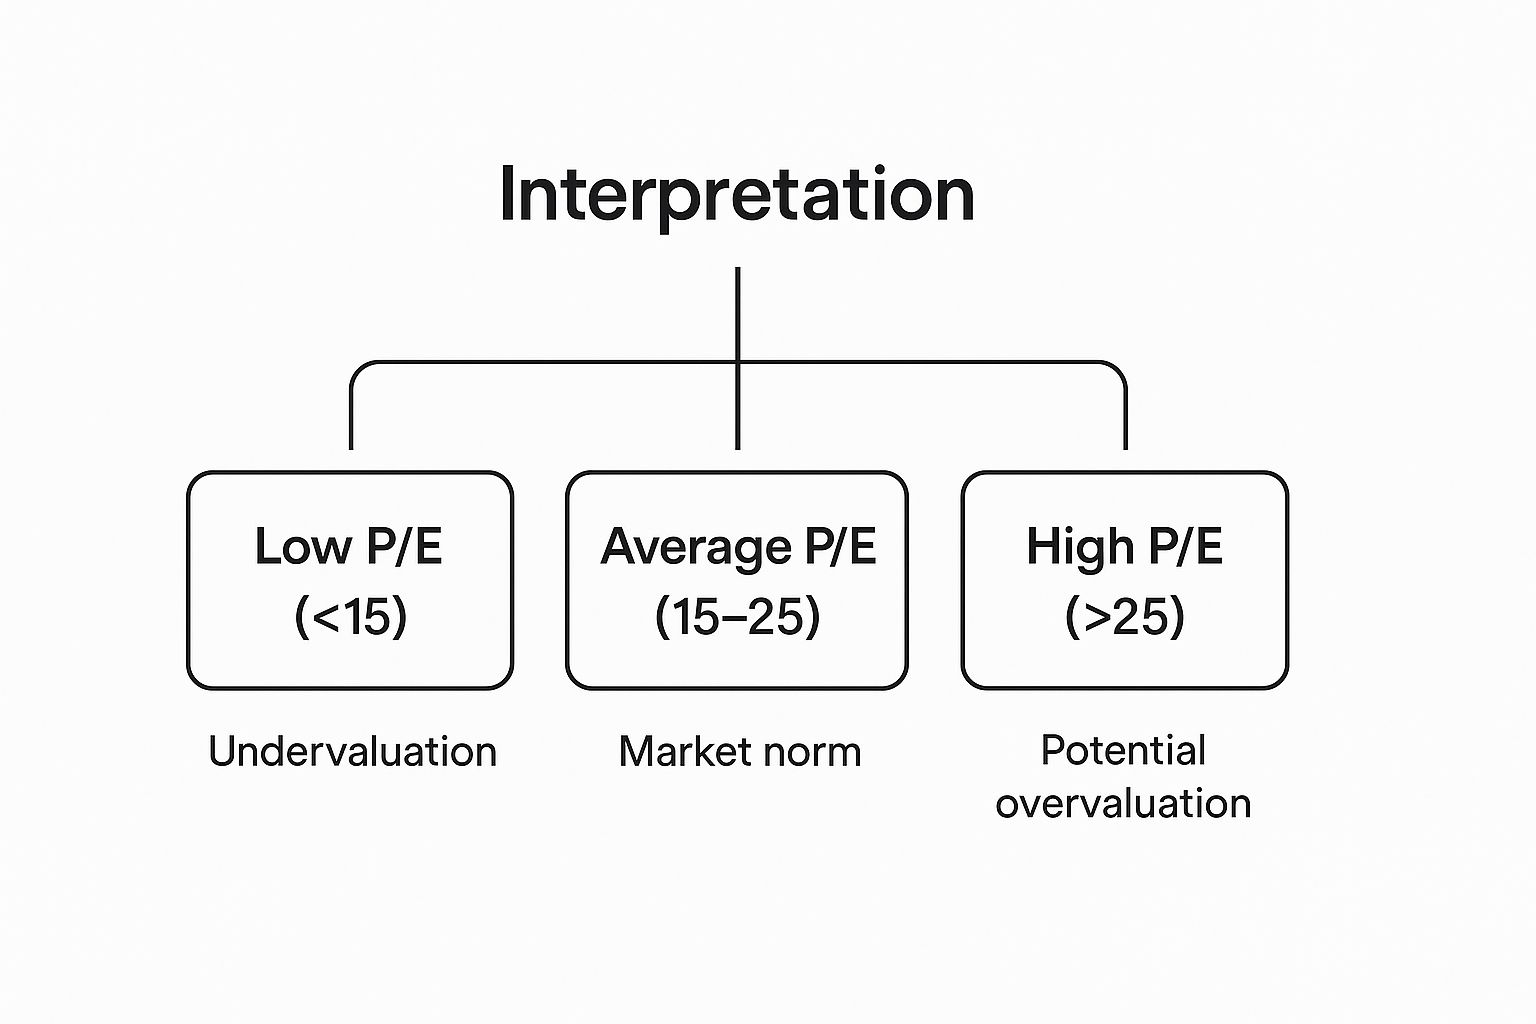
Think of it as a cheat sheet that sorts P/E ratios into low, average, and high buckets, offering a fast way to gauge if a stock might be undervalued or flying a little too close to the sun.
Trailing P/E: The Rearview Mirror
The most common version you’ll bump into is the Trailing P/E. You'll often see it written as P/E (TTM), which stands for "trailing twelve months." This is the classic formula we've been talking about, using a stock's current price divided by its actual, reported earnings per share over the last year.
Its biggest strength is that it's based on cold, hard facts. The numbers come from real, historical performance, not some analyst's guess. But that's also its main weakness—it's entirely backward-looking. A company's past success is no guarantee of future results, so a trailing P/E might not catch a big growth spurt or a painful downturn that's just around the corner.
Forward P/E: The Crystal Ball
The Forward P/E flips the script. It divides the current stock price by the estimated future earnings per share for the next year. These forecasts are put together by Wall Street analysts who are crunching numbers on industry trends, company guidance, and the overall economy.
Key Insight: The Forward P/E is the go-to metric for growth investors. It helps you value a company based on its expected potential, not just where it's been.
The obvious advantage here is its focus on the future, which is what investing is all about. The catch? It’s built on predictions, and predictions can be wrong. If those analyst estimates are too rosy, a stock that looked cheap on its forward P/E can suddenly seem way too expensive when reality hits.
Shiller P/E: The Long-Term Stabilizer
To smooth out the wild swings that can happen in the economy, economists came up with the Cyclically Adjusted Price-to-Earnings (CAPE) ratio, also known as the Shiller P/E. This is a pretty powerful tool. It compares the current price to the average inflation-adjusted earnings from the previous 10 years. This long-term view helps iron out the peaks and valleys of business cycles, giving you a much more stable picture of a company's valuation.
For example, during the 2008 financial crisis, corporate earnings cratered by nearly 90% in just one year. This sent the standard P/E ratio soaring above 120 even as stock prices were tanking. The CAPE ratio is designed to correct for these extreme, temporary situations. You can find more analysis on how CAPE provides a stable view of market valuation to see it in action. The main knock against it is that it can be slow to react to truly fundamental changes in an industry or a company's business model.
To put it all together, let's look at these different P/E ratios side-by-side. Each one has its place in an investor's toolkit, and knowing when to use which is key.
A Head-to-Head Comparison of P/E Ratio Types
| P/E Ratio Type | Earnings Basis | Primary Advantage | Key Limitation |
|---|---|---|---|
| Trailing P/E (TTM) | Last 12 months of actual, reported earnings | Based on real, historical data; reliable and easy to find. | Backward-looking; may not reflect future prospects. |
| Forward P/E | Next 12 months of estimated earnings | Forward-looking; focuses on a company's future potential. | Based on predictions that can be inaccurate or overly optimistic. |
| Shiller P/E (CAPE) | Average inflation-adjusted earnings over the last 10 years | Smooths out business cycles for a stable, long-term view. | Slow to react to fundamental business or industry changes. |
Ultimately, no single P/E ratio tells the whole story. By using them together, you can get a more well-rounded and nuanced view of a company's true value.
Common Blind Spots and Pitfalls of the P/E Ratio
While the price-to-earnings ratio is a fantastic starting point, relying on it alone is a classic—and costly—investor mistake. It’s a powerful tool for a quick valuation check, but it has significant blind spots that can lead you astray if you’re not careful. Think of it as one instrument on your dashboard, not the entire navigation system.
For a complete and reliable financial check-up, smart investors always pair the P/E ratio with other metrics.
It Ignores Debt and Accounting Tricks
One of the biggest pitfalls of the P/E ratio is that it tells you absolutely nothing about a company’s debt. A business could have a very attractive P/E ratio but be drowning in liabilities, making it a much riskier investment than the ratio suggests. Heavy debt can easily choke out future earnings.
On top of that, the "E" in P/E can be massaged. Creative accounting practices can temporarily inflate earnings per share, making a company’s valuation look much more appealing than it really is. This is why you must look beyond the P/E and scrutinize the balance sheet and cash flow statement.
Key Takeaway: A low P/E ratio is not always a bargain. It might be hiding a mountain of debt or accounting red flags that require a deeper investigation.
Another major blind spot is its complete uselessness for companies that aren't profitable. If a business has negative earnings—meaning, it’s losing money—the P/E ratio is undefined and tells you nothing. This is a common scenario for startups and high-growth companies reinvesting every dollar back into the business.
Comparing Apples to Oranges
One of the most critical mistakes an investor can make is comparing P/E ratios across completely different industries. A tech company and a utility company operate in fundamentally different worlds with vastly different growth prospects and capital needs. A P/E of 25 might be a steal for a fast-growing software firm but alarmingly expensive for a slow-growing utility.
To use the P/E ratio effectively, you have to compare apples to apples. Always check these two things:
- Against Direct Competitors: How does the company’s P/E stack up against others in its specific industry?
- Against its Own History: Is its current P/E ratio higher or lower than its five-year average? This tells you if it's cheap or expensive for itself.
Ultimately, understanding the price-to-earnings ratio is about using it as a screener to identify potentially interesting stocks. The real work begins after that, as you'll need to use other metrics to build a complete picture of the investment. This holistic approach is essential when learning how to build an investment portfolio that stands the test of time.
Common Questions About the Price to Earnings Ratio
Once you get the hang of the P/E ratio, a bunch of practical "what if" scenarios always seem to pop up. These are the real-world questions that come from trying to actually apply the metric. Let's walk through some of the most common ones I hear from investors.
What Does It Mean if a Company Has No P/E Ratio?
Ever look up a stock and see "N/A" where the P/E ratio should be? It almost always means one thing: the company has negative earnings. In plain English, it's losing money.
Because the "Earnings" part of the P/E formula is zero or negative, you simply can't calculate a meaningful ratio. This is super common with young, high-growth startups or companies trying to pull off a major turnaround. They're often pouring every dollar they have (and then some) back into the business to fuel growth.
What Is a Good P/E Ratio in Today's Market?
This is the million-dollar question, but the honest answer is pretty unsatisfying: there is no single "good" P/E ratio. A good P/E is all about context.
What looks "good" completely depends on a few things:
- The Industry: A P/E of 15 might be totally normal for a slow-and-steady utility company. But for a fast-growing tech firm, that same P/E would probably set off alarm bells.
- Growth Prospects: Companies that investors believe will grow their earnings rapidly in the future will almost always have higher P/E ratios. People are paying a premium today for tomorrow's expected growth.
- The Overall Market: When the market is in a full-blown bull run, everything gets more expensive, and average P/E ratios tend to climb across the board.
For example, taking a peek at the global market gives us some much-needed perspective. As of July 30, 2025, the all-world stock market benchmark had a P/E of 20.98, which is a bit higher than its five-year average. The U.S. market, on the other hand, was sitting at a loftier P/E of 25.75—well above its own historical norms. That suggests a pricier, more optimistic market environment. You can discover more insights about global market valuations on worldperatio.com.
The key is never to look at a P/E in a vacuum. You always, always have to compare it to its direct competitors, its own historical P/E range, and the average for the broader market.
How Often Should I Check a Company's P/E Ratio?
The stock price (the "P") bounces around every second the market is open, but the earnings (the "E") are only updated once a quarter. For anyone with a long-term mindset, getting worked up over daily P/E swings is just a waste of time and energy.
A much more sensible approach is to check in on the P/E ratio quarterly, right after the company releases its fresh earnings report. This gives you a much clearer picture of how the valuation is trending without getting lost in all the daily noise. Making this a regular part of your investment check-up is a huge step to master the investment decision-making process. It keeps you focused on the fundamentals, not the market's fleeting moods.
At Investogy, we cut through the noise by sharing the "why" behind every move in our real-money portfolio. Subscribe to our free weekly newsletter to see how we apply concepts like the P/E ratio to make confident, long-term investment decisions. Join us for free at https://investogy.com.
Leave a Reply