
At its heart, cash flow analysis is the process of examining how real money moves into and out of a business over a specific period. It's less about abstract accounting rules and more about the tangible, hard cash a company has to pay its bills, invest in growth, and reward its owners.
Think of it as the most honest story your company’s bank account can tell.
The Real Story Your Bank Account Tells

While profit and income statements are important, they don't always show the full picture. They can even be a bit misleading because they include non-cash items like depreciation and are shaped by various accounting methods.
Cash flow, on the other hand, is undeniable. It’s the lifeblood of any business, from a local coffee shop to a global corporation.
A business can be profitable on paper but still go under if it runs out of cash. This is the fundamental truth that makes cash flow analysis so critical for both managers and investors.
Getting a grip on this flow reveals a company's true operational health. It answers the questions that really matter:
- Can the business generate enough cash from its core operations to keep the lights on?
- Is the company putting its cash to work wisely to fuel future growth?
- How is the business funding itself—through debt, new investors, or its own earnings?
Why Cash Flow Matters More Than Ever
Effectively managing this flow isn't just good practice; it's a core survival skill. There's a reason the global market for cash flow management tools was valued at USD 3.53 billion in 2023 and is projected to skyrocket to over USD 15 billion by 2032.
This explosive growth, detailed in a report from Zion Market Research, underscores a growing awareness in the business world: poor cash management is one of the top reasons businesses fail.
Ultimately, performing a cash flow analysis takes you far beyond surface-level metrics. It gives you the clarity to see a company’s financial story for what it really is, pinpointing its strengths, weaknesses, and strategic direction.
Before we dive deeper, it helps to understand the three core activities that make up this analysis. This table gives you a quick snapshot of what we'll be exploring.
The Three Pillars of Cash Flow Analysis
| Activity Type | What It Reveals | Example |
|---|---|---|
| Operating | Cash generated from core business activities. | Sales revenue minus supplier costs. |
| Investing | Cash used for or gained from long-term assets. | Buying new equipment or property. |
| Financing | Cash exchanged with owners and lenders. | Issuing stock or repaying a loan. |
Think of these three pillars—Operating, Investing, and Financing—as the building blocks of a company's financial health. Understanding how they work together is the key to unlocking the full story behind the numbers.
Breaking Down the Cash Flow Statement
To really get your head around cash flow analysis, you need to understand that the statement of cash flows tells a story in three distinct parts. Each part reveals a completely different angle of a company's financial life.
I like to think of it like being a detective. Each section of the report is a clue, and you can only solve the mystery of a company's true health by looking at all three together. These three pillars are cash flow from operations, investing, and financing.
The infographic below lays out how these three activities flow from the core concept of cash flow.
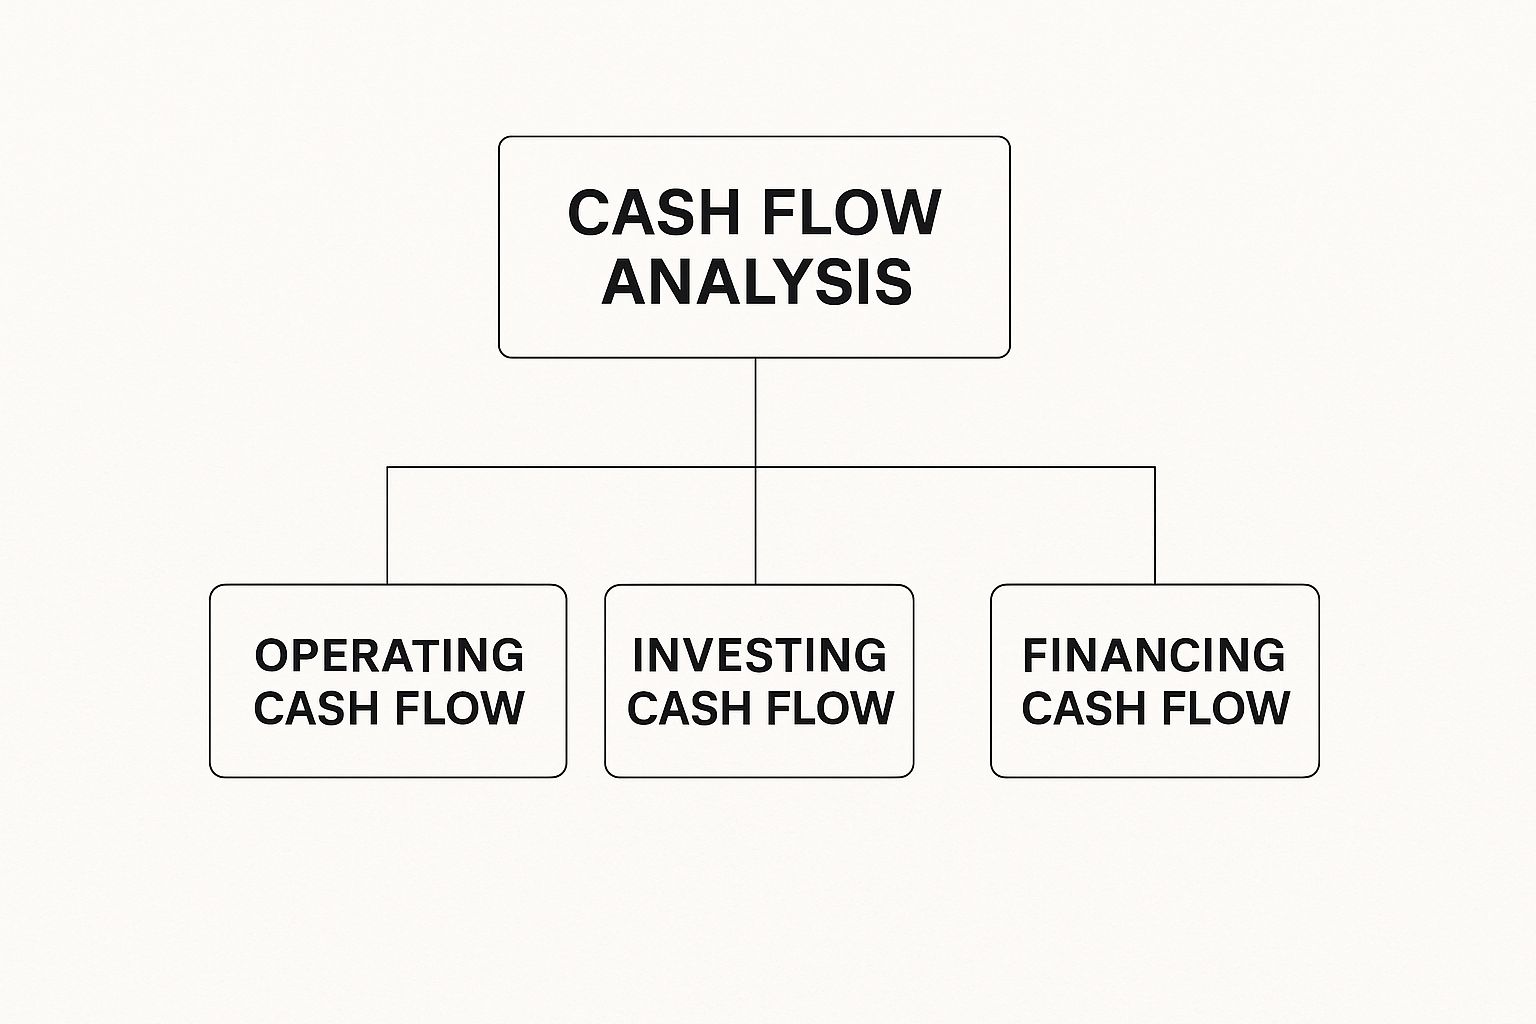
This structure makes it pretty clear that a solid analysis means digging into each of these separate, but deeply connected, financial streams.
Cash Flow from Operations (CFO)
This is the engine room of the business. Cash Flow from Operations (CFO) is all the cash a company generates from its main, day-to-day business. It’s the money rolling in from customers and the money going out to pay for things like inventory, salaries, and rent.
A consistently positive CFO is a huge sign of financial strength. It shows the core business is self-sufficient and can churn out enough cash to keep the lights on and grow without constantly needing outside money.
For instance, when a software company collects subscription fees, that’s an operating cash inflow. When it cuts checks for its developers' salaries, that’s an operating cash outflow. Simple as that.
Cash Flow from Investing (CFI)
Next up, we look at the company's long-term game plan. Cash Flow from Investing (CFI) tracks cash spent on or brought in from investments in assets. This isn't about the daily grind; it's about the big strategic moves designed to fuel future growth.
This category covers things like:
- Purchasing assets: Buying new machinery, property, or technology. This is a cash outflow, often called capital expenditure (CapEx).
- Selling assets: Getting rid of old equipment or real estate, which brings cash in.
- Acquisitions: Buying another company, which is a major cash outflow.
Here's a twist: a negative CFI is often a great sign for a healthy company. It means the business is plowing its earnings back into itself to get bigger and better—a classic move for a growth-focused company.
Key Insight: The relationship between CFO and CFI tells a powerful story. A company with a strong positive CFO and a big negative CFI is often a healthy, growing business that’s funding its own expansion.
Cash Flow from Financing (CFF)
Finally, Cash Flow from Financing (CFF) shows how a company raises money and pays it back to shareholders and lenders. This section is all about the movement of cash between a company, its owners, and its creditors.
Common financing activities include:
- Issuing stock: Bringing in cash from new investors.
- Repurchasing stock: Using cash to buy back its own shares from the market.
- Taking out loans: Getting cash from a bank or other lender.
- Repaying debt: Making loan payments, which is a cash outflow.
- Paying dividends: Distributing cash to shareholders as a return on their investment.
Looking at these three components together is the only way to get the full picture. This detailed view is the bedrock of more advanced analysis and a cornerstone of many different stock valuation methods that smart investors rely on.
Choosing Your Calculation Method: Direct vs. Indirect
When you start digging into a cash flow analysis, one of the first things you'll tackle is calculating cash flow from operations (CFO). To get to that number, analysts use two different but equally valid paths: the Direct Method and the Indirect Method. Both roads lead to the same destination—the net cash from operating activities—but they tell the story in very different ways.
Think of it like figuring out your total travel time on a road trip. The Direct Method is like keeping a detailed log of every minute spent driving, stopping for gas, and grabbing food. The Indirect Method is more like starting with the GPS’s estimated travel time and then adding or subtracting the time you spent on unscheduled stops. Both get you the correct total, but they offer completely different perspectives on the journey.
The Straightforward Direct Method
The Direct Method is about as intuitive as it gets. It creates a simple, straightforward ledger of all the actual cash that came into and went out of the business from its day-to-day operations. You’re essentially listing all cash receipts from customers and then subtracting all the cash paid out to suppliers, employees, and for other operating expenses.
It answers the question, "Where did the cash come from, and where did it go?" in the clearest way possible. You see the actual cash changing hands. For example, a direct calculation would look something like this:
- Cash received from customers
- Minus Cash paid to suppliers
- Minus Cash paid for salaries and wages
- Minus Cash paid for taxes
The result is a granular, easy-to-understand breakdown of cash movements. But here's the catch: despite its simplicity, this method is almost never used by public companies. It requires tracking a ton of data that isn't always readily available from standard financial statements.
The Standard: The Indirect Method
The Indirect Method is the one you’ll see almost everywhere—in fact, it's the approach used by over 98% of public companies. Instead of tracking every single cash transaction, it starts with a familiar figure from the income statement: net income (or profit).
From there, it works backward to reconcile that net income figure to the actual cash flow. This means adding back non-cash expenses (like depreciation, which is an accounting expense but not a cash outlay) and adjusting for changes in working capital accounts (like accounts receivable and inventory).
The Indirect Method is so dominant because it builds a crucial bridge between the income statement and the cash flow statement. It shows investors why a company's reported profit is different from the actual cash it generated, offering deeper insight into its accounting practices and operational efficiency.
Because it links directly to the widely published income statement, this method is far more practical for outside analysts to use. This convenience has cemented its place as the undisputed industry standard.
A cash flow statement is much more than just a list of numbers—it’s the story of a company’s health, its strategy, and its real potential. Learning to read the different combinations of positive and negative flows is a powerful skill. It’s like a doctor learning to read a patient's chart to diagnose their condition.
This is where the rubber meets the road in cash flow analysis. The numbers from operations, investing, and financing come together to create distinct patterns. Spotting these patterns is the key to seeing past the surface-level data and understanding what's really going on inside a business.
Decoding the Financial Fingerprints of a Business
Think about a company's lifecycle. A brand-new, scrappy startup operates completely differently than a mature, established giant. It only makes sense that their cash flow statements would reflect these different stages, creating unique "financial fingerprints."
By learning to recognize these fingerprints, you can get a quick read on a company’s strategic position. We can break them down into a few common scenarios, and each one tells a different, but equally important, story.
- The Healthy Grower: This company has positive cash from operations (CFO) and negative cash from investing (CFI). This is often the gold standard for a healthy, expanding business. It shows the core business is profitable and generating cash, and management is confidently plowing that money back into new equipment, technology, or acquisitions to fuel even more growth.
- The Cash-Burning Startup: You'll see negative CFO and negative CFI here. This is classic for an early-stage company that isn't profitable yet but is spending heavily on assets to scale up. These companies absolutely depend on positive cash from financing (CFF) from investors to survive this cash-hungry phase.
- The Mature Giant: Look for strong positive CFO and often negative CFF. This profile usually belongs to a well-established company that generates more cash than it knows what to do with. Instead of massive reinvestment, it might be paying down debt or returning cash to shareholders through dividends and stock buybacks (both of which are CFF outflows). This signals stability and a focus on shareholder returns.
When you look at these combinations, you start to realize that cash flow analysis is less about accounting and more about strategic interpretation. You’re not just adding numbers; you’re piecing together a narrative about ambition, risk, and stability.
This interpretive skill is what separates casual observers from serious investors. It’s also why businesses are increasingly turning to better tools to get this analysis right.
Technology's Role in Modern Analysis
The need for spot-on interpretation has pushed companies to adopt more powerful tools. For a long time, North America has dominated the cash flow market, largely due to its early adoption of advanced tech like AI and data analytics. Between 2018 and 2023, the region saw a massive deployment of cash flow management software, which helped shift corporate finance from just looking backward to actively predicting the future.
You can discover more about the global market evolution and see how this technology is changing the game for everyone. The trend is clear: companies everywhere are realizing the importance of moving from simple reporting to an active, forward-looking financial strategy.
Of course, not every company fits neatly into one of those three boxes. Let's look at a few more nuanced scenarios you're likely to run into.
Interpreting More Complex Scenarios
Sometimes the story is a bit more complicated, and you have to dig a little deeper.
Scenario A: The Struggling Business
A company showing negative CFO but positive CFI could be in real trouble. This means it isn’t generating cash from its main business and is selling off assets (the positive investing flow) just to keep the lights on. This is a huge red flag that often signals a business in desperate need of a turnaround.
Scenario B: The Big Strategic Bet
What if a mature company suddenly shows a large negative CFI? This could signal a major strategic shift. Maybe they’re acquiring a competitor or making a massive investment in a new product line. This isn't necessarily bad, but it tells you the company is pivoting from a stable, maintenance phase to a new, aggressive growth phase.
Learning to read these signals is what allows you to move from being a passive observer to an informed analyst, one who can understand the real story behind the numbers.
How Technology Is Changing the Cash Flow Game

Cash flow analysis isn't about dusty ledgers and clunky spreadsheets anymore. The whole discipline has been turned on its head by technology, transforming it from a backward-looking chore into a powerful, forward-looking strategic weapon. What used to be a reactive exercise is now a proactive tool for shaping a company’s future.
Modern software is the engine driving this change. These platforms automate the mind-numbing work of collecting and reconciling data, which frees up managers to actually think about what the numbers mean. But the real game-changer is the layer of intelligence now being baked right in.
The Rise of Predictive Forecasting
This is where things get really interesting. Artificial intelligence (AI) and machine learning (ML) are taking cash flow analysis to a whole new level. Instead of just telling you what happened last quarter, these systems can now spit out scarily accurate cash flow forecasts. By chewing through historical data, market trends, and even macroeconomic signals, AI algorithms can predict future liquidity with incredible confidence.
This isn't just a "nice to have"—it's invaluable. It allows a business to:
- Spot cash shortfalls long before they become a crisis, giving them time to line up financing or cut back on spending.
- Identify upcoming cash surpluses and figure out the best way to deploy that capital for growth or new investments.
- Fine-tune payment and collection cycles to keep cash flowing smoothly and consistently through the business.
This technological leap is why the financial tech sector is exploding. The global cash flow market, which is all about these modern tools, was valued at USD 0.93 billion in 2024. It's projected to rocket to an incredible USD 7.39 billion by 2033. That’s a massive 25.9% compound annual growth rate, all fueled by businesses scrambling to get a competitive edge with AI, ML, and data analytics.
Smart business leaders aren't just looking in the rearview mirror anymore; they're using tech-driven insights to make better, data-backed decisions in real time.
Making Smarter Decisions When It Counts
This shift toward predictive analysis is especially critical when the economy gets rocky. During volatile times, the ability to accurately forecast your cash position becomes a core survival skill. It gives leaders the confidence to navigate unpredictable markets without flying blind.
When you have a clear picture of future cash flow, you can act decisively. For us as investors, understanding a company’s tech stack in this area gives us another layer of insight. It speaks volumes about their operational maturity and how resilient they'll be in a downturn. It’s a key factor to look at, especially if you’re trying to figure out how to invest during a recession and want to put your money behind companies built on a solid financial foundation.
Ultimately, technology has pushed cash flow analysis far beyond a simple accounting task. It’s now a cornerstone of modern strategic management.
Common Questions About Cash Flow Analysis
Once you start digging into cash flow analysis, a few questions always seem to pop up. It's a powerful way to look at a company, but some of the core ideas can feel a little slippery at first. Let's tackle the most common ones head-on.
My goal here is to cut through the jargon and give you straight answers. Once these concepts click, you'll be able to use cash flow analysis to make much smarter decisions, whether you're sizing up a stock or just trying to get your own finances in order.
Cash Flow Vs Profit What Is The Difference
This is the big one, and the answer gets right to the heart of why we even bother with cash flow analysis. Profit, or net income, is what a company reports on its income statement. It’s an accounting number, meaning it includes all sorts of non-cash items (like depreciation) and can be shaped by different accounting rules.
Cash flow, on the other hand, is the real, physical cash moving in and out of a company’s bank account. Think of it like this: a company can book a massive profit from a huge sale, but if the customer is paying on a 90-day invoice, there’s zero actual cash in the bank from that deal yet.
Profit is an opinion, but cash is a fact. A company can look incredibly profitable on paper and still go bankrupt because it ran out of cash to pay its bills. Cash flow tells you the truth about a company's ability to survive and grow.
Why Is Negative Cash Flow Not Always Bad
You have to look at the full picture here. While negative cash flow from operations is almost always a huge red flag, seeing a big negative number in the investing section can actually be a fantastic sign.
When you see a large cash outflow from investing activities, it often means the company is aggressively reinvesting in its future. This could be:
- Buying new factories or machinery to ramp up production.
- Acquiring a competitor to grab more market share.
- Pouring cash into R&D to create the next blockbuster product.
These aren't signs of weakness; they’re signs of confidence. A company is taking its hard-earned cash and putting it to work for future growth. Young, high-growth startups, for instance, are almost always deeply negative on investing cash flow because they're building the foundation for an empire.
Can This Analysis Apply To Personal Finances
Absolutely. In fact, it’s one of the best ways to get a real handle on your own financial health. Your personal finances have the exact same three parts as a major corporation's:
- Operating Cash Flow: This is your paycheck after taxes, minus all your regular living costs—rent, groceries, utilities, you name it. If this number is positive, you’re living within your means. Simple as that.
- Investing Cash Flow: This is all about buying or selling assets. Putting money into stocks or buying a rental property is a cash outflow. Selling those assets brings cash in.
- Financing Cash Flow: This tracks how you use debt. Taking out a mortgage or a car loan is a cash inflow. Making the monthly payments on those loans is a cash outflow.
Looking at your money this way is incredibly clarifying. It shows you exactly where your cash is going and helps you spot the leaks and opportunities.
What Is Free Cash Flow
Now we get to the metric that serious investors obsess over: Free Cash Flow (FCF). It’s a pretty simple calculation—you just take the company's cash from operations and subtract its capital expenditures (the money it has to spend just to maintain its current assets, like buildings and equipment).
FCF is the pot of gold at the end of the rainbow. It's the surplus cash a company generates after it has paid for everything it needs to run and maintain the business. This is the "free" money left over to actually create value for shareholders.
A company with strong FCF can pay down debt, buy back its own stock, or hand out juicy dividends. That's why FCF is such a pure measure of financial strength and a key piece of many investment strategies, especially for anyone interested in what is long-term investing.
Want to see how these concepts apply to a real-money portfolio? The Investogy newsletter breaks down our investment decisions, including deep dives into company cash flows, to show you the "why" behind every move. Subscribe for free at https://investogy.com.
Leave a Reply