If you've spent any time at all looking at investment returns, you've probably come across the term Compound Annual Growth Rate, or CAGR. On the surface, it sounds like more financial jargon, but it’s actually one of the most honest ways to look at how an investment has performed over time.
Think of it as the average annual growth rate, but with a crucial twist: it assumes you reinvested all your profits each year. This gives you a "smoothed out" number that tells you the steady, consistent rate your money would have needed to grow each year to get from its starting point to its final value.
What Compound Annual Growth Rate Really Means
Let's use an analogy. Imagine you planted a small sapling. Over five years, it grew into a respectable tree. But its growth wasn't a perfect, straight line. Some years, with plenty of rain, it shot up. Other years, during a dry spell, it barely grew at all.
If you wanted to describe its overall progress, just averaging the fast and slow years wouldn't tell the whole story. What you'd really want is a single, steady growth rate that explains how it got from a tiny sapling to its current height.
That steady rate is exactly what CAGR does for your investments.
Smoothing Out The Bumps
The market rarely moves in a straight line. We all know it has incredible highs and gut-wrenching lows. A simple average of your yearly returns can be wildly misleading because it completely ignores the effect of compounding and the real-world impact of all that volatility.
CAGR cuts right through that noise. It gives you a much more realistic picture by answering one simple question:
What constant, year-over-year return would I have needed to turn my initial investment into its final value over this specific period?
This makes it an incredibly powerful tool for comparing different investments on a level playing field. For example, a hot tech stock might have a wild ride—up 40% one year, down 10% the next. Meanwhile, a boring utility fund might just chug along at a steady 7% every year. CAGR lets you compare their true long-term performance, apples-to-apples.
To really get a handle on your financial picture, it helps to pair CAGR with a solid understanding of calculating overall portfolio returns accurately, which takes other factors into account. But by mastering this one metric, you're already moving beyond surface-level numbers and gaining a clearer view of how your money is actually working for you.
How To Calculate CAGR Step By Step
Ready to roll up your sleeves and crunch the numbers? At first glance, the Compound Annual Growth Rate formula might look a little intimidating, but it’s actually pretty simple once you see what’s under the hood. Its whole purpose is to give you that single, smoothed-out growth rate we’ve been talking about.
Here’s the core formula you’ll need:
CAGR = (Ending Value / Beginning Value)^(1 / Number of Years) – 1
Let's quickly break down each piece so it’s crystal clear.
- Ending Value (EV): This is simply what your investment is worth at the end of the period you're measuring.
- Beginning Value (BV): This is what your investment was worth when you started.
- Number of Years (N): This is just the total time, in years, that you’re looking at.
This handy visual shows how those three inputs come together to give you the final CAGR number.
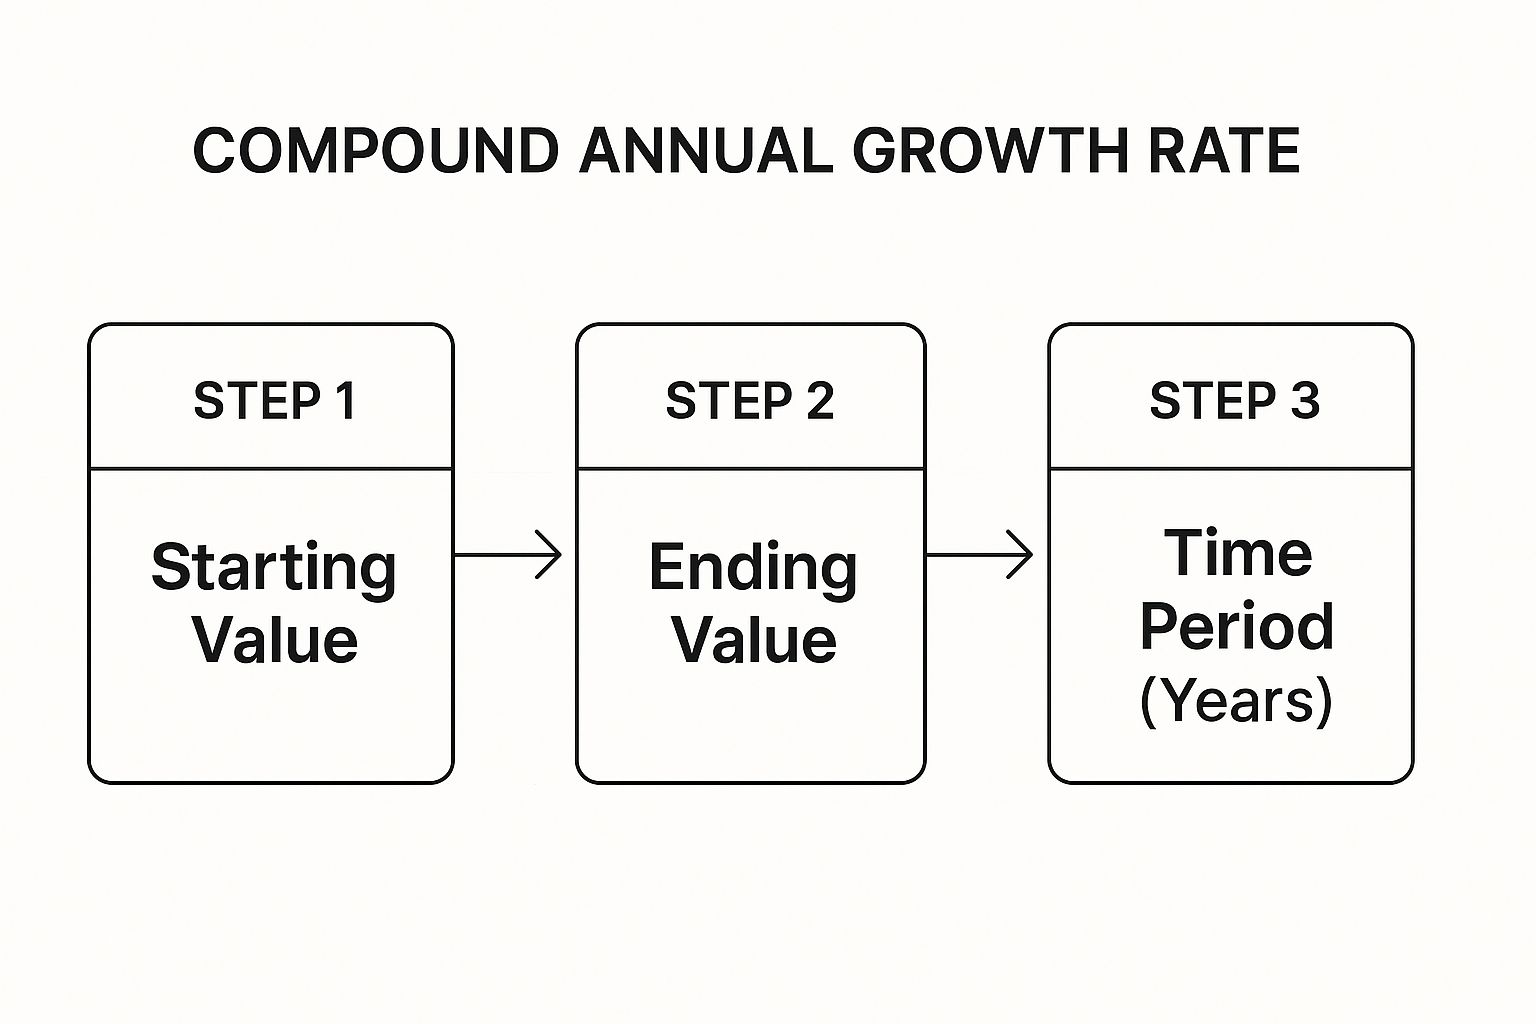
As you can see, you only need three key pieces of information. That’s it. With just those, you can figure out the smoothed annual growth for pretty much any investment over any time frame.
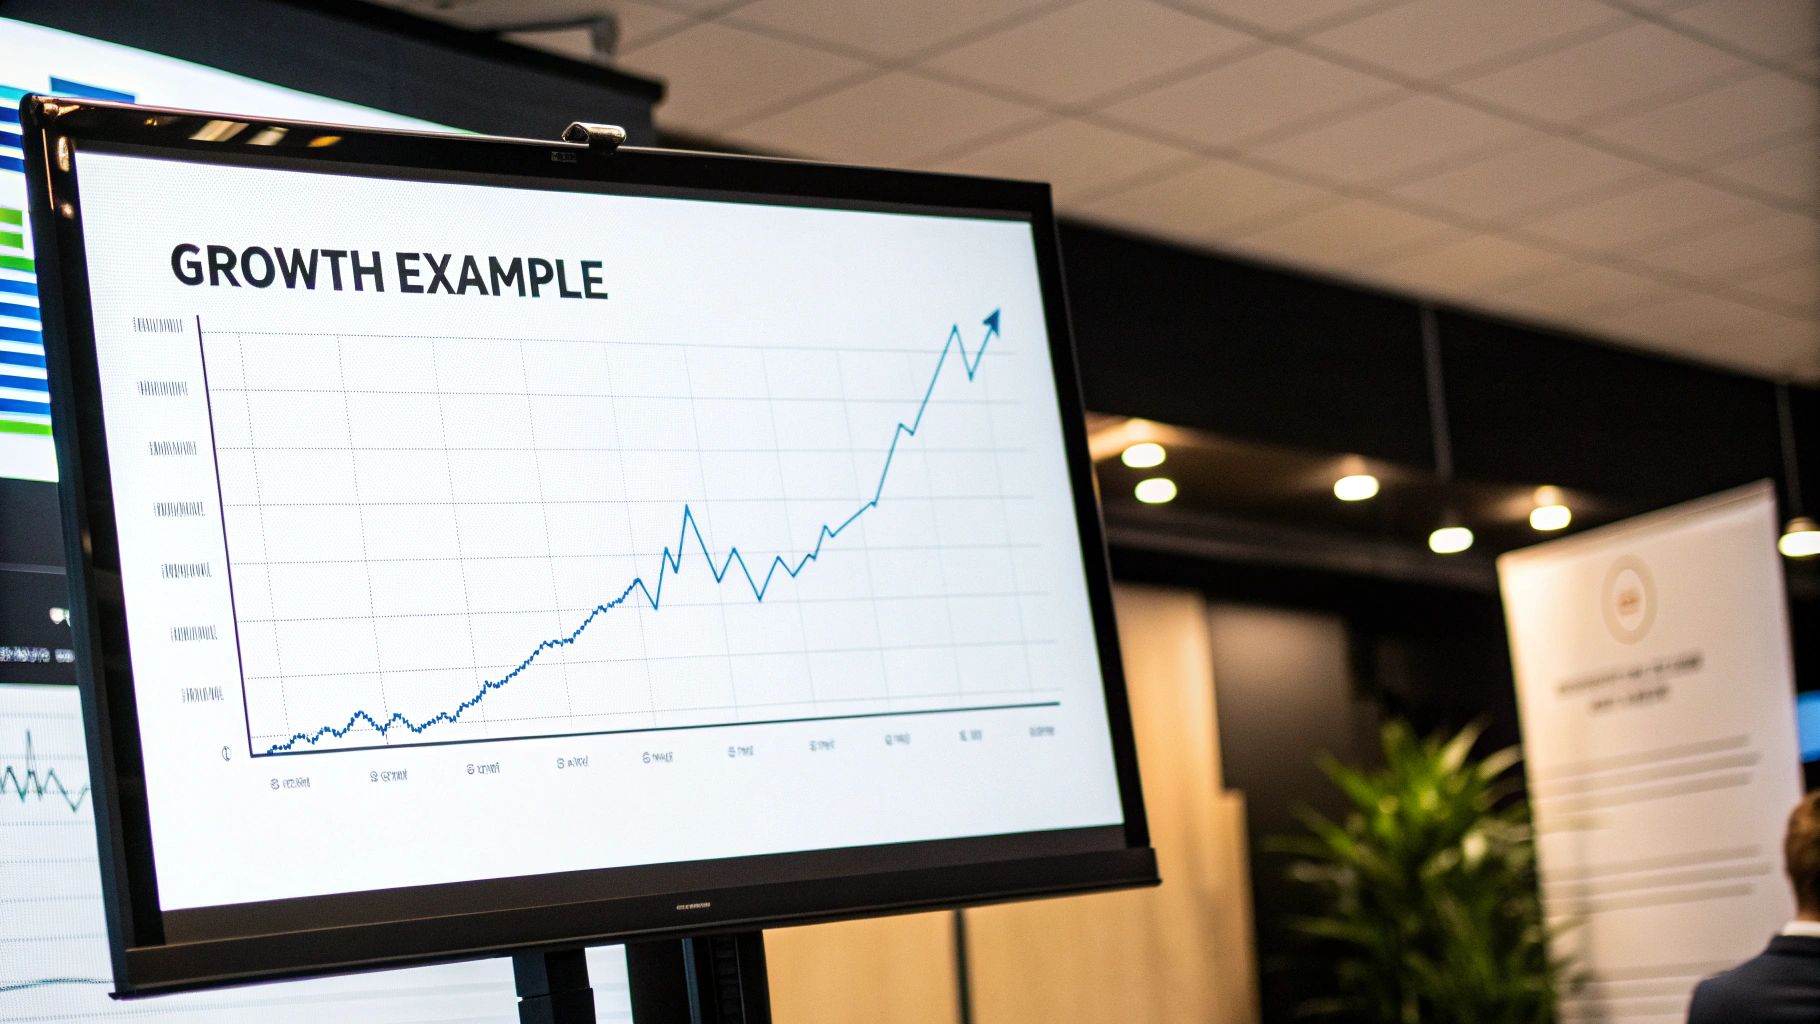
A Practical Calculation Example
Let's walk through a real-world scenario. Imagine you put $10,000 into a stock a few years back. You check your portfolio today, and that investment has grown to $15,000 over three years.
So, what was your compound annual growth rate for that period?
-
Identify Your Variables:
- Beginning Value (BV) = $10,000
- Ending Value (EV) = $15,000
- Number of Years (N) = 3
-
Plug the Numbers into the Formula:
- CAGR = ($15,000 / $10,000)^(1 / 3) – 1
-
Solve the Equation Step by Step:
- First, divide the Ending Value by the Beginning Value: $15,000 / $10,000 = 1.5
- Next, figure out the exponent: 1 / 3 = 0.3333…
- Now, raise the result from the first step to the power of that exponent: 1.5 ^ 0.3333 = 1.1447
- Finally, subtract 1: 1.1447 – 1 = 0.1447
-
Convert to a Percentage:
- Just multiply that final number by 100: 0.1447 * 100 = 14.47%
Boom. Your investment had a Compound Annual Growth Rate of 14.47%. In simple terms, to get from $10,000 to $15,000 in three years, it behaved as if it grew by a steady 14.47% every single year. If you want to dig deeper into measuring performance, check out our guide on how to calculate stock returns.
Using Tools For Faster Calculations
Doing the math by hand is a great way to really get the concept, but let's be honest—for regular analysis, spreadsheets are your best friend.
In both Microsoft Excel and Google Sheets, you can use the RRI function to calculate CAGR instantly. It's literally built for this, designed to return the equivalent interest rate for an investment's growth.
And this metric isn't just for our stock portfolios; it's a fundamental tool for tracking economic health on a global scale. The same CAGR principle is used to measure and compare the growth of everything from a company's revenue to a country's entire economy. When you hear that India's GDP grew at 7.8%, China's at 5.2%, and the United States' at 2%, it's all based on this same concept of annualized growth.
To get an even better handle on similar metrics, it's worth understanding how to calculate APY. It offers a related perspective on compounded returns, especially when you're looking at savings or other interest-bearing accounts.
Why CAGR Is a Critical Tool for Investors

Knowing how to punch the numbers for Compound Annual Growth Rate is one thing. But understanding why it’s such a game-changer is what separates a casual market-watcher from a savvy, strategic investor.
CAGR isn't just another term to memorize. Think of it as a special lens that brings the often-blurry world of market performance into sharp focus.
Its main job? To act as a great equalizer. It gives you a clean, apples-to-apples way to compare totally different investments, no matter how wild their individual journeys have been. This is absolutely essential for anyone serious about building a solid portfolio.
Comparing Investment Performance
Let's say you're sizing up two different investments from the past five years.
- Investment A (Tech Stock): This one was a roller coaster. We're talking returns of +50%, -20%, +30%, -10%, and +25%.
- Investment B (Utility Fund): A much calmer ride, with steady returns of +8%, +9%, +7%, +10%, and +8%.
If you just looked at the simple average, the tech stock would seem like a rockstar. But that average completely hides the gut-wrenching volatility that came with it. CAGR cuts right through that noise. It boils everything down to a single, smooth growth rate for each investment.
Suddenly, you can see which one actually delivered better, more consistent growth over the whole five-year stretch. It helps you judge the final result, not just the chaotic ride to get there. This kind of clear-headed analysis is the bedrock of good long-term investing strategies, where slow and steady often smokes the flashy, short-term bets.
Cutting Through Market Volatility
Let's be real: the market almost never moves in a straight line. Daily headlines and price swings create a constant racket that can easily trick you into making emotional, knee-jerk decisions.
CAGR helps you zoom out and see the bigger picture. By smoothing out the peaks and valleys, it reveals the underlying growth trend of an asset.
This perspective is crucial for keeping your cool and sticking with your strategy. Instead of freaking out over one bad year, you can use CAGR to see if the long-term growth story is still on track.
For example, the pet health industry saw its CAGR jump to a whopping 10.9% between 2018 and 2022. That’s a huge leap from its old 5-7% rate, signaling a powerful underlying trend that would be easy to miss if you only focused on single-year bumps.
Setting Realistic Financial Goals
Finally, CAGR is a must-have tool for planning your future. No, it's not a crystal ball—it's based on past performance, not a guarantee of future returns. But it does give you a realistic baseline for what an asset or even the entire market might do over the long haul.
If you're mapping out your retirement, for instance, you can use the historical CAGR of a broad market index to project how your portfolio might grow. This turns abstract goals into concrete numbers. It helps you set achievable savings targets and build a financial plan that's grounded in reality, not just wishful thinking. You're empowered to make smarter choices for your financial future.
Seeing CAGR in the Real World
Look, the Compound Annual Growth Rate is way more than just some stuffy formula for Wall Street analysts. It’s a super versatile metric that gets used all over the place, in countless industries, to get a standardized look at growth.
Think of it as a universal translator for momentum. Whether you’re sizing up a hot new startup, a massive global industry, or even the economy of an entire country, CAGR gives you a straightforward way to see what's really going on. Its real power is in taking messy, fluctuating data and boiling it down to one single, easy-to-digest number.
That number helps business leaders, economists, and everyday investors like us make smart comparisons and feel confident in our decisions. From the boardroom to the Beltway, CAGR is the lens people use to see performance clearly.
Tracking Business Performance and User Growth
For any company trying to grow, keeping score is everything. Let's say a tech startup launches a new mobile app. They could use CAGR to measure how quickly their active user base grew over five years.
- Year 1: 50,000 users
- Year 5: 500,000 users
Plugging those numbers into the formula would spit out the steady, year-over-year growth rate it took to hit that tenfold increase. That one number helps the leadership team understand the true speed of adoption, set realistic goals for the future, and—crucially—show off their success to investors in a way that’s impossible to misunderstand. It answers the simple question: "Okay, but how fast are we really growing?"
And it's not just about users. Companies use the exact same logic for crucial metrics like revenue, profit, and market share. A 15% CAGR in revenue is a flashing sign of a healthy, expanding business.
Comparing Industries and Economic Trends
Zooming out from a single company, CAGR becomes an indispensable tool for looking at entire sectors of the economy. An analyst might use it to compare the growth of the renewable energy sector against the old-school fossil fuel industry over the last ten years.
Even if both industries had their share of ups and downs, their CAGRs would smooth out the volatility. You'd be left with a clear picture of their long-term growth paths, showing which one is truly expanding faster. This is where knowing what compound annual growth rate is becomes a secret weapon for spotting major economic shifts before everyone else does.
Historically, analysts have leaned on CAGR to track sector-specific growth. For instance, the total stock market's compounded annual growth rate averaged about 9.08%. But if you dig deeper, you see fascinating stories. Niche sectors like water utilities blew that away with a 14.78% CAGR, while traditional industries like publishing limped along at just 0.41%. That's not just a number; that's massive disruption in action.
These figures do more than just report the past; they signal huge shifts in technology, consumer habits, and where the smart money is heading next. You can dig into more detailed historical growth data and see these trends for yourself.
Evaluating Global and National Economies
On the biggest scale imaginable, economists use CAGR to get a handle on a country's Gross Domestic Product (GDP). Calculating the GDP's CAGR over a decade or two irons out the wrinkles from short-term recessions and boom cycles. What you're left with is a much clearer picture of a nation's long-term economic health and stability.
For instance, comparing the 20-year GDP CAGR of an emerging market with that of a developed nation can instantly show you the difference in economic firepower and growth potential.
So whether you’re sizing up a startup's user numbers, a major shift in industry dominance, or the economic pulse of an entire nation, CAGR is the tool that tells the real story behind the numbers.
Understanding the Limitations of CAGR
While CAGR is an incredibly powerful metric for investors, it’s absolutely essential to understand that it doesn't tell the whole story. Not even close.
Think of it like looking at a gorgeous photograph of a mountain range from a distance. The picture shows you the impressive scale and the final destination, but it completely hides the treacherous valleys and jagged peaks you’d have to cross to actually get there.
The greatest strength of CAGR—its ability to smooth out performance into a clean, easy-to-understand number—is also its biggest weakness. It presents a hypothetical, steady growth line from point A to point B, masking the real-world drama an investment might have gone through along the way.
It Ignores Volatility and Risk
An investment that delivers a 10% CAGR could have been a calm, steady climb or a stomach-churning roller coaster with huge swings up and down. To CAGR, those two very different journeys look exactly the same.
For example, two mutual funds could both post a 12% CAGR over five years.
- Fund A might have had annual returns of: +11%, +13%, +12%, +11%, and +13%.
- Fund B might have had returns of: +40%, -15%, +30%, -10%, and +15%.
The final number is identical, but the investor experience—and the inherent risk—is wildly different. One was a pleasant ride, the other was a white-knuckle affair.
CAGR tells you where you ended up, but it tells you nothing about the turbulence you faced during the flight. This is why you must pair it with other metrics to get a true sense of an asset's risk profile.
It Is a Backward-Looking Metric
This one is critical to remember: CAGR is strictly a historical measure. It tells you how an investment has performed, but it offers absolutely no guarantee of future results. Past performance is not an indicator of future returns, as they say.
A company with a stellar 20% revenue CAGR for the last five years is impressive, but they might be facing new competition or a shifting market that dramatically changes their trajectory tomorrow.
Relying solely on a great CAGR to predict what's next is like trying to drive forward while only looking in the rearview mirror. It’s useful for context, but it's a dangerous way to navigate the road ahead.
CAGR Doesn't Account for Cash Flows
The standard CAGR formula has another major blind spot: it only cares about the beginning and ending values of an investment. It completely ignores any money you might have added or taken out during the holding period.
- If you added more money to your investment halfway through, the final CAGR will look artificially high, inflated by your new cash rather than just the underlying performance.
- If you withdrew money, the final CAGR could look much lower than the investment actually performed.
Because of these limitations, savvy investors never, ever use CAGR in isolation. It’s a fantastic starting point for analysis and a great way to compare different investments on an apples-to-apples basis. But for a complete and honest assessment, you have to dig deeper. You need to combine it with other key metrics like standard deviation (to measure that roller-coaster volatility) and a real analysis of your actual cash flows.
Using CAGR for Business and Strategic Planning
CAGR is more than just a report card for your personal investments. In the business world, it's a genuine powerhouse for mapping out the future. Smart leaders don't just use it to see where they've been; they use it to decide where they're going, turning old data into a strategic roadmap for growth.
Companies are constantly looking at their own historical CAGR to get a realistic handle on future revenue. It helps them set sales targets that are ambitious but still grounded in reality, and it's the kind of hard data you need to justify spending big on a new project or expansion.
Think about a software company that's seen 15% revenue CAGR for the past three years. They can use that number to project where they'll be in another three, which helps them decide when it’s the right time to hire more developers or push into a new market. It takes the guesswork out of some of their biggest decisions.
Forecasting Market Opportunities
This is where CAGR really starts to shine—when you apply it to an entire industry. By getting a read on an industry's overall growth rate, a company can figure out just how big the opportunity is and where to point its most valuable resources: time, money, and people.
A business can use its industry's CAGR to:
- Set Realistic Sales Targets: If the whole market is growing at 5%, aiming for 50% growth yourself might be a bit of a stretch. Aligning your goals with the market keeps you grounded.
- Assess Market Attractiveness: Seeing a high CAGR in a niche market is often a flashing green light, signaling a prime opportunity to jump in or double down on your investment.
- Manage Risk: On the flip side, a declining industry CAGR can be a wake-up call. It might be time to diversify your offerings or pivot your strategy before you get left behind.
This forward-looking approach transforms CAGR from a simple calculation into a vital strategic tool. It’s an essential piece of the puzzle for any leader trying to build a resilient, forward-thinking company—much like a solid framework is needed when you build a diversified stock portfolio.
The global business environment relies heavily on CAGR for market forecasting. The worldwide business market, which generated US$2.71 billion in 2022, is projected to grow at a CAGR of 8.93% through 2029.
Projections like this, which bake in everything from GDP growth to shifting consumer habits, give individual businesses a clear benchmark to measure their own ambitions against. You can dig into more of this data on global market forecasts from Statista. By using CAGR this way, leaders can spot opportunities, get ahead of challenges, and drive real, sustainable growth in a world that never stops moving.
Answering Your Top CAGR Questions
Even once you get the hang of the Compound Annual Growth Rate, a few questions always seem to surface. Let's run through the most common ones so you can feel completely confident using this metric.
What's The Real Difference Between CAGR and ROI?
I like to think of it this way: CAGR tells you the speed of your investment's growth, while ROI measures the total distance it traveled.
- CAGR is your smoothed-out, year-over-year growth rate. It’s the perfect tool for putting two different investments side-by-side to see which one performed more consistently over the same multi-year stretch.
- ROI (Return on Investment) just gives you the total percentage gain or loss over your entire holding period, whether that was two years or twenty. It’s a simple, big-picture number.
For instance, seeing a 100% ROI over five years is great news. But knowing the CAGR was 14.87% tells you the steady annual pace it took to get you there, which is often a more useful piece of information.
Can CAGR Go Negative?
It absolutely can. A negative CAGR isn't some weird math error; it’s a straightforward sign that your investment lost value over the period you're measuring.
It simply shows you the consistent annual loss that would have been required for your investment to shrink from its starting value to its lower ending value. Nobody likes to see a negative number, but it’s an honest, unfiltered look at an asset that has performed poorly over time.
Why Not Just Use a Simple Average? It Seems Easier.
Using a simple average growth rate is one of the most common rookie mistakes, and it can be incredibly misleading. Why? Because it completely ignores the effects of compounding. A simple average just adds up each year's individual return and divides by the number of years.
CAGR, on the other hand, gives you the geometric mean. This is a much smarter way to look at returns because it accounts for how the value of your investment changes each year. Gains and losses in one year directly impact the starting base for the next, and CAGR is the only metric that properly captures that dynamic, giving you a far more accurate picture of an investment's true performance.
Ready to move beyond the numbers and see how these principles apply to a real-world portfolio? The Investogy newsletter offers a transparent look at how we manage our own money, sharing the research and strategy behind every move. Subscribe for free at Investogy.com to start building your investing conviction.
Leave a Reply