
Figuring out your stock returns involves measuring the percentage change from what you put in to what you got out, often factoring in dividends.The simplest way to do this is with the simple return formula, which just compares the end price to the start price. But for a real understanding of how your investments are doing over time, you'll want to dig a bit deeper.
Measuring Your Investment Performance

Before you start crunching numbers, it's important to know what you're actually trying to measure. At its core, a "return" is just the profit or loss you've made on an investment, usually shown as a percentage. Sounds simple, right?
But that simple idea gets complicated fast once you bring in variables like time, dividends, and market volatility.
Picking the right formula is key because each one tells a different story. A quick gain over a few weeks might feel great, but how does that compare to an investment you've held for five years? This is where different metrics come in, helping you see beyond the surface-level numbers and truly understand your performance.
The Key Metrics Every Investor Needs
To get a complete picture, you need to get familiar with three main ways to calculate returns. Each one has a specific job, whether you're looking at a short-term trade or a long-term position in your portfolio.
For a deeper dive into evaluating all your holdings together, our guide on how to perform a stock portfolio analysis is a great next step.
Here are the core metrics we'll be breaking down:
- Simple Return: This is your basic calculation, showing the total gain or loss over the entire time you held the stock. It's perfect for a quick snapshot of a single investment's journey from start to finish.
- Annualized Return: This metric takes your simple return and converts it into an annual figure. It's the only way to make fair, apples-to-apples comparisons between investments held for different lengths of time.
- Total Return: This is the big one. It doesn't just look at the stock's price going up; it also includes any dividends or other distributions you received. If you ignore dividends, you're missing a huge piece of the puzzle.
A day trader might live and die by simple returns, but a long-term value investor absolutely needs to focus on total and annualized returns to see if their strategy is actually working. They tell a much more complete story.
Accurate measurement is the foundation of good investing. For any of this to be useful, you have to follow established financial reporting best practices to keep your data clean and consistent.
This isn't just about being neat; it prevents you from drawing the wrong conclusions and helps you make smarter decisions with your money. In the next few sections, we'll get into the weeds with the specific formulas and walk through some real examples for each of these crucial calculations.
To make things even clearer, here’s a quick rundown of the key metrics we're about to cover.
Key Stock Return Metrics at a Glance
| Return Type | Best For | Key Formula Component |
|---|---|---|
| Simple Return | Quick, single-investment performance snapshot over any period. | (Final Price - Initial Price) / Initial Price |
| Annualized Return | Comparing investments held for different timeframes (e.g., 6 months vs. 3 years). | (1 + Simple Return) ^ (1 / Number of Years) - 1 |
| Total Return | Getting the complete picture, including price changes and all distributions. | (Final Price - Initial Price + Dividends) / Initial Price |
This table should serve as a handy reference as we move forward. Now, let's break down how to calculate each one, step by step.
Calculating Simple and Total Returns

Before you can know how well your portfolio is doing, you have to get comfortable with the basic math. The first stop for any investor is the simple return. It's the quickest, most straightforward way to see how much a stock's price has moved since you clicked "buy."
Think of it as the back-of-the-napkin calculation for a high-level view of your gain or loss.
The formula is as basic as it gets, boiling everything down to your entry price and the current (or exit) price.
Simple Return Formula: (Current Price - Purchase Price) / Purchase Price
Let’s put it into practice. Imagine you bought 10 shares of a well-known tech company at $150 per share. Your total initial investment was $1,500. A year goes by, and the stock is now trading at $180 per share.
Plugging those numbers into the formula, you get: ($180 - $150) / $150 = 0.20.
To turn that into a percentage, just multiply by 100. Your simple return on the stock is 20%. In other words, the stock's price has gone up by a fifth of what you originally paid for it. Simple enough.
Why Simple Return Is Only Half the Story
But here’s the catch: simple return has a massive blind spot. It completely ignores dividends. Many solid, established companies share their profits with you in the form of regular dividend payments. If you're not counting that cash, you're getting an incomplete—and often understated—picture of your investment's performance.
This is exactly why we need to talk about Total Return. It gives you the full story by combining both the capital gain (the price increase) and any dividend income you collected while you held the stock.
Factoring in Dividends for Total Return
The Total Return formula is just a small but crucial tweak on the one we just used.
Total Return Formula: (Current Price - Purchase Price + Dividends) / Purchase Price
Let's go back to our tech stock example. The price jumped from $150 to $180. But let's also say the company paid out an annual dividend of $3 per share. Since you own 10 shares, that's a cool $30 in your pocket.
Now, let's recalculate with this new information:
- Capital Gain:
$180 - $150 = $30per share. - Total Gain:
$30 (Capital Gain) + $3 (Dividend) = $33per share. - Total Return Calculation:
($33 / $150) = 0.22.
Your total return is actually 22%. That extra 2% came entirely from dividends. It might not sound like a huge deal, but over the long haul, the compounding effect of reinvested dividends is a powerhouse, often accounting for a huge chunk of the market's total gains.
Focusing only on price movement is a rookie mistake. You might ditch a stock with a 5% simple return, not realizing its 4% dividend yield made it a better performer than another stock with a 7% gain but no dividend. Total return gives you the clarity you need to make smarter decisions.
These fundamental principles aren't just for stocks. They apply to almost any investment you can make. For instance, you can calculate the ROI on rental property using a simple formula using very similar logic. Getting these core concepts down is essential whether you're looking at stocks, real estate, or anything in between.
This idea is also a key piece of a much broader financial metric. We break it all down in our complete guide on how to calculate return on investment.
How to Calculate Annualized Returns
Let's say you made a 20% gain on a stock you held for just six months. That sounds great. But how does it stack up against another investment you've held for three years?
It’s like comparing apples to oranges. A killer return over a short period might not look so hot when stretched out over a year, and vice-versa. This is exactly why we need to calculate annualized returns.
This metric is the great equalizer. It converts your investment performance into a standard one-year timeframe, giving you the only way to make a fair, direct comparison between different assets held for different amounts of time.
The Annualized Return Formula
To get started, you just need two things: the simple return (which we covered in the last section) and how long you held the investment, measured in years.
The formula can look a little intense at first glance, but it's pretty straightforward once you see what it's doing.
Annualized Return = [(1 + Simple Return) ^ (1 / Number of Years)] – 1
That ^ symbol just means "to the power of." This part of the formula is the secret sauce—it properly accounts for the effect of compounding over time. It's far more accurate than just crudely dividing the total return by the number of years you held the stock.
Before you can annualize a return, you need the basic components of the return itself. This is all about understanding the moving parts.
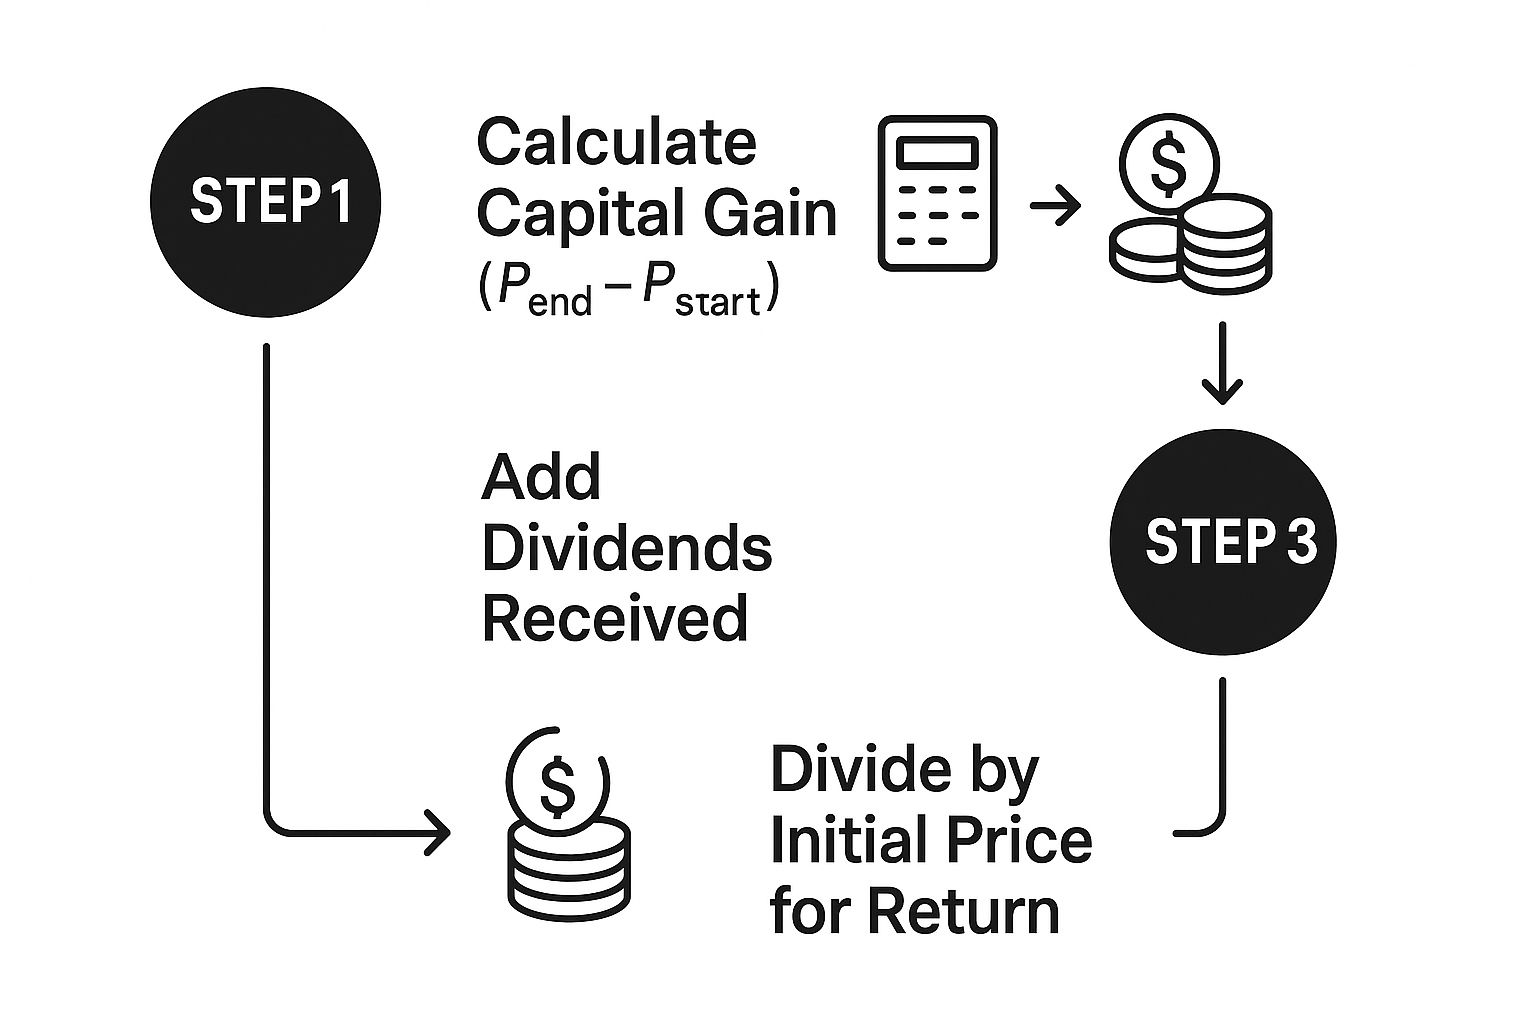
As you can see, a return really starts with the capital gain, gets a boost from any dividends paid out, and then measures that total profit against what you initially paid.
A Practical Example
Let’s walk through a real-world scenario. Imagine you bought shares in a company for $10,000. After 18 months (which is 1.5 years), you decide to sell them for $12,500.
First up, calculate the simple return: ($12,500 - $10,000) / $10,000 = 0.25, or a clean 25%.
Now, let's plug that into our annualization formula:
- Annualized Return = [(1 + 0.25) ^ (1 / 1.5)] – 1
- Annualized Return = [(1.25) ^ (0.6667)] – 1
- Annualized Return = [1.1605] – 1
- Annualized Return = 0.1605
Your annualized return comes out to 16.05%. This tells you that your 25% gain over 18 months is the same as earning 16.05% every single year. Now you have a number you can actually use to compare against other investments, like the S&P 500's average return or another stock you sold last year.
It's a common mistake to simply divide the total return by the number of years (e.g., 25% / 1.5 years = 16.67%). This is wrong because it completely ignores compounding and will always give you an inflated, inaccurate result.
Stock return calculations can be simple, like the absolute 50% gain you'd see if a stock went from $100 to $150. But it’s the annualized figure—like the 14.47% return that same stock would have over three years—that gives you a much clearer picture of its actual performance. If you want to dive deeper into analyzing historical stock data, the folks at pyquantnews.com have some great insights.
Mastering the Compound Annual Growth Rate (CAGR)

While annualized returns are great for a quick comparison between different investments, the Compound Annual Growth Rate (CAGR) is the gold standard for understanding a single investment’s journey over several years. It cuts right to the chase and answers the most important question: "If my investment grew at a perfectly steady rate each year, what would that rate have to be to get from my starting point to my ending value?"
This is an incredibly useful metric because, let's be honest, real-world returns are never that smooth. Markets are volatile. You'll see big gains one year and painful losses the next. CAGR slices through all that noise to give you a single, representative number that reflects the true, compounded performance of your stock over time.
Why CAGR Beats a Simple Average Every Time
It's so tempting to just add up a few years of returns and divide by the number of years. Quick and easy, right? But this approach is deeply flawed and can be seriously misleading. Taking a simple average of yearly gains ignores the crucial effect of compounding.
A simple average treats each year's return as if it's based on your original investment. But in the real world, your gains (or losses) from year one become the starting capital for year two. This is the power of compounding in action, and it's precisely what CAGR is built to capture.
CAGR is a geometric mean, not a simple arithmetic mean. This is the key difference. It understands that a 50% loss requires a 100% gain just to break even—a brutal reality that a simple average completely glosses over.
The CAGR Formula
To calculate CAGR, you only need three data points: your investment's beginning value, its ending value, and the number of years you held it.
CAGR = [(Ending Value / Beginning Value) ^ (1 / Number of Years)] – 1
If this formula looks familiar, it’s because it’s nearly identical to the one for annualized returns. The main difference is in its application. You can annualize returns for periods shorter than a year, but CAGR is specifically designed for investment horizons that span multiple years.
A Practical CAGR Calculation
Let's walk through a real-world scenario. Imagine you invested $10,000 into a tech stock five years ago. It’s been a bumpy ride:
- Year 1: Grows to $13,000 (a 30% gain)
- Year 2: Dips to $11,700 (a -10% loss)
- Year 3: Bounces back to $14,625 (a 25% gain)
- Year 4: Ticks up to $15,356 (a 5% gain)
- Year 5: Finishes at $17,659 (a 15% gain)
If you calculate a simple average of these annual returns (30% – 10% + 25% + 5% + 15%) / 5, you get 13%. But does that reflect your actual experience? Let's plug the numbers into the CAGR formula to find out.
- CAGR = [($17,659 / $10,000) ^ (1 / 5)] – 1
- CAGR = [(1.7659) ^ (0.2)] – 1
- CAGR = [1.1205] – 1
- CAGR = 0.1205
The true Compound Annual Growth Rate is 12.05%. This is the consistent, smoothed-out annual return that would have actually grown your initial $10,000 to its final value of $17,659 over those five volatile years. As you can see, it's a much more honest reflection of your investment's performance than the overly optimistic simple average of 13%.
Getting a firm grip on growth rates like this is also a cornerstone when you master stock valuation methods.
Understanding What Really Drives Your Stock Returns
Knowing how to calculate your stock returns is one thing. Understanding why they happen is where the real money is made. Once you move past the basic formulas, you start to see that your final profit is really shaped by just three core drivers: a company’s earnings, its dividend policy, and what the market thinks it’s worth.
A stock's price doesn't just move on a whim. It's fundamentally tied to the company's ability to grow its profits and, just as importantly, the price other investors are willing to pay for a piece of those profits. These two forces are constantly at play, working together to create your returns over time.
The Three Engines of Stock Returns
It helps to think of your total return as a machine with three distinct engines. Each one plays a critical role, and learning to spot them helps you truly analyze performance instead of just measuring it.
-
Earnings Per Share (EPS) Growth: This is the bedrock. When a company consistently makes more money, its underlying value grows. Sooner or later, that growth should show up in its stock price. It's the most fundamental driver of them all.
-
Dividend Yield: This is the cash that lands in your pocket just for holding the stock, completely separate from any price change. It provides a steady, predictable income stream and is a huge, often underestimated, contributor to long-term total returns.
-
Change in Valuation Multiples: Now, this is the wildcard. It’s all about market sentiment, which we often measure with the price-to-earnings (P/E) ratio. Even if a company's earnings are completely flat, you could see a massive return if investors suddenly decide to pay a much higher multiple for those exact same earnings. The reverse is also painfully true.
If you really want to get under the hood of what drives stock returns, learning how to calculate intrinsic value is a game-changer. It helps you separate a company's actual performance from the market's often-fickle mood swings.
A Simple Model for Predicting Returns
This framework isn't just theory; it’s incredibly practical. Vanguard founder Jack Bogle famously cooked up a simple model for predicting future stock returns based on these exact three factors: the initial dividend yield, the earnings growth that follows, and any change in the P/E ratio.
His model does an surprisingly good job of explaining what’s happened in the market historically.
Take the S&P 500 from 2000 to 2009. The nominal annualized return was a dismal -0.95%. This infamous "lost decade" wasn't because great American companies stopped making money. It happened because the sky-high P/E ratios from the dot-com bubble collapsed, wiping out a decade's worth of gains from both dividends and steady earnings growth.
Ultimately, seeing a negative return doesn't always mean you picked a bad company. It could just mean you bought a great company at too high a price, right before market sentiment turned sour. By breaking down your returns into these three parts, you get a much clearer, more honest picture of what really drove your performance—for better or for worse.
Common Questions About Stock Returns
Once you start running these formulas, you’ll inevitably bump into some real-world situations that aren't so black and white. Let's walk through some of the most common questions that pop up when investors begin to really dig into their performance numbers.
Getting these details right is the difference between a fuzzy guess and a sharp, accurate picture of your portfolio's health.
Annualized Return vs. CAGR
One of the first hurdles for many investors is wrapping their heads around the difference between annualized returns and the Compound Annual Growth Rate (CAGR). They sound similar, and their formulas even look a bit alike, but they're different tools for different jobs.
Here’s how I think about it:
- Annualized Return is for comparison. Its main purpose is to put different investments on an even playing field by showing what their return would be over a one-year period. This is perfect when you want to compare a stock you held for nine months against one you owned for three years.
- CAGR is for smoothing out the ride. It’s specifically designed to measure an investment's growth over several years, ironing out the volatile ups and downs to give you a single, hypothetical steady growth rate. It’s the go-to metric for evaluating a long-term position.
Think of it this way: Use annualized returns to compare different investments side-by-side. Use CAGR to judge the long-term journey of a single investment. They answer completely different questions.
How to Handle Adding More Shares
What happens when you don't just buy a stock and hold it? We rarely do. We often buy more shares over time, maybe to average down or build up a position. A simple return calculation just won't work anymore because your cost basis—what you paid for your shares—is now a moving target.
This is where you graduate to more advanced, cash-flow-adjusted methods like the money-weighted rate of return (MWRR) or the time-weighted rate of return (TWRR). Most brokerage platforms these days will calculate one of these for you, but it’s crucial to know what’s going on under the hood.
The MWRR is your personal return, and it's heavily influenced by when you decided to add more money. If you got lucky and bought a big chunk right before a surge, your MWRR will look great. The TWRR, on the other hand, strips out the impact of your timing. It measures the investment's raw performance, which is why it's the industry standard for comparing fund managers.
Should I Include Taxes and Fees?
For the most brutally honest look at how you're actually doing, you absolutely have to factor in taxes and fees. The formulas we've been talking about calculate your gross return—the performance of the investment itself, living in a perfect, fee-free vacuum.
But what really hits your bank account is the net return. This is the number that matters. It’s the cash you can actually spend after you subtract all the trading commissions, management fees, and, of course, capital gains taxes.
While gross return is fine for a quick comparison of one stock versus another, your net return tells the true story of whether your wealth is actually growing. It's the ultimate scoreboard.
Ready to build conviction in your investments? The Investogy newsletter offers deep-dive analysis on a real-money portfolio, showing you the "why" behind every decision. Subscribe for free at Investogy.com.
Leave a Reply