Stock portfolio analysis is like a regular health check for your investments. It answers three big questions: How are my stocks performing? What risks lie ahead? And does everything still line up with my financial goals?
Why Stock Portfolio Analysis Is Your Investing Playbook
Imagine your portfolio as a high-stakes sports team. Each stock plays a role. Some are agile strikers (growth stocks) aiming for big gains. Others are reliable defenders (value stocks), ready to shield you when markets turn. But even champion players need a winning game plan.
A solid analysis becomes your coach’s playbook. It digs into individual performance and, more importantly, how those stocks work together. With this insight, you tackle the tough calls that separate successful investors from guesswork.
The Core Pillars Of Analysis
At the heart of portfolio analysis lie three fundamental pillars:
-
Performance Measurement
Dig deeper than “Did I beat the market?” Track the return you’re earning relative to the risk you’re taking on. -
Risk Management
Spot concentration gaps or overexposure. Ask yourself: How would a downturn in tech or energy affect my holdings? -
Goal Alignment
Your portfolio should be the vehicle for specific targets—retirement, college funds, or that dream home down payment.
To see why these pillars matter, remember Modern Portfolio Theory, introduced in 1952 by Harry Markowitz. His work proved that diversification cuts risk when assets don’t move in perfect lockstep. In fact, a well-chosen basket of 20 to 30 stocks can capture about 90% of the diversification benefits of a massive portfolio. You can explore the original research on portfolio selection for more depth.
A portfolio is more than a collection of stocks—it's a dynamic ecosystem. The links between holdings drive overall health just as much as individual performance.
Core Components of Portfolio Analysis at a Glance
Below is a quick reference to those three pillars. Keep it handy whenever you sit down to review your investments.
| Pillar | Objective | Key Question It Answers |
|---|---|---|
| Performance Measurement | Quantify returns adjusted for risk | Am I getting paid enough for the volatility I face? |
| Risk Management | Identify and mitigate concentration or market threats | What could cause a severe drop in my portfolio? |
| Goal Alignment | Ensure each holding contributes to your long-term targets | Are my investments still steering me toward my goals? |
Use this table as a checkpoint each quarter to keep your strategy on track.
Building A Stronger Portfolio
Running these analyses regularly shifts you from passive ownership to active stewardship. You’ll spot when a position has grown too large or when an undervalued sector deserves more attention. You can trim back, redeploy capital, or even rethink your asset mix as life changes.
It all starts with a solid foundation. Before diving into metric-by-metric analysis, get comfortable with the basics of how to assemble your lineup. Check out how to build a stock portfolio for a step-by-step guide that sets the stage for deeper evaluation.
Decoding Your Portfolio Performance Metrics
If you're only looking at the simple up-or-down return of your portfolio, you're missing most of the story. To really get what’s going on with your investments, you need to speak the language of performance metrics. These numbers are what tell you how you're getting your returns and how much risk you're taking on to get them.
Think of it like popping the hood of a car. A quick glance at the dashboard tells you if the engine is running, but a real diagnostic check reveals its efficiency, power, and long-term health. That's what we're going to do here. We'll break down three of the most important diagnostic tools for any investor: Beta, Alpha, and the Sharpe Ratio.
Understanding Beta: Your Portfolio’s Sensitivity
First up is Beta. In simple terms, Beta measures how much your portfolio swings in price compared to the overall market (usually the S&P 500). It’s a gauge of volatility.
Imagine your portfolio is a small boat and the market is the ocean. Beta tells you how much your boat rocks with the waves.
- A Beta of 1.0 means your boat moves perfectly in sync with the ocean. If the market goes up 1%, your portfolio tends to follow suit with a 1% gain.
- A Beta greater than 1.0 means you've got a more responsive boat. A portfolio with a Beta of 1.2, for instance, would theoretically jump 1.2% when the market rises 1%—but it would also drop 1.2% when the market falls 1%. This is a higher-risk, higher-reward setup.
- A Beta less than 1.0 suggests a steadier vessel. A portfolio with a 0.8 Beta is less volatile, moving less than the overall market.
Knowing your Beta is crucial. It tells you whether you’ve built a portfolio for aggressive growth (high Beta) or one that’s more defensive and stable (low Beta). It’s all about matching your risk profile to your personal comfort level.
Measuring Alpha: A Report Card on Your Investing Skill
If Beta is all about the movements caused by the market, Alpha is about the performance that can't be explained by the market. Think of it as the "excess return" you're generating thanks to your smart stock picking. It's a direct measure of the value you've added.
Simply put, a positive Alpha is what we all strive for. It shows that your investment choices beat the market on a risk-adjusted basis. A negative Alpha, on the other hand, means you actually underperformed what was expected for the amount of risk you took.
Alpha is what separates luck from skill. It cuts through the market noise to show the performance that is directly tied to your investment strategy. Nailing a consistently positive Alpha is the true sign of a great stock picker.
For anyone just starting out, generating Alpha comes from mastering the basics. Our guide on how to analyze stocks for beginners is a great place to build that foundational knowledge for making smarter investment calls.
Using the Sharpe Ratio: The Ultimate Risk-Adjusted Scorecard
Finally, we have the Sharpe Ratio. This is arguably the most complete single metric for judging performance. It doesn’t just measure return against risk; it measures it against the return you could have gotten from a "risk-free" investment, like a U.S. Treasury bill.
The Sharpe Ratio answers one of the most important questions in investing: "Am I actually being rewarded enough for the volatility I'm putting up with?" It’s your performance-per-unit-of-risk score.
When comparing two portfolios, the one with the higher Sharpe Ratio is always the winner—it delivered better returns for the amount of risk taken. A ratio above 1.0 is generally considered good, and anything getting close to 2.0 is top-tier.
To give you a clearer picture, let's break down these essential metrics in a quick-reference table.
Essential Portfolio Metrics Explained
| Metric | What It Measures | Why It Matters |
|---|---|---|
| Beta | Your portfolio's volatility relative to the market (e.g., S&P 500). | Helps you understand if your portfolio is aggressive (Beta > 1) or defensive (Beta < 1) and align it with your risk tolerance. |
| Alpha | The excess return your portfolio generates above what its Beta would predict. | It's a measure of your skill in selecting investments that outperform the market on a risk-adjusted basis. |
| Sharpe Ratio | The risk-adjusted return, comparing your portfolio's performance to a risk-free asset. | Gives you a "bang-for-your-buck" score on risk, telling you if the returns justify the volatility you're experiencing. |
By using these three metrics together, you get a much richer, multi-dimensional view of what's happening inside your portfolio. Beta frames the risk, Alpha measures your skill, and the Sharpe Ratio delivers the final verdict on whether it was all worth it.
Your Step-By-Step Portfolio Analysis Framework
Knowing the metrics is one thing, but actually putting them to work is a whole different ball game. A structured process is what turns all those abstract numbers into insights you can actually use, giving you a clear roadmap to follow when you check in on your investments. I've broken down my own comprehensive stock portfolio analysis into five manageable steps.
Think of this as your annual financial check-up. It's a deliberate process I use to make sure my portfolio is healthy, still pointing toward my goals, and tough enough to handle whatever the market decides to throw at it. By following these steps, you’ll shift from just owning stocks to actively managing your financial future.
Step 1: Gather Your Essential Data
Before you can analyze anything, you have to get all your information in one place. This is the bedrock of the whole process—like an accountant gathering receipts before tackling a tax return. You simply can't assess what you can't see clearly.
Start by pulling data from all your brokerage accounts, retirement plans (like a 401(k) or IRA), and anywhere else you hold stocks.
You’ll need to jot down:
- A complete list of every individual stock, ETF, and mutual fund you own.
- The number of shares for each position.
- The current market value of each holding.
- Your cost basis for each investment (what you originally paid for it).
- Any dividends or capital gains you’ve received.
Most brokerage websites have a dashboard that lays all this out for you. The key is to get a complete, aggregated view of every single thing you own across all your accounts.
Step 2: Clarify Your Investment Goals
Okay, with your data wrangled, it's time to revisit your "why." Why are you even investing? Your goals are the filter for every decision you make, from how much risk you're willing to take to what your ideal asset mix looks like.
A portfolio built for a 25-year-old just starting to save for retirement will—and should—look totally different from one designed for a 55-year-old who plans to hang it up in five years. Get specific. Are you shooting for aggressive growth, steady income, or just making sure you don't lose what you've got?
Your financial goals are the North Star of your investment strategy. Without them, you’re just navigating without a map, and your stock portfolio analysis will lack meaningful direction.
This is also the perfect time to get honest about your risk tolerance. Has anything changed in your life that makes you more—or less—comfortable with market swings? Answering that question ensures your portfolio aligns not just with your financial targets, but with your peace of mind.
The infographic below shows how assessing risk is a central part of the whole analysis process, connecting your personal goals with what's actually in your portfolio.
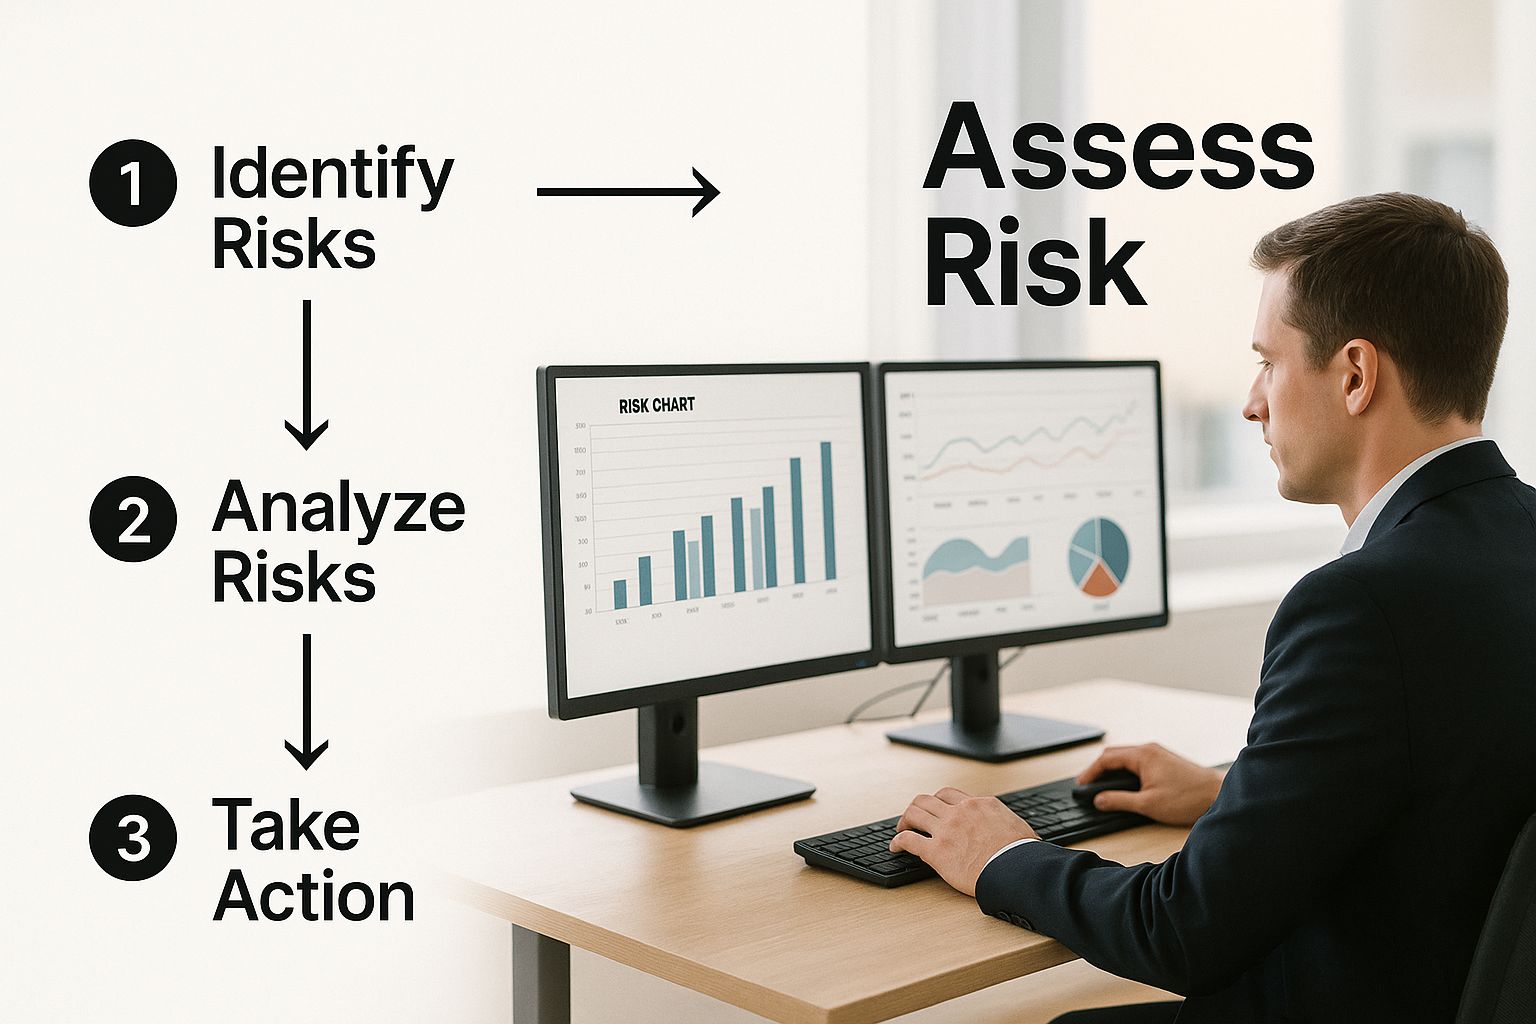
This visual really drives home the point that managing risk isn’t a one-and-done task. It’s an ongoing part of a healthy, functioning investment framework.
Step 3: Assess Your Asset Allocation and Diversification
Now we get to the fun part: looking at the actual makeup of your portfolio. Take a step back and look at your holdings from a 30,000-foot view. What percentage is in stocks versus other things? Within your stock holdings, how is your money spread out?
You're hunting for concentration risk. Is more than 5-10% of your portfolio tied up in a single company? Sure, high conviction can pay off big, but being over-concentrated can be a disaster if that one golden goose suddenly stops laying eggs.
Do the same thing with sector exposure. Are you accidentally all-in on tech? Or financials? A lack of diversification across different industries can leave you dangerously exposed to sector-specific downturns. A critical part of any good portfolio analysis is knowing how to analyze financial statements for the companies you're invested in.
Step 4: Evaluate Performance Against a Benchmark
This is where you grade your own homework. It’s not enough to see that your portfolio's value went up; you need to know if it performed well compared to the rest of the market. To do that, you need to pick an appropriate benchmark.
For a portfolio made up mostly of big U.S. companies, the S&P 500 is the go-to benchmark. If you have a lot of money in international stocks, you might use something like the MSCI World index. Comparing your returns to a benchmark is like glancing at your speedometer on the highway; it gives you crucial context.
Calculate your portfolio's return over the last year, three years, and five years. Now, put it right next to your benchmark's return over those same periods. Did you beat the market or did it beat you? This simple comparison, especially when you factor in metrics like your Sharpe Ratio, tells you if the risk you took was actually worth the reward you got.
Step 5: Rebalance Your Portfolio
The final step is turning your analysis into action. Rebalancing is simply the process of buying or selling assets to get your portfolio back to its original target allocation. It's a fact of life that some investments will grow faster than others, causing your carefully planned allocation to drift over time.
For example, maybe your target was 70% stocks and 30% bonds. After a great year for stocks, your portfolio might have drifted to 80% stocks and 20% bonds. That means you’re now taking on more risk than you originally signed up for. Rebalancing would mean selling some stocks and using the proceeds to buy bonds, bringing you back to that 70/30 split.
This disciplined process is powerful because it forces you to sell high and buy low, stripping the emotion out of your decisions. It’s the practical, hands-on application of all your hard work, ensuring your portfolio stays locked in on the strategy you so carefully built.
Common Portfolio Analysis Mistakes To Avoid
Picture yourself poring over charts late at night, certain you’ve dotted every “i” and crossed every “t.” Yet when the market hiccups or your returns fall flat, you realize it wasn’t a lack of data—it was hidden pitfalls. Portfolio analysis isn’t just about following steps; it’s equally about sidestepping the traps that derail even seasoned investors.
Emotional biases and small oversights can erode returns over time. A sudden headline might spark a panic sale, or a tiny fee might quietly chip away at your gains year after year. By naming these common errors, you build a more resilient strategy that relies on thoughtful decisions instead of knee-jerk reactions.
Chasing Last Year’s Winners
It’s natural to want in on the hottest stocks or sectors. After all, who wouldn’t want to ride a wave of success? This tendency—often called performance chasing—is a bit like driving while staring only at your rearview mirror. You’re fixated on what’s behind you, not where you’re going.
Yet market leadership rarely stays put. Tech stars of last year can become laggards today. In fact, a 2021 study found that less than 26% of top-quartile mutual funds stayed in that elite group over a full five-year stretch. Real insight comes from digging into a company’s fundamentals and mapping its role in your broader allocation—rather than simply following a hot streak.
Letting Emotions Drive Decisions
Fear and greed are powerful market forces—and terrible portfolio managers. Emotional investing usually leads to two classic blunders:
- Panic Selling: When indexes slide, the urge to unload everything and “stop the bleeding” can be overwhelming. Often, this locks in losses just before a rebound.
- FOMO Buying: At the opposite extreme, the “fear of missing out” pushes you into assets at peak valuations, right when risk is at its highest.
Discipline Is The Bridge Between Investment Goals And Accomplishment.
A systematic framework forces you to lean on data and strategy—never on gut reactions.
A calm, goal-oriented plan turns market dips into potential opportunities instead of reasons to hit the eject button.
Ignoring Fees And Taxes
Tiny percentage points sound harmless, but over decades they add up. Many investors fixate on gross returns and overlook the drag of expenses and taxes.
- An expense ratio of 1% versus 0.1% on a $100,000 portfolio costs you $900 extra each year.
- Over 30 years, compounding magnifies that difference into tens of thousands in lost growth.
- Frequent trading can trigger capital gains taxes, further cutting into your net performance.
Any robust analysis must roll up expense ratios, commissions, and tax estimates to reveal your true after-cost return.
Setting And Forgetting Your Portfolio
Long-term investing is wise—but “set it and forget it” can backfire. Your goals, risk tolerance, and life circumstances evolve. What fit five years ago may feel off-target today.
Market moves also shift your allocations. A bull run can inflate equities to a larger share of your portfolio, upping risk without you even noticing. That’s why:
- Regular Checkups: Schedule periodic reviews—quarterly or semiannually—to ensure each holding still serves your plan.
- Rebalancing: Trim overweight positions and top up underweights to keep your intended risk profile intact.
Think of portfolio maintenance like servicing a car. You wouldn’t drive 100,000 miles on old oil—so don’t cruise years without a financial tune-up.
The Best Tools for Modern Portfolio Analysis
You don't need a Wall Street-sized budget to run a professional-grade portfolio analysis. In fact, you can do it right from your home computer with software that’s either free or surprisingly affordable.
Most big brokerages, like Fidelity and Vanguard, bake basic analysis tools right into their platforms. These are great for a quick health check.
You can easily chart your asset allocation, glance at simple risk metrics, and track your performance over time without ever leaving your account dashboard. Usually, you'll find things like:
- Asset Maps: Simple pie charts or tree diagrams that give you a bird's-eye view of your allocations.
- Performance Dashboards: These show your returns, maybe a few risk ratios, and sector heat maps to see what's hot and what's not.
- Rebalancing Alerts: A handy nudge when your portfolio starts drifting away from your target allocations.
When you're ready to go a layer deeper, dedicated platforms like Morningstar offer advanced screening tools and their well-known ratings. This is where you can really start drilling down into factor analysis and see how your individual holdings stack up against their peers.
Key Considerations When Choosing a Tool
Before you jump in, think about what you really need. Consider the depth of the data, how often it updates, and of course, the cost.
A weekend hobbyist is probably looking for something with zero fees. A more serious investor, on the other hand, might happily pay a subscription for real-time data feeds and more powerful features.
- Data frequency: Are delayed quotes okay, or do you need real-time data?
- Custom reporting: Can you create your own views, or are you stuck with pre-set dashboards?
- Integrations: Is it easy to export data to a spreadsheet or connect with other software?
- Extra Context: Do they offer community ratings or professional analyst commentary?
If you want to get serious about risk management and run stress tests or "what-if" scenarios, you'll need a platform with Monte Carlo simulations. It sounds complex, but tools like Portfolio Visualizer actually provide this for free.
Stress-testing is like a fire drill for your portfolio. It shows you how your investments might hold up during extreme market swings, helping you prepare for risks before they happen.
For those of us who live in spreadsheets, there are fantastic Excel plugins and specialized Python libraries like PyPortfolioOpt that can integrate right into your workflow. These are perfect for building custom metrics and running your own coded optimizations.
Comparing Cost And Capabilities
Generally, you get what you pay for. Free tools are great, but they might limit the number of holdings you can analyze at once or stick you with delayed data.
- Free Tier: Think of your brokerage dashboard with its slightly delayed quotes. Perfect for basic check-ups.
- Mid-Tier: Morningstar Premium is a good example here. You get access to their famous ratings and solid screening tools for a subscription fee.
- High-End: The Bloomberg Terminal is the holy grail, giving you exhaustive data for a cool $24,000/year.
The key is to match a tool’s strengths to your personal priorities. If you're laser-focused on tax-efficient investing, you'll want a platform that has built-in cost basis tracking.
My advice? Beginners should start with the tools on their existing broker's site. Get familiar with the basics there before even thinking about upgrading to more sophisticated software.
For a deeper dive into what to do with these insights, check out our guide on portfolio rebalancing.
Ultimately, the best tools for stock portfolio analysis are the ones that blend user-friendly visuals with data that’s robust enough for you to trust.
- Use your brokerage tools for quick checks. They're free and convenient.
- Upgrade to platforms like Morningstar when you need to dig deeper.
- Bring in spreadsheets or Python if you want to automate advanced, custom reports.
With just a few clicks, the right tool can give you a thorough analysis that helps you make your next investment move with confidence.
Getting Started With Your Chosen Tool
First things first, make a short list of what you actually need to accomplish. Is real-time quoting a must-have? Do you need API access to build automated reports?
Once you have a tool in mind, just walk through their setup guides. Most platforms have tutorials or quick-start videos to get you up and running fast.
- Have your account credentials handy for linking your broker sites.
- Enable any API tokens if you're going the Python or Excel plugin route.
- Take a few minutes to customize your dashboards so the metrics you care about most are front and center.
After that initial setup, I recommend scheduling a monthly check-in to refresh your data and review your key metrics.
Over time, you'll get more comfortable and might even discover new features that align with your evolving financial goals.
A consistent review process builds discipline. It's what keeps you from overreacting to the daily market noise and making emotional decisions.
By picking the right mix of free tools, premium platforms, and custom scripts, you'll build a resilient workflow for analyzing your stock portfolio.
Start small, iterate as you learn, and always let the data guide your decisions.
Happy analyzing, and may your portfolio thrive.
Your Top Portfolio Analysis Questions Answered
Even with a solid plan, it's natural to have questions when you start digging into your portfolio. Let's tackle some of the most common ones I hear from investors. I'll cut through the noise and give you direct, practical answers to help you move forward.
Think of this as your quick-reference guide for those nagging questions—from how often you should be checking in on your stocks to the real difference between two of the most jumbled-up terms in finance.
How Often Should I Analyze My Stock Portfolio?
Finding the right frequency for portfolio analysis is a classic balancing act. You want to stay informed, but you don't want to overreact to every little bump in the market.
A deep, comprehensive analysis is something you should tackle once or twice a year. This cadence is perfect for assessing your long-term strategy and performance without getting bogged down by the daily chatter and volatility.
On top of that, a quick quarterly review is a great habit to build. It's a much lighter check-in, mainly to make sure your asset allocation hasn't drifted too far from your targets. Think of it as a quick course correction.
However, some moments in life demand an immediate, full-scale portfolio review. These are the big ones:
- Changing jobs or getting a major pay bump
- An inheritance or another unexpected financial windfall
- Getting close to a huge financial milestone, like buying a house or retiring
Life changes, and your financial goals and risk tolerance will probably change right along with it. A fresh analysis is non-negotiable in these moments.
What Is the Difference Between Asset Allocation and Diversification?
People throw these terms around interchangeably, but they are two completely different layers of building a solid portfolio. Getting this right is fundamental to managing your risk effectively.
Let’s use a home-building analogy.
Asset allocation is your architectural blueprint. It’s the big-picture decision about how much of your money goes into broad categories like stocks, bonds, and cash. This single decision is the main driver of your portfolio's overall risk and potential return. It sets the foundation.
Diversification, on the other hand, is choosing the specific materials to build that house. If your blueprint calls for 60% of the structure to be made of wood (stocks), diversification is about selecting different types of wood to ensure the whole thing is strong and resilient.
So, for that 60% in stocks, you wouldn't just buy a bunch of tech companies. You'd spread it out across healthcare, industrials, and consumer staples. You’d also look at different geographies—like the US, international markets, and emerging markets—so your portfolio isn't completely tied to the fate of a single country's economy.
Can I Do Portfolio Analysis Myself?
Absolutely. Armed with the frameworks in this guide and the tools available today, any investor can run an effective portfolio analysis. The resources out there are incredible—especially the free tools most brokerage platforms now offer. They’re more than enough for most of us to get a great handle on our investments.
Doing your own analysis is also a fantastic way to take real ownership of your financial future. It forces you to learn, builds discipline, and grows your confidence as an investor.
That said, there are times when getting a professional's take is a smart move. Think about talking to a financial advisor if you:
- Have a really complex financial life (like owning a business or dealing with tricky tax situations).
- Just want an objective sounding board to keep you grounded during market craziness.
- Need help with more advanced planning, like tax-loss harvesting or setting up an estate plan.
A good advisor isn't there to just pick stocks; they're your coach, helping you stick to the game plan when your emotions are trying to call the shots.
What Is a Good Sharpe Ratio for My Portfolio?
The Sharpe Ratio is a fantastic metric for seeing if you're getting enough bang for your risk-taking buck. But what's considered "good" is all relative.
As a general rule of thumb, a Sharpe Ratio that stays consistently above 1.0 is solid. It means your portfolio is generating a positive return for every unit of risk you're taking on. A ratio getting close to 2.0 is excellent, and anything above 3.0 is truly exceptional (and pretty rare to see over the long haul).
But here’s the real secret to using the Sharpe Ratio: it’s a tool for comparison, not a standalone grade. Its true power comes from pitting your portfolio’s ratio against its main benchmark, like the S&P 500. If your portfolio consistently pulls off a higher Sharpe Ratio, it’s a clear sign your strategy is delivering better risk-adjusted performance. And that's exactly what you're aiming for.
Ready to stop guessing and start building a smarter portfolio? The Investogy newsletter offers a transparent, real-world look at how we manage our own money. Subscribe for free and get actionable insights delivered to your inbox every week. Join the community at Investogy.
Leave a Reply