
Fundamental analysis is all about figuring out a company's intrinsic value. That’s a fancy term for what a business is actually worth, regardless of its day-to-day stock price swings. Think of it as the deep-dive investigation into a company’s overall financial health and business prospects.
It’s the only way to truly understand if a stock is a bargain or just overpriced hype.
What Is Fundamental Analysis in Simple Terms

Let’s say you’re buying a used car. You wouldn't just glance at the odometer and the price tag before handing over your cash, right? Of course not.
You’d pop the hood, check the engine, and maybe even take it to a trusted mechanic. You’d look up its history, see if it’s been in any accidents, and compare its price to similar models. This whole process is designed to uncover the car's real value so you can decide if the seller’s price is fair.
Fundamental analysis is the exact same concept, just for stocks. It's about being a business inspector, not a gambler. You’re looking past the market noise to understand the true, underlying value of the company itself.
Looking Under the Hood
Instead of getting caught up in fleeting market trends or trying to decipher cryptic chart patterns, this method forces you to get your hands dirty and dig into the business itself. An investor using fundamental analysis pieces together a wide range of information to build a complete picture of a company’s health and where it's headed.
This process involves rolling up your sleeves and evaluating several key areas:
- Financial Health: You'll spend a lot of time poring over financial statements. The income statement, balance sheet, and cash flow statement are your best friends here. They tell you everything from profitability and debt levels to how efficiently the company operates.
- Industry Position: It's not just about the company, but the world it lives in. You need to analyze its competitors, its market share, and the overall growth potential of its industry. Is it a big fish in a shrinking pond, or a small fish in a rapidly expanding ocean?
- Management Quality: A company is only as good as the people running it. You need to assess the leadership team’s experience, their track record, and whether their strategic vision for the future actually makes sense.
- Economic Conditions: You also have to zoom out and look at the big picture. Macroeconomic factors like interest rates, inflation, and GDP growth can have a huge impact on a business, for better or worse.
To give you a clearer picture, let's break down these components into a simple table.
Fundamental Analysis at a Glance
This table maps out the core parts of fundamental analysis, showing you the goal, the tools of the trade, and the kind of data you'll be working with.
| Component | Description | Example |
|---|---|---|
| Goal | To determine a stock's intrinsic value—what it's truly worth. | Calculating that Apple (AAPL) is worth $220 per share when it's trading at $190. |
| Primary Tools | Financial statements, industry reports, and economic forecasts. | Analyzing a company’s 10-K report, reading a Gartner industry analysis. |
| Data Types | A mix of quantitative (the numbers) and qualitative (the story). | Using P/E ratios (quantitative) and assessing brand strength (qualitative). |
Ultimately, this all boils down to one simple question: is the company’s stock trading for less than it’s truly worth? If your deep-dive research tells you the intrinsic value is higher than the current market price, you might have just found a great investment.
Fundamental analysis is a disciplined approach that helps you make decisions based on business reality, not just market sentiment. By focusing on a company's genuine strengths and its long-term potential, you can invest with a whole lot more conviction.
How Fundamental Analysis Evolved Over Time

Fundamental analysis didn't just appear out of thin air. It grew from a simple, yet powerful idea: a company's stock price should, eventually, line up with its real-world business performance. Long before high-speed internet and endless data streams, the earliest investors were more like financial detectives, painstakingly piecing together clues to figure out what a company was truly worth.
That investigative spirit has been the heart of the discipline for over a century. It all started with early economic theories, where pioneers focused on the big picture to estimate a security's intrinsic value. They looked at earnings, sure, but also at things you couldn't easily quantify, like the state of the industry and the quality of the people in charge. Back then, the approach was overwhelmingly top-down, relying on macroeconomic factors like GDP growth and interest rates to predict which way the market winds were blowing. You can learn more about these early days on QuantifiedStrategies.com.
From Broad Strokes to Fine Details
As markets got more complicated, and especially after seismic events like the Great Depression, investors started realizing that just looking at the economy wasn't enough. The discipline had to evolve. It needed to get more granular and zero in on the companies themselves. This crucial shift was championed by legends like Benjamin Graham, widely known as the "father of value investing."
Graham and his peers brought a new level of rigor to the game, introducing a bottom-up approach. They built a framework for dissecting a company's financial statements, searching for hard evidence of its financial health. This was a game-changer, moving the focus from broad economic predictions to detailed corporate investigations.
Key Takeaway: The history of fundamental analysis is a story of shifting focus—from a wide, economy-sized lens to a sharp, company-specific microscope. Today, a good analyst knows how to use both.
Adapting to a Modern World
The core principles of fundamental analysis haven't changed much, but the tools we use have been completely transformed. Technology now gives us instant access to a staggering amount of data, letting analysts run calculations and spot trends that would have been impossible just a few decades ago.
But it’s not just about the tech. The scope of the analysis itself has broadened. Today’s analysts look beyond the balance sheet to consider things like investor psychology and corporate governance. The questions have become more nuanced:
- Brand Strength: What's a company's reputation actually worth in dollars and cents?
- Corporate Culture: Is the company a place that encourages innovation and ethical decisions?
- Technological Disruption: How ready is the business for the next big industry shift?
This constant adaptation is proof that fundamental analysis isn't some dusty, rigid set of rules. It’s a living, breathing discipline that has evolved to meet the challenges of modern markets, cementing its place as an essential tool for any serious investor.
Decoding the Numbers in Financial Statements
If you want to get a real feel for a company's health, you have to look past the headlines and get your hands dirty with its financial records. I like to think of a company’s financial statements as the dashboard of a car. Each gauge tells you something different but equally vital about the vehicle's performance and condition.
These core documents are the heart of what’s called quantitative analysis, giving you the raw data needed to size up a business. For investors, the "Big Three" financial statements are the primary tools for the job.
The infographic below shows how digging into a company's financials is a central pillar of the whole fundamental analysis process, sitting right alongside macroeconomic and industry trends.
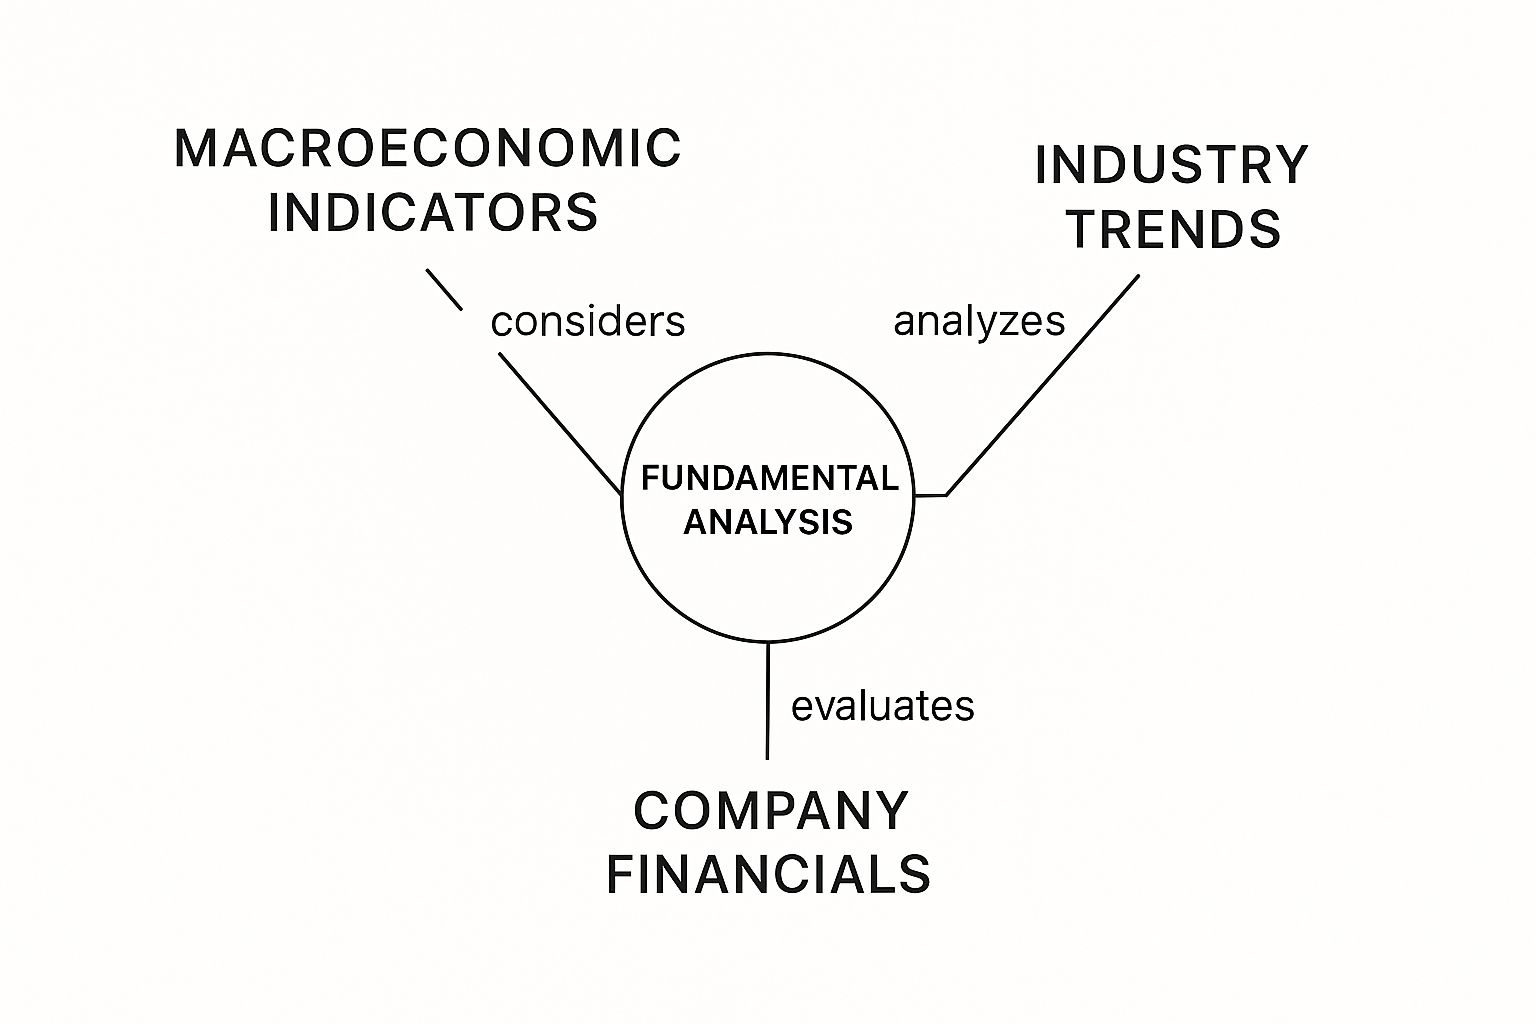
As you can see, a company's own financial data provides the direct, internal proof of its health. Your job is to then place that proof within the context of what’s happening in the broader economy and its specific industry.
The Three Essential Gauges
Each of the main financial statements offers a unique window into the business's operations and stability.
-
The Income Statement: This is like your car’s speedometer, showing performance over a specific period—usually a quarter or a year. It lays out a company’s revenues, subtracts all the expenses, and tells you what’s left over: its profitability.
-
The Balance Sheet: Think of this as a snapshot of the car at a single moment in time. It lists what the company owns (assets) and what it owes (liabilities), giving you a crystal-clear picture of its financial structure and net worth.
-
The Cash Flow Statement: This is the fuel gauge. It tracks the actual cash moving in and out of the company. It reveals how a business is generating and using its cash, which is absolutely critical for its day-to-day survival and ability to grow.
Looking at these three documents together gives you a multi-dimensional view of a company’s financial reality. But just reading them is the first step. The real magic happens when you start connecting the dots with financial ratios.
Using Ratios as Your Diagnostic Tools
Financial ratios are powerful. They turn all those raw numbers into insights you can actually use. They let you compare a company's performance against its own past or, even better, against its direct competitors.
These simple calculations are the backbone of fundamental analysis. Analysts use metrics like earnings, revenue, and profit margins to create these ratios, which help them figure out if a company is stable and if its stock is fairly priced. Daloopa has a great piece on where to efficiently get data for fundamental analysis.
Financial ratios help transform abstract data into a clear story about a company’s strengths, weaknesses, and overall potential as an investment.
To give you a better idea, here's a breakdown of some of the most common ratios you'll come across.
Key Financial Ratios Explained
| Financial Ratio | What It Measures | Why It Matters |
|---|---|---|
| Price-to-Earnings (P/E) Ratio | The company's stock price relative to its earnings per share (EPS). | It’s a quick way to gauge if a stock is overvalued or undervalued compared to its peers or the market. A high P/E might suggest high growth expectations. |
| Return on Equity (ROE) | How efficiently management is using shareholder money to generate profits. | A consistently high ROE often signals a strong, well-managed company with a competitive edge. It's a key indicator of profitability. |
| Debt-to-Equity (D/E) Ratio | How much debt the company uses to finance its assets versus how much it uses from shareholder equity. | This is a critical risk indicator. A high D/E ratio can mean a company is taking on too much debt, making it vulnerable during economic downturns. |
By calculating and tracking these ratios, you graduate from simply reading numbers to interpreting the story they’re telling you.
For example, a company with a consistently high ROE and a low D/E ratio is often a sign of a very strong business. These are the kinds of insights that turn a good investor into a great one.
And if you want to get a much deeper understanding of profitability metrics, you can learn more about what Earnings Per Share (EPS) is in our detailed guide.
Analyzing What the Numbers Don't Show

Financial statements tell a powerful story about where a company has been, but they don't always reveal where it's going. Real fundamental analysis means looking past the numbers on a spreadsheet to get a feel for the intangible factors that drive long-term success.
This is what we call qualitative analysis, and it’s about understanding the business as if you were going to own it for the next 20 years.
Think of it this way: two restaurants might have identical profits. One is a beloved local spot with a visionary chef and regulars who've been coming for a decade. The other is a generic chain with high employee turnover and so-so food. Which one would you rather own? The numbers alone don't give you the answer.
The Power of an Economic Moat
One of the most important things to look for is a company's competitive advantage, or what Warren Buffett famously calls its "economic moat." This is what protects a business from rivals trying to steal its profits. A wide moat makes a company incredibly tough to compete with.
These advantages aren't line items on a balance sheet, but they are immensely valuable:
- Brand Strength: Just think of Apple or Coca-Cola. Their brand loyalty is so powerful that customers will happily pay a premium, creating a durable shield against competitors.
- Patents and Intellectual Property: A pharmaceutical company with a patent on a blockbuster drug has a government-granted monopoly for a set period. That's a guaranteed stream of revenue.
- Network Effects: Platforms like Facebook or Amazon become more valuable as more people use them. This creates a virtuous cycle that makes it incredibly difficult for a new competitor to gain a foothold.
A company with a strong moat can fend off the competition and sustain its profitability for years, which makes it a much more reliable long-term investment.
Leadership and Corporate Culture
Beyond its market position, the quality of a company's management team is crucial. Are the leaders experienced visionaries with a clear strategy, or are they just coasting? A great CEO can steer a company through tough times and spot growth opportunities that others completely miss.
Great management can turn a good company into an exceptional one, while poor leadership can run even the strongest business into the ground. It’s a factor that requires judgment, not just calculation.
And don't overlook corporate culture. A company that fosters innovation, treats its employees well, and operates ethically can be a huge asset. It attracts top talent and builds trust with both customers and partners.
These qualitative insights are what give you the full picture. They add the "why" to the "what" you get from the financial statements. While quantitative data from a cash flow statement shows a company's financial health, understanding its qualitative strengths helps you feel out its resilience and future potential.
For a deeper dive into the numbers side, check out our guide explaining what cash flow analysis is. By combining both the hard numbers and the softer, qualitative factors, you can build a three-dimensional view of a company’s true value.
How to Do a Basic Fundamental Analysis
Knowing the theory is one thing, but getting your hands dirty is how you really learn. Let's walk through a simplified fundamental analysis to see how these concepts actually click together in the real world.
Imagine we're sizing up a fictional company, "InnovateTech," to decide if it's worth our hard-earned money. This example will give you a clear, repeatable framework you can use.
For a deeper dive, our guide on how to analyze stocks for beginners is a great next step.
Our process will follow three logical steps, blending the hard numbers with the softer, qualitative side to build a complete picture.
Step 1: Start with the Numbers
First things first, we pull up InnovateTech's financial statements. We’re not just staring at numbers; we're hunting for trends and calculating a few key ratios to check its pulse.
- Profitability: A glance at the income statement shows revenue has been growing at a solid 15% a year for the last three years. Even better, its net profit margin is a healthy 20%. This tells us the company is pretty darn good at turning sales into actual cash profit.
- Financial Stability: Next up, the balance sheet. Its debt-to-equity (D/E) ratio is just 0.4, which is quite low for the tech industry. That’s a great sign. It means the company isn't propped up by a mountain of debt and has a strong financial backbone.
- Valuation: Finally, we run the Price-to-Earnings (P/E) ratio, and it comes out to 18. The average for its competitors is sitting around 25. At first glance, this suggests InnovateTech’s stock might be on sale—potentially undervalued compared to its peers.
Step 2: Look Beyond the Spreadsheet
The numbers look good, but they never tell the whole story. Now it's time to investigate the things that don't fit neatly into a spreadsheet cell.
We discover that InnovateTech is led by a visionary CEO who has a history of hitting home runs with new products. The company also holds several key patents on a new battery technology, giving it a strong "economic moat" to keep competitors at bay.
On top of that, customer reviews are glowing, pointing to a fiercely loyal brand following. These are the kinds of qualitative strengths that suggest a company has a real, durable edge.
An investment thesis is strongest when a compelling quantitative story is backed by powerful qualitative factors. One without the other leaves you with an incomplete picture.
Step 3: Put It All Together and Make a Call
Okay, let's connect the dots. We have InnovateTech, a profitable and financially sound company with low debt. Based on its P/E ratio, it also seems to be trading at a discount compared to the rest of its industry.
Crucially, those strong numbers are backed up by fantastic leadership, a beloved brand, and patents that protect its business.
By combining the quantitative data with these qualitative strengths, we can start to form an idea of its intrinsic value. In this case, we conclude that the company is likely worth more than its current stock price suggests. Based on this simple analysis, InnovateTech looks like a pretty compelling investment opportunity.
Understanding the Limits of Fundamental Analysis
Look, while fundamental analysis is an incredibly powerful tool for figuring out what a company is really worth, it's not a crystal ball. Anyone who tells you otherwise is selling something. Its main job is to help you spot potentially undervalued companies for a long-term hold, not to predict where the stock will be tomorrow or time the market's wild daily swings.
Think of it like a ship's captain using maps of known waters. Fundamental analysis is built on historical data. Financial statements tell a great story about where a company has been, but they offer zero guarantees about the future. A business that was crushing it last year could get blindsided by a new competitor or a disruptive technology next year, making all that past success a pretty unreliable guide.
The Challenge of Subjectivity
Another huge limitation is just how subjective it can all be, especially when you get into the qualitative stuff. Two seasoned analysts can stare at the same leadership team or brand and walk away with completely different takeaways. One might see a visionary CEO, while the other sees a reckless gambler.
This personal judgment means that any calculation of a company’s "intrinsic value" is, at the end of the day, an educated guess—not a hard-and-fast number. This is precisely why sharp analysts often lean on statistical tools to bring a dose of objectivity to the process.
To get a handle on whether a historical average points to a real expected return or is just random market noise, analysts often use statistical significance tests. This is a much more rigorous way to validate their hunches and make smarter portfolio decisions.
For example, to tell the difference between a genuine trend and a random blip, they might calculate a t-statistic. By comparing that result to a t-distribution, they can figure out the probability that what they're seeing is purely due to chance. It adds a crucial layer of validation that separates professional analysis from pure guesswork. You can learn more about applying financial statistics from the pros at IFA.com.
Ultimately, getting what fundamental analysis is all about means accepting its flaws. It's an indispensable tool for developing a deep, almost intimate understanding of a business. But it works best when you pair it with a clear-eyed view of its constraints and a healthy dose of skepticism. It gives you the map, but you still have to navigate the unpredictable seas of the market yourself.
Got Questions? Let's Talk.
If you’re just getting your feet wet with fundamental analysis, it's natural to have a few questions. In fact, most new investors wonder about the same things. Let’s clear up some of the most common ones right now.
What's the Real Difference Between Fundamental and Technical Analysis?
It's a classic question, and the answer helps define two totally different investing philosophies.
The easiest way I've found to explain it is this: fundamental analysis is about investigating the business, while technical analysis is about studying the stock itself.
- Think of a fundamental analyst as a detective trying to figure out what a company is truly worth. You're poring over financial reports, checking out the management team, and sizing up the competition to calculate the company's long-term value.
- A technical analyst, on the other hand, is more like a market psychologist. They don't care about profits or products. They're obsessed with stock charts, looking for patterns in price and trading volume to guess where the stock is headed next based purely on market sentiment.
A fundamental investor asks, “Is this a great business to own a piece of for the long haul?” A technical trader asks, “Is right now a good time to buy or sell this stock?” Many of the best investors actually use a bit of both.
Can You Use This for Anything Besides Stocks?
Absolutely. While stocks are its most famous application, the core idea behind fundamental analysis works for almost anything you can invest in. The goal is always the same: figure out what an asset is really worth based on what drives its value.
For instance, if you were analyzing bonds, you wouldn't look at a stock chart. You'd dig into the issuer's financial health to see if they can actually afford to pay you back. With real estate, you'd analyze things like potential rental income, property taxes, and the local housing market trends.
Okay, I'm In. How Do I Actually Start?
Getting started is way less intimidating than it sounds. My advice is always the same: keep it simple.
Pick a company you already know and like—maybe it’s the coffee you drink every morning or the phone in your pocket. You already have a feel for the business, which is a huge head start.
Next, find their latest annual report (this is called a 10-K). Don't get overwhelmed and try to read all 100+ pages. Just start with two things: the "Business" section to see exactly how they make money, and then glance at the income statement to see if their sales and profits are going up or down. That's it. Taking that first small step will give you the confidence to dig in deeper next time.
Ready to see how this works with real companies and real money? The Investogy newsletter is where I break down my own research, showing you how I apply these exact principles to build a portfolio. Subscribe for free to see my investment theses and get behind-the-scenes research.
Leave a Reply