Learning how to analyze stocks really just boils down to one simple, powerful idea: you want to stop guessing and start making educated decisions. It's all about looking past the market noise and the latest hype to understand what a company is truly worth. This skill is the bedrock for building an investment portfolio that actually gets you closer to your financial goals.
Why Stock Analysis Is Your Most Important Skill
Jumping into the stock market without a plan is like trying to drive across the country without a map. Sure, you might get lucky and stumble upon your destination, but you’re far more likely to get hopelessly lost. Stock analysis is your map.
It gives you the confidence to do more than just buy shares in companies you recognize from TV commercials. It's the actual work of digging into a stock to figure out where it’s headed and whether it’s a good fit for your money.
When you know how to properly analyze a stock, you can do three critical things:
- Find Real Value: You learn to spot solid companies that the market might be overlooking, instead of just chasing the hot stock of the week.
- Manage Your Risk: Getting a handle on a company’s debt, profits, and place in its industry helps you dodge bullets and protect your hard-earned capital.
- Invest With a Purpose: Analysis makes sure the stocks you pick actually line up with what you're trying to achieve, whether that's long-term growth or a steady stream of income.
This entire skill is built on two core methods. Think of them as the two most essential tools in your investing toolkit. Each one gives you a completely different way to look at a potential investment.
The Two Pillars of Stock Analysis
First up is fundamental analysis. This is where you become a business detective. You're digging deep into a company's financial statements—the income statement, balance sheet, and cash flow statement—to figure out its real health and intrinsic value.
Is the company actually making money? Can it handle its debt? Does it have a real, sustainable edge over its competitors? This approach is all about understanding the "why" behind an investment.
The second pillar is technical analysis. This is more like being a market psychologist. Instead of pouring over financial reports, you’re studying stock charts, price patterns, and trading volume to get a feel for market sentiment.
Is the stock's price on an upward trend? Are there specific price levels where everyone seems to be buying or selling? This approach helps you figure out the "when" of an investment—the timing.
To help you see the difference clearly, here’s a quick breakdown of how these two approaches stack up.
Fundamental vs. Technical Analysis: A Quick Overview
This table breaks down the core differences between the two main stock analysis methods. Understanding this will help you decide which approach, or combination of approaches, works best for you.
| Aspect | Fundamental Analysis (The 'Why') | Technical Analysis (The 'When') |
|---|---|---|
| Main Goal | Determine a company's intrinsic value. | Identify trading opportunities based on market trends. |
| Time Horizon | Long-term (months, years, decades). | Short-term (days, weeks, months). |
| Tools Used | Financial statements, economic data, industry trends. | Stock charts, price patterns, technical indicators (like moving averages). |
| Key Question | "Is this a good company to own?" | "Is now a good time to buy or sell?" |
| Investor Type | Long-term investors, value investors (like Warren Buffett). | Traders, swing traders, day traders. |
Ultimately, many of the most successful investors use a blend of both. They use fundamental analysis to find great companies and then lean on technical analysis to find a good entry point.
"The individual investor should act consistently as an investor and not as a speculator." – Ben Graham
Ben Graham’s timeless advice hits the nail on the head. Analysis is what separates true investing from pure speculation. It's about building a solid, evidence-based case for every dollar you put into the market.
Understanding the Sheer Scale of the Market
When you learn to analyze stocks, you're plugging into a massive global machine. Just to give you some context, the total global market capitalization is expected to hit a mind-boggling $127.4 trillion in 2025. The United States accounts for the biggest piece of that pie, at roughly $44.8 trillion.
Giant exchanges like the Nasdaq and the New York Stock Exchange are the nerve centers of all this activity. Understanding a company’s size (its market cap) and where it trades helps you see how your individual investments fit into this enormous economic landscape. If you want to dive deeper, you can explore more stock market statistics to see the bigger picture.
By learning these skills, you’re not just picking stocks. You’re building a framework to navigate this vast market with purpose and confidence.
Decoding a Company's Financial Health
Want to know the secret to picking solid stocks? Forget the talking heads on TV and the latest market craze. You need to become a business detective.
To really get what makes a stock tick, you have to look past the ticker symbol and dig into the health of the actual company behind it. This is what we call fundamental analysis, and it all starts with learning to read a company's financial story.
This story is told through three key documents: the income statement, the balance sheet, and the cash flow statement. Don't worry, you don't need an accounting degree. You just need to know where to look.
The Three Core Financial Statements
Think of these documents as a company's annual check-up, its report card, and its bank statement all rolled into one. Each one gives you a different piece of the puzzle.
-
The Income Statement is pretty straightforward. It shows you if a company is making or losing money over a certain period, like a quarter or a year. It lists out the revenue, subtracts all the costs, and lands on the net income—the famous "bottom line."
-
The Balance Sheet is more like a snapshot in time. It shows what a company owns (assets) and what it owes (liabilities). The core idea is simple: Assets = Liabilities + Shareholders' Equity. This tells you if the company is on solid ground or drowning in debt.
-
The Cash Flow Statement is arguably the most important of the three. It tracks every dollar coming in and going out. Why does this matter so much? Because a company can look profitable on paper but still go bankrupt if it runs out of actual cash. This statement shows you the real-deal money situation.
As you start pulling these reports, you'll quickly realize you're dealing with a lot of data. Learning how to manage it all is a skill in itself. For some great tips on keeping your research organized, check out these resources on effective research data management.
Key Metrics That Tell the Real Story
Once you get comfortable with the main statements, you can start pulling out a few key numbers that give you some powerful insights. These ratios cut through the noise and help you compare different companies without getting lost in the weeds.
Let's break down three of the most important ones for anyone just starting to analyze stocks.
1. Earnings Per Share (EPS)
You'll hear this one thrown around all the time, and for good reason. EPS tells you exactly how much profit a company generated for each outstanding share of its stock.
Calculation: (Net Income – Preferred Dividends) / Average Outstanding Shares
A company whose EPS is consistently climbing is usually a sign of a healthy, growing business. It's a direct line to a company's earning power, which is what really drives a stock's value over the long haul. If you want to dive deeper, we have a whole guide on what Earnings Per Share really means.
2. Price-to-Earnings (P/E) Ratio
The P/E ratio takes EPS and puts it into context. It compares the company's stock price to its earnings, giving you a quick read on whether the stock seems cheap or expensive right now.
Calculation: Market Value Per Share / Earnings Per Share (EPS)
A super-high P/E isn't automatically bad; it often means investors are betting on huge future growth (think of a hot tech startup). On the flip side, a low P/E might mean the stock is a bargain, or it could signal that investors don't expect much growth (like a stable utility company). Context is king here.
Real-World Scenario Comparing P/E Ratios
| Company Type | Example P/E Ratio | What It Suggests |
|---|---|---|
| High-Growth Tech | 45x | Investors are paying $45 for every $1 of current earnings, betting on rapid future growth. |
| Stable Utility | 15x | Investors are paying $15 for every $1 of current earnings, expecting steady but slow growth. |
See how different they are? This is why you never look at a P/E ratio in a vacuum. You have to compare it to other companies in the same industry and to the company's own historical P/E.
3. Debt-to-Equity (D/E) Ratio
This metric is your go-to for sniffing out financial risk. It measures how much debt a company is using to run its business compared to how much of its own money (shareholders' equity) is in the game.
Calculation: Total Liabilities / Shareholders' Equity
A high D/E ratio, usually anything over 2.0, means a company is leaning heavily on debt. That can turbocharge growth, but it's risky if business suddenly slows down. A lower ratio points to a more conservative, stable company. Just remember, some industries (like banking) are naturally debt-heavy, so always compare apples to apples.
Learning to read these numbers is like learning a new language—the language of business. It gives you the power to look past the headlines and make smart decisions based on a company's actual performance and financial strength.
Finding a Stock's Fair Value
Spotting a fantastic, well-run company is only half the battle. Seriously. The next question every investor has to ask is: "Am I paying a fair price for this thing?" Even the best business on the planet can be a terrible investment if you overpay, which is why figuring out a stock's real value is so critical.

This all comes down to estimating a company's intrinsic value—what its shares are truly worth based on its financial health and future potential, not just its fickle day-to-day stock price. The goal is simple: buy stocks for less than they are actually worth. A crucial part of this is getting good at building stronger financial models.
The Cornerstone of Value Investing: Margin of Safety
The legendary investor Benjamin Graham gave us a concept that has been the north star for value investors for decades: the margin of safety. Think of it as your investing cushion, a built-in buffer for when things inevitably go wrong.
Buying a stock with a margin of safety means you're purchasing it for a lot less than your estimate of its intrinsic value. Let's say you do your homework and figure a stock is worth $100 per share. If you can buy it at $70, you’ve just given yourself a $30 margin of safety.
This buffer is your protection if:
- Your analysis was a bit too rosy: Hey, nobody's perfect. Your valuation might be off.
- The company hits a rough patch: Unexpected industry issues or internal stumbles can hurt performance.
- The whole market takes a dive: A bear market can drag down even the best stocks for a while.
"The function of margin of safety is, in essence, that of rendering unnecessary an accurate estimate of the future. If the margin is a large one, then it is enough to assume that future earnings will not fall far below those of the past in order for an investor to feel sufficiently protected."
This idea is the very heart of value investing. It shifts your focus from trying to perfectly predict the future to simply buying good assets at a cheap enough price to survive an uncertain one. If this approach resonates with you, you'll probably enjoy our deep dive on the differences between growth and value stocks.
How Market Fear Creates Opportunity
So where do you find these amazing deals? The best times to find stocks with a wide margin of safety often pop up during periods of market panic. When fear is running high, people sell everything, pushing the prices of excellent companies down to bargain-bin levels. This is where a disciplined analyst can clean up.
We saw a perfect real-world example of this recently. As of mid-2025, the U.S. stock market was trading at a modest 3% discount to what analysts considered its fair value. Not bad.
But just a couple of months earlier, in April 2025, widespread pessimism had shoved the market down to a much more attractive 17% discount to fair value. That created a huge margin of safety and was a clear signal for many long-term investors to start buying.
This scenario drives home a key lesson: the market price is what you pay, but value is what you get. Learning to analyze stocks is all about developing the skill and the patience to tell the difference. By focusing on buying great companies at a discount, you build a resilient portfolio that can weather any storm and deliver solid results over the long haul.
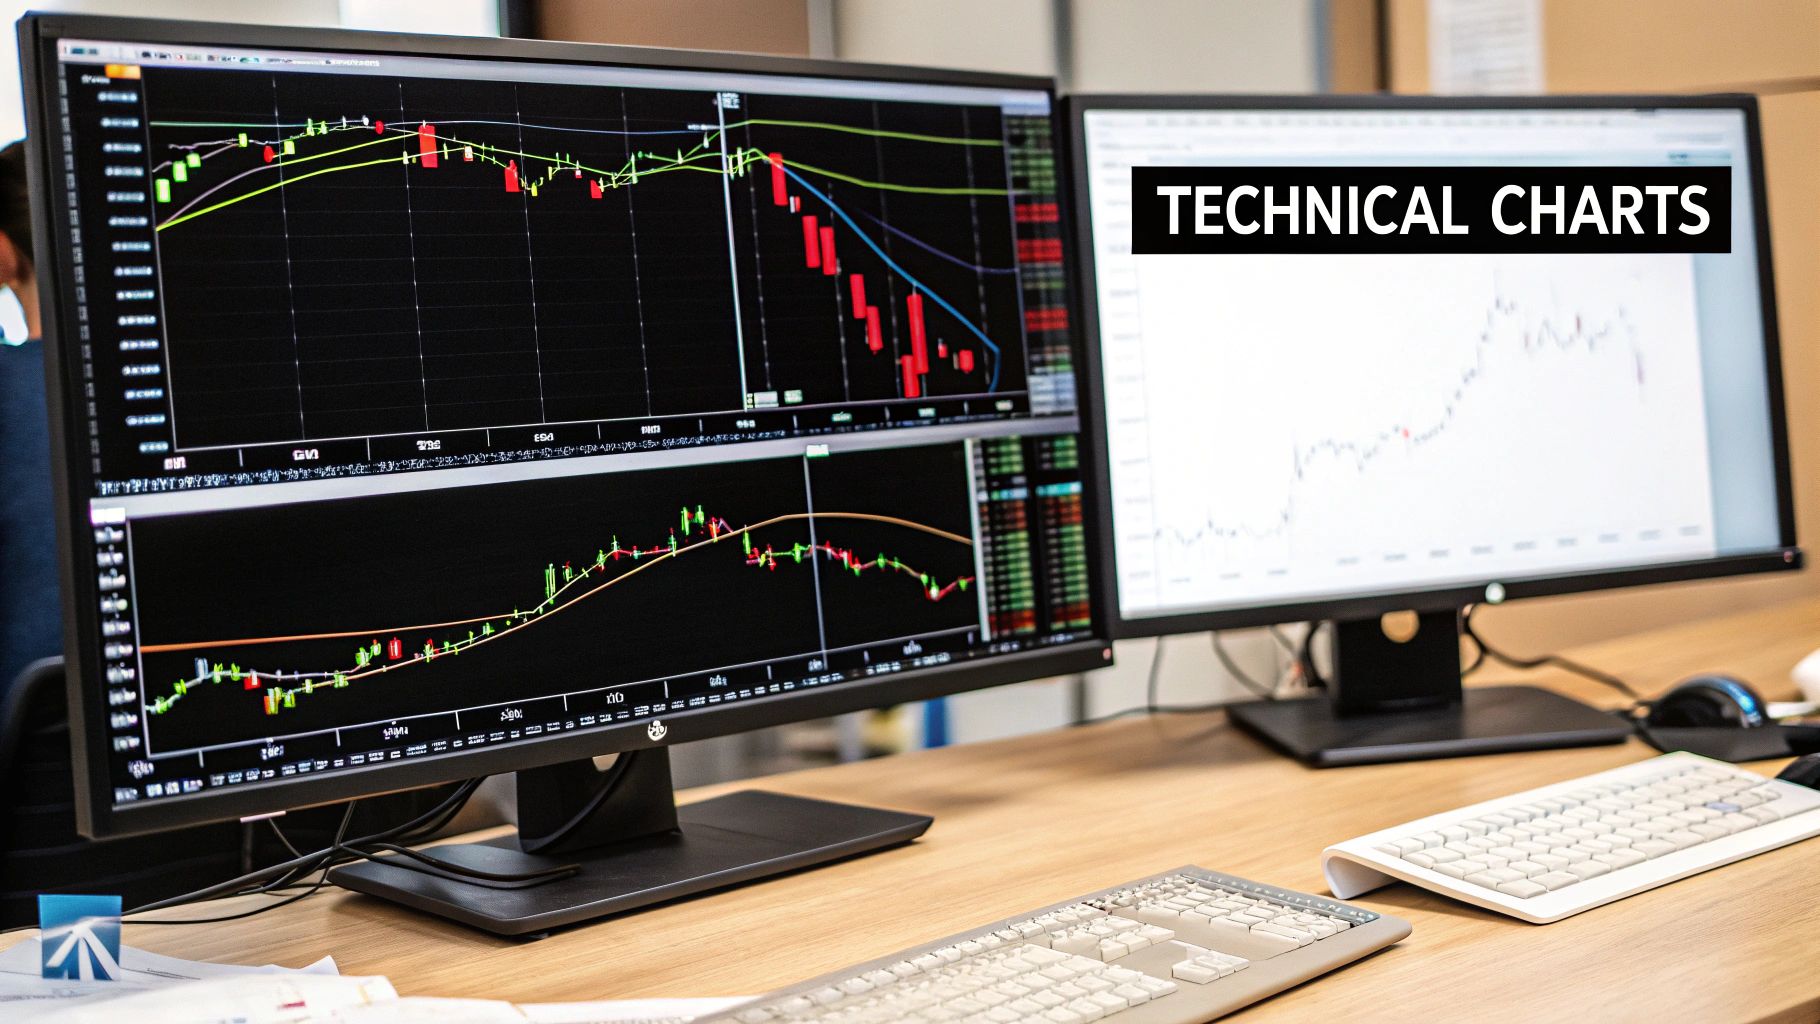
Reading the Story of a Stock Chart
If fundamental analysis is about digging into a company's financial health, technical analysis is more like reading the market's collective mood. It's the art of studying stock charts to get a feel for where the price might be headed next, all based on what it's done in the past. It might look complex, but you definitely don't need to be a Wall Street quant to get the hang of it.
At its heart, technical analysis works on a pretty simple idea: the price you see on the screen reflects everything the market knows and, more importantly, history tends to rhyme. By learning to spot key patterns in price and trading volume, you can get a powerful glimpse into market psychology—the dance between fear and greed that drives millions of investing decisions.
This approach helps you tackle the all-important "when" questions. When is a good time to buy? When should you think about selling? Let's walk through three core concepts you can start using right away.
First, Figure Out the Primary Trend
Before you do anything else, the first thing to do with any stock chart is to zoom out. You're looking for the big picture, the overall direction of travel. This is the trend, and having it on your side is like swimming with the current instead of against it. Is the price generally climbing, falling, or just treading water?
- Uptrend: You'll see a series of "higher highs" and "higher lows." Each time the stock hits a new peak, it's higher than the last one, and each time it dips, the bottom is higher than the previous dip. This is a clear signal that buyers are in charge.
- Downtrend: This is the exact opposite, defined by "lower highs" and "lower lows." It tells you sellers have the upper hand and are pushing the price down.
- Sideways Trend (Consolidation): Here, the price bounces around in a fairly tight range, not really making any progress up or down. This usually signals a bit of indecision in the market, like a tug-of-war between buyers and sellers.
There’s an old saying on Wall Street: "The trend is your friend." All it means is that you'll generally have an easier time and take on less risk if you trade with the primary trend instead of trying to fight it.
Spotting Support and Resistance Levels
As you stare at a chart, you'll start to notice the price seems to hit invisible floors and ceilings. These are what we call support and resistance levels. They’re basically psychological battlegrounds where a ton of buying or selling pressure kicks in.
Support: The Price Floor
Support is a price level where a downtrend tends to run out of steam because of a concentration of buyers. Think of it as a floor propping the price up. When a stock's price falls to a support level, buyers often jump in, thinking they've found a good deal. That influx of demand can be enough to stop the slide and push the price back up.
Resistance: The Price Ceiling
Resistance is the opposite of support. It's a price level where an uptrend often stalls out, hit by a wave of selling. As the price climbs toward a resistance level, investors who bought lower start to see it as a great time to lock in their profits. This selling creates a ceiling that the price has a hard time breaking through.
A huge moment to watch for is when an old resistance level is broken. More often than not, that old ceiling becomes a new floor. This is a very bullish signal, suggesting the upward momentum has some real strength behind it.
Why Trading Volume Matters
Price tells you where a stock has been, but trading volume gives you a sense of the conviction behind that move. Volume is simply the total number of shares that changed hands over a given period, usually a day. You'll see it as a series of vertical bars at the bottom of a stock chart.
Think of volume as the fuel in the engine. A big price jump on huge volume is a much more powerful signal than the same price move on light volume. It shows that a lot of investors are piling in, which helps confirm the trend. On the flip side, a sharp price drop on heavy volume can signal panic and intense selling pressure.
Of course, a company's real-world financial performance is what drives its stock over the long haul. To get a better handle on how money actually flows through a business, it’s worth taking the time to learn more about what cash flow analysis is and how it connects to the story you see on the chart.
Using Moving Averages to Smooth Out the Noise
One of the most beginner-friendly and effective tools in technical analysis is the moving average (MA). An MA literally smooths out the choppy, day-to-day price action to give you a clearer view of the underlying trend. It works by calculating the average price of a stock over a set number of days.
Two of the most widely followed moving averages are:
- 50-Day Simple Moving Average (SMA): This is often used as a proxy for the medium-term trend.
- 200-Day Simple Moving Average (SMA): This is the big one, often seen as the definitive line in the sand for the long-term trend.
Generally speaking, when a stock's price is trading above both its 50-day and 200-day moving averages, it's considered to be in a healthy uptrend. If the price falls below these key levels, it can be a red flag that the trend is losing steam or even reversing. It's a simple way to help keep the market's momentum on your side.
Making It Stick: Your Stock Analysis Game Plan
Alright, you've absorbed the theory on financial statements, valuation metrics, and chart patterns. Now what? Knowledge is great, but without a repeatable process, it's just trivia. The real goal is to turn what you've learned into a confident, evidence-based investing decision.
This is where you build your own workflow. Having a consistent routine is your best defense against making emotional, seat-of-your-pants decisions. It’s the framework that keeps you objective and ensures you've covered all the critical bases before putting your hard-earned money on the line.
Creating Your Analysis Workflow
The point isn't to find the "perfect" stock—that doesn't exist. Instead, you're building a strong case for why a company is a solid investment right now. Here’s a simple, repeatable process that combines everything we've talked about.
- The Story & The Screen: Start with a company in an industry you actually understand. What's their business model? Who are they up against? Grab their latest annual report (the 10-K) and read the "Business" and "Management's Discussion and Analysis" sections. This gives you the narrative behind the numbers.
- The Financial Health Check: Hop on a free tool like Yahoo Finance. Pull up the financials and look for trends over the last three to five years. Is revenue growing consistently? Is net income positive? Is cash flow from operations healthy?
- The Key Ratio Check: Now, dig into the metrics. Is the P/E ratio in the same ballpark as its direct competitors? Is the Debt-to-Equity ratio under 2.0 (or at least in line with its industry average)? Is the EPS heading in the right direction?
- The Technical Temperature Check: Fire up a chart on a platform like TradingView. Is the stock price trading above its 200-day moving average? That’s a classic sign of a long-term uptrend. Then, eyeball the chart to find the most obvious support and resistance levels.
- Building Your Thesis: Time to connect the dots. In one or two paragraphs, write down exactly why you think this stock is a good buy at its current price, based on your findings from the steps above.
Following a structured approach like this is the best way to avoid "analysis paralysis"—that feeling of being so buried in data that you can't make a decision. The goal here is conviction, not absolute certainty.
Sidestepping Common Beginner Mistakes
As you start analyzing real companies, you're going to hit some bumps. The best investors aren't the ones who never make mistakes; they're the ones who learn how to manage them. Discipline is everything.
One of the biggest traps for new investors is underestimating how much one stock can swing a small portfolio. If you have a $1,000 portfolio and put $200 into five different stocks, a single big winner or loser will have a massive impact. A stock that triples can pull your whole portfolio up, but one that tanks can just as easily wipe out all your other gains. You can discover more insights about portfolio risk on YouTube to see this in action.
A Pro Tip on Risk: Never put more money into one stock than you’re truly comfortable losing. The fastest way to blow up your account is by making emotional moves driven by fear or greed.
Before you buy a single share, you need a risk management plan. This infographic breaks down a simple, three-step way to think about risk before you enter a position.
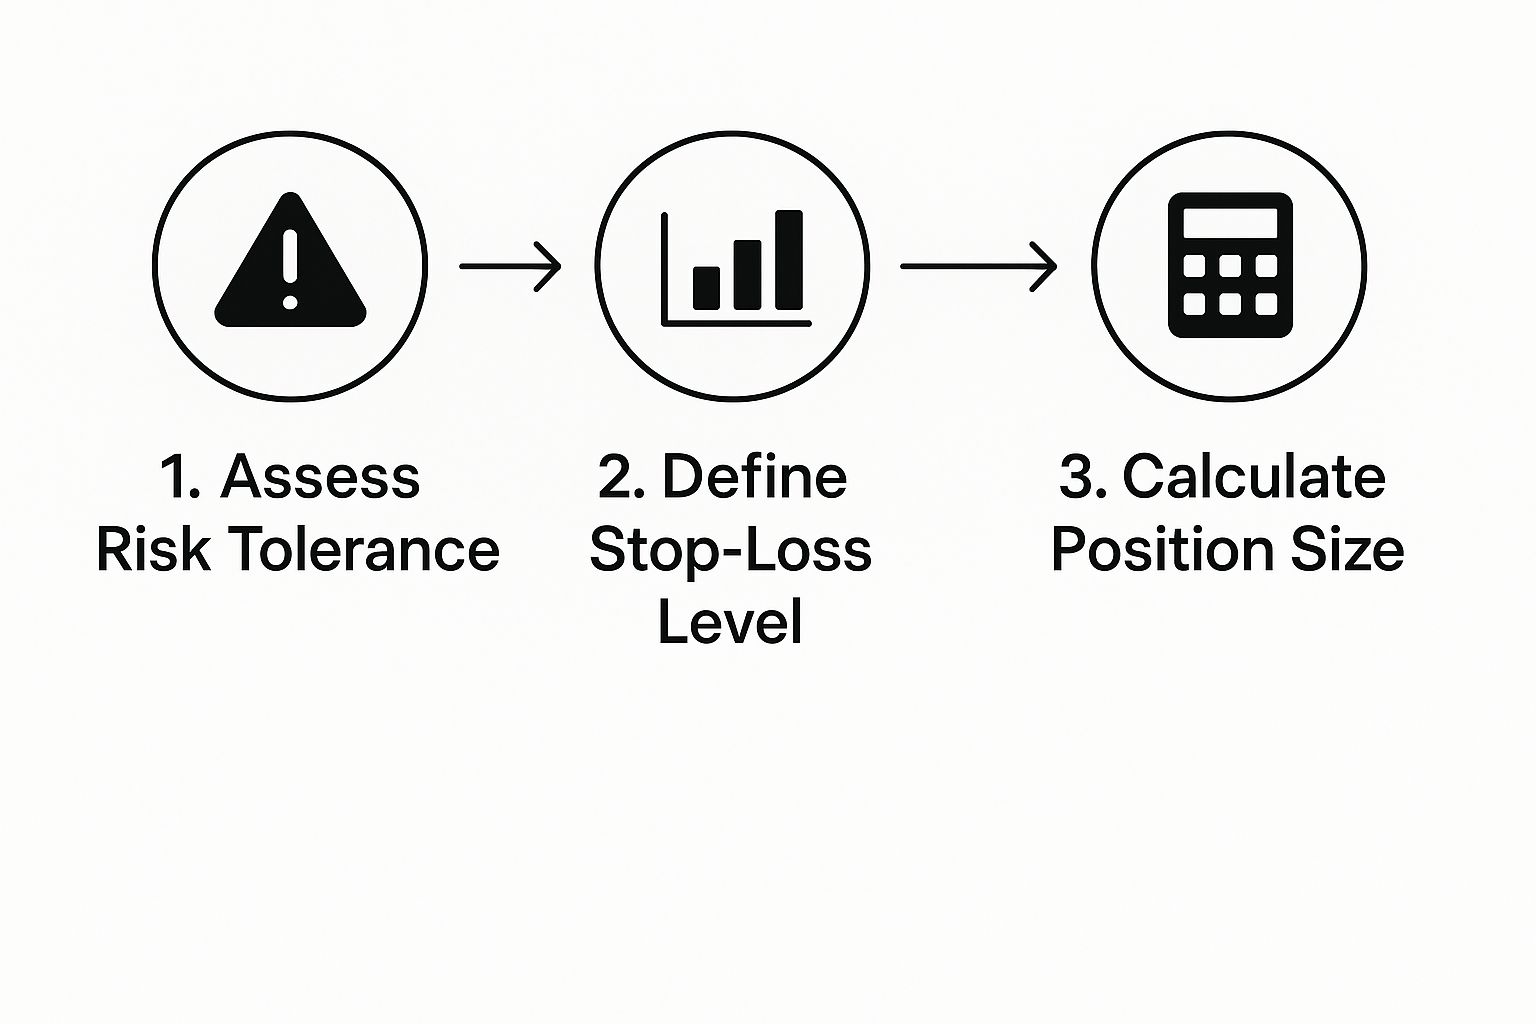
As the visual shows, your personal risk tolerance sets the stage for your stop-loss, which in turn helps you figure out the right position size for that specific trade.
Common Questions About Stock Analysis
Once you get past the theory, a whole new set of practical questions pop up. It happens to everyone. Moving from reading about analysis to doing your first analysis is where the real learning begins, and it's totally normal to hit a few snags.
Let's walk through some of the most common questions that trip up beginners when they're just getting their hands dirty.

How Much Money Do I Need to Start Buying Stocks?
Honestly, you don't need a fortune to get in the game. Most modern brokerages now offer fractional shares, which means you can start with as little as $5 or $10. This is a game-changer. It lets you buy a small piece of a company like Apple or Amazon, even if a single share costs hundreds of dollars.
The real key isn't how much money you start with. It's about building the habit of consistent investing and doing your homework. The principles are exactly the same whether you're investing $100 or $100,000. By starting with an amount you're comfortable losing, you get priceless, real-world experience without putting your finances at major risk.
What Are the Best Free Tools for Stock Analysis?
You can get an incredible amount of high-quality information without paying a dime. When you're just learning the ropes, there's absolutely no need to shell out for expensive subscription services.
Here are a few of my go-to starting points:
- Fundamental Data: You can't go wrong with Yahoo Finance, Google Finance, or Finviz. They give you full financial statements, all the key ratios, and company news, completely free.
- Charting and Technicals: The free version of TradingView is ridiculously powerful. It has more than enough firepower for a beginner to start spotting trends, support levels, and resistance zones.
- Your Broker's Tools: Don't overlook what you already have. Most online brokers provide their customers with a solid suite of research tools. Check out what your platform offers before you go looking elsewhere.
The goal is to build a solid process first. A fancy tool won't make you a better analyst, but a repeatable process will. Master the free resources, and only think about paid tools if you hit a wall that a specific feature can solve.
How Long Should I Spend Analyzing a Stock?
There's no magic number here, but if you're a beginner, expect to spend a few focused hours on a single company for your first deep dive. This isn't a 15-minute job. Not if you want to do it right.
A thorough first pass usually involves:
- Reading the most recent annual report (the 10-K), especially the "Management's Discussion and Analysis" section. This is where they tell their story.
- Scanning the last few quarterly reports to see what's been happening lately.
- Getting a handle on the company's main competitors and where it fits in the industry.
- Pulling up a long-term price chart to understand the stock's historical behavior.
As you do this more and more, you'll get much faster and develop an intuition for it. The end goal is to get to a point where you can confidently explain why you're buying the stock to someone else in plain English. That’s your investment thesis.
Should I Focus on Fundamental or Technical Analysis?
Ah, the classic debate. For most people, the answer isn't one or the other—it's using both, but for different jobs.
Think of it this way: fundamental analysis is your foundation, especially for long-term investing. It’s how you find great companies that are actually worth owning for years. It answers the question, "What should I buy?"
Technical analysis is a fantastic complementary tool. It helps you time your entries and exits by giving you a read on market psychology and momentum. It answers the question, "When should I buy?"
A powerful strategy is to use fundamentals to identify a high-quality business you want to own, and then use technicals to find a good opportunity to actually pull the trigger and buy the stock.
Leave a Reply